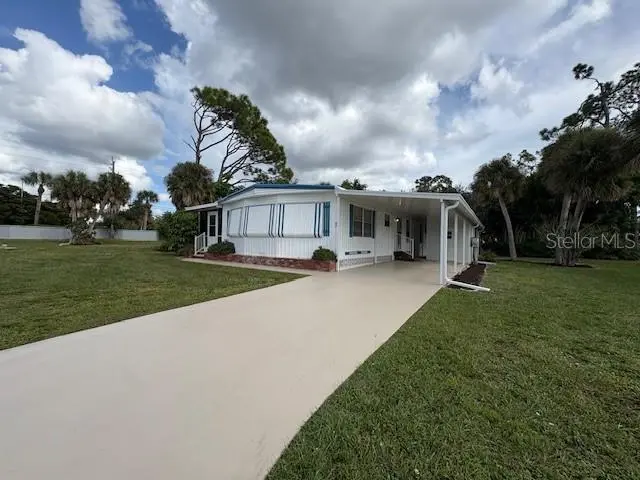
51 N Flora Vista St · Englewood, FL
Flood risk 4/10 · Minor
- FEMA flood zone
- X (shaded)
- Chance of flooding over 30 yrs
- 0.23%
- Est. flood insurance / yr
- $507 – $1,088
Fire risk 3/10 · Minor
- Est. fire insurance / yr
- $947 – $1,759
Heat risk 10/10 · Severe
- Hot days now (above 107°F)
- 7 days/yr
- Hot days in 30 yrs
- 29 days/yr
Wind risk 10/10 · Severe
- Chance of severe wind over 30 yrs
- 99.0%
Air-quality risk 3/10 · Minor
- Unhealthy air days now
- 2 days/yr
- Unhealthy air days in 30 yrs
- 2 days/yr
Risk factors via First Street. Map © Google.
Why this score? — see what drove the B grade
The composite is a weighted blend of 9 inputs, each scored 0–100. Each bar is that input's sub-score; the figure is the points it added to the 100-point composite (weight × sub-score).
- Cash flow +30.0/30.0
- 1% rule +10.0/10.0
- DSCR +10.0/10.0
- ARV discount +7.5/15.0
- Schools +5.4/10.0
- Rent growth +4.8/5.0
- Livability +3.7/5.0
- Condition / age +2.5/5.0
- Appreciation +0.0/10.0
$139,000
🖨 Deal sheet 📄 Offer letter ✓ Due diligence
Listing remarks MLS
HIGHLY DESIRABLE, COMMUNITY of ALAMEDA ISLES. Turnkey Furnished. Carefree living in a gated and maintenance free 55+ community, with access to the intracoastal waterway and gulf. The community itself is located just minutes from area beaches, shopping, restaurants and world class golf courses. Amenities include a heated swimming pool and spa, fitness center, tennis and pickleball courts, shuffleboard and bocce, and a clubhouse featuring a library, craft rooms, game rooms, sauna. Also, a private marina with boat slips available for rent TURN-KEY FURNISHED, 2 bedroom, 2 bath and large walk-in closets. Kitchen and bathroom flooring replaced with lamented wood flooring. Open floor plan with bay windows in the great room. Enjoy your morning coffee or afternoon cocktail on you screened side porch, looking out to the yard and a partially wooded 9,500 sq ft lot (not your neighbors car port)! New car port, laundry / storage shed and screened side porch in 2025.
Key facts
- Gated community
- Access to gulf
- 9,568 sq ft lot
Tags
Neighborhood map
What this means for you Summary
Snapshot
- This is a 2-bed/2.0-bath manufactured listed at $139k.
Deal economics
- At list price, monthly cash flow is $737 ($9k/yr) — positive.
- The deal already cash-flows at list — no discount required.
- Meets the 1% rule at list price ($3k rent vs $139k).
- Recommended offer: $122k (12.0% below list) — sets the bar for market timing.
- Cap rate 12.7% vs local median 3.8% in Englewood — top-decile yield for the area; either an underpriced asset or a hidden risk that comps aren't pricing in. Stress-test before assuming the spread holds.
Location & tenants
- Location reads 73/100 on livability (#321 in FL) — a middle-class / working-renter tenant base. Strengths: housing A+, cost of living A, health & safety A; Watch: employment C-, amenities F, commute F.
- Sarasota (urban): math 63% / reading 63% proficiency, ranked #7 of 73 in FL (top 10%) — acceptable for families but not a draw, mixed tenant base, ~2y average lease.
- Market conditions: Rents rising fast (+9.0%/yr); 717 active listings in the ZIP; solid renter incomes; 7,466 units permitted in Sarasota County in 2024 (2,138 in 5+ unit buildings).
- This rent runs 40% of the median local income ($76k/yr) — at the standard rent-burdened threshold; future hikes will face affordability resistance.
Forward outlook
- Local home prices are declining (-3.0%/yr); year-one equity from $961 of loan paydown is wiped out by about $4k of value loss. Plan a longer hold.
- Sarasota County population projected at +20% by 2050 — long-run rental-demand tailwind backs the buy-and-hold thesis.
- At projected returns (-3.0% appreciation + 8.0% rent growth), your $39k cash investment doubles in ~5 years — after that, you're playing with house money.
Negotiation context
- It's been on market 128 days — a 12% lower offer ($122k) is reasonable based on typical stale-listing flexibility.
- 2 sale attempts since 22y ago; this cycle's ask has dropped $10k (7%) from the opening price — seller is motivated, your offer sets the floor, not the list.
Risks & watch-outs
- Climate carrying-cost: severe wind risk, 99% chance of damaging wind over 30y; extreme-heat days projected 7→29/yr by 2055 (HVAC capex compounding) — expect insurance premiums to compound above CPI over the hold.
Questions for the listing agent
- It's been on market 128 days. Have you received any prior offers? Is the seller open to a 12% concession, seller financing, or rate buy-down credit?
- What does the HOA fee cover, when was the last increase, and are there any pending special assessments or reserve-fund shortfalls?
- Why hasn't it sold? Are there any deal-killer items the seller is aware of (foundation, flood, title, zoning, code violations)?
- Is there a deadline driving the sale (1031 exchange, divorce, estate, relocation)? That informs how much negotiation room exists.
- Schools are A-rated — typically a magnet for longer-tenancy family renters. What's the average tenant stay here, and is there a school-zone premium baked into asking?
- What's the average days-on-market for RENTAL listings here right now (not sales)? A rising rental-DOM trend means longer vacancies and softer asking-rent achievability than the comps imply.
- What's the recent tenant-quality profile in this submarket — average credit score on applications, eviction rate, late-payment / NSF rate, and stable-employment percentage? A property-management company in the area should have these aggregated.
- How much new for-sale + rental construction is in the pipeline within 1–3 miles? Heavy new supply typically softens prices + rents 12–24 months out; constrained supply supports both.
Investment metrics
- 1% rule
- 1.83% ✓
- Cap rate
- 12.66%
- Cash-on-cash
- 22.73%
- DSCR
- 2.01
- GRM
- 4.6
CMA / ARV
No comps found within radius.
Projected returns pro-forma
-3.0% appreciation · 8.0% rent growth · sell at horizon
- IRR
- 22.2%
- Equity multiple
- 1.98×
- Total profit
- $38,084
- Equity at exit
- $20,725
- IRR
- 33.8%
- Equity multiple
- 5.00×
- Total profit
- $155,688
- Equity at exit
- $12,018
Cash invested: $38,920 (down + closing). Projections, not guarantees.
Landlord ↔ Tenant lean methodology
- Overall (STATE)
- 87 Strongly Landlord-Friendly
- State Florida
- 87 Strongly Landlord-Friendly · R+3
- County
- — inherits STATE
- City
- — inherits STATE
ZIP-level market 34223
- Home prices YoY
- -34.2%
- Rents YoY
- 9.0%
- Active inventory
- 717
- Price-to-rent
- 4.6×
Monthly cashflow live
- Estimated rent
- $2,542 medium interval (Pro) →
- Mortgage (P&I)
- −$729
- Tax from tax record
- −$166 /mo · $1,996/yr
- Insurance
- −$58
- HOA
- −$318
- Vacancy / Maint / Mgmt
- −$534
- Net cashflow
- $737
Break-even live
UW: 25.0% down · 7.5% · 30yr · 1.5% tax · 5.0% vac · 8.0% maint · 8.0% mgmt
Financing live
Cash to close
- Down payment
- $34,750
- Closing costs
- $4,170
- Reserves months
- —
- Total cash needed
- —
Loan-product check · same deal, 3 products live
Conventional
25% down · 7.5% · 30yr
- Down + closing
- —
- Monthly P&I
- —
- Monthly cashflow
- —
- DSCR
- —
- Eligible?
- —
Personal DTI + credit; lowest rate.
DSCR
20% down · 8.5% · 30yr
- Down + closing
- —
- Monthly P&I
- —
- Monthly cashflow
- —
- DSCR
- —
- Eligible?
- —
No personal income docs; deal must DSCR.
Hard money
10% down · 12.0% · 12mo
- Down + closing
- —
- Monthly P&I
- —
- Monthly cashflow
- —
- DSCR
- —
- Eligible?
- —
Short-term bridge; refi at stabilization.
HOA detail
- Monthly dues
- $318 · $3,816/yr
- Likely covers
- waterpoolgymsecurity
Listing history 19 events
-
2026-06-18days on market $139,000 Active 128 DOM
-
2026-06-17pricedays on market $139,000 Active 127 DOM
-
2026-06-16days on market $149,000 Active 126 DOM
-
2026-06-15days on market $149,000 Active 125 DOM
-
2026-06-13days on market $149,000 Active 123 DOM
-
2026-06-13days on market $149,000 Active 122 DOM
-
2026-06-10days on market $149,000 Active 120 DOM
-
2026-06-09days on market $149,000 Active 119 DOM
-
2026-06-08days on market $149,000 Active 118 DOM
-
2026-06-08days on market $149,000 Active 117 DOM
-
2026-06-05days on market $149,000 Active 114 DOM
-
2026-06-03days on market $149,000 Active 113 DOM
-
2026-06-02days on market $149,000 Active 112 DOM
-
2026-06-01days on market $149,000 Active 111 DOM
-
2026-05-31days on market $149,000 Active 110 DOM
-
2026-02-10$149,000 Active 972-char remark
Show marketing remark (972 chars)
HIGHLY DESIRABLE, COMMUNITY of ALAMEDA ISLES. Turnkey Furnished. Carefree living in a gated and maintenance free 55+ community, with access to the intracoastal waterway and gulf. The community itself is located just minutes from area beaches, shopping, restaurants and world class golf courses. Amenities include a heated swimming pool and spa, fitness center, tennis and pickleball courts, shuffleboard and bocce, and a clubhouse featuring a library, craft rooms, game rooms, sauna. Also, a private marina with boat slips available for rent TURN-KEY FURNISHED, 2 bedroom, 2 bath and large walk-in closets. Kitchen and bathroom flooring replaced with lamented wood flooring. Open floor plan with bay windows in the great room. Enjoy your morning coffee or afternoon cocktail on you screened side porch, looking out to the yard and a partially wooded 9,500 sq ft lot (not your neighbors car port)! New car port, laundry / storage shed and screened side porch in 2025.
-
2005-07-15soldstatus $133,900
-
2005-02-04soldstatus $133,900 311-char remark
Show marketing remark (311 chars)
Alameda Isles luxury waterfront park. Exceptional 2Br 2Ba. dbl. wide, partially furnished, in a lush park like setting. New roof 2003,A/C 2004. Bay windows on front & rear of this spacious, airy home. Boat to Lemon Bay & ICW or enjoy golfing, swimming, tennis or any of the many amenities available.
-
2004-10-28$139,900 311-char remark
Show marketing remark (311 chars)
Alameda Isles luxury waterfront park. Exceptional 2Br 2Ba. dbl. wide, partially furnished, in a lush park like setting. New roof 2003,A/C 2004. Bay windows on front & rear of this spacious, airy home. Boat to Lemon Bay & ICW or enjoy golfing, swimming, tennis or any of the many amenities available.
ⓘ Source: listings_history table (triggers on properties + properties_extension) + one-shot
backfill from property_details.listing_events for pre-trigger history.
Tax reassessment forecast FL · Resets to sale price
- Current annual tax
- $1,996 · $166/mo
- Projected year-2 tax
- $1,996 · $166/mo
- Expected delta
- $0/yr ($0/mo · 0.0%)
ⓘ Screening estimate from a state-policy table — verify with the county assessor before closing.
Climate risk First Street
- Flood 4/10 Moderate FEMA zone X (shaded) · 23% chance over 30 yrs
- Wildfire 3/10 Moderate
- Heat 10/10 Extreme 7 d/yr ≥107°F today · 29 d/yr by 30 yrs out
- Wind 10/10 Extreme 99% chance of damaging wind over 30 yrs
- Air quality 3/10 Moderate 2 unhealthy d/yr today · 2 by 30 yrs out
Nearby sold comps map
Loading sold comps map…
Walkable amenities ~0.75 mi
Loading nearby amenities…
Taxation est. · year 1
- Rental income
- $30,506
- − Mortgage interest
- −$7,786
- − Property taxes
- −$1,996
- − Insurance
- −$695
- − Repairs & maintenance
- −$2,440
- − Management
- −$2,440
- − HOA
- −$3,816
- − Depreciation
- −$4,044
- Taxable income
- $7,287
- Est. tax owed @ 24.0%
- −$1,749
- After-tax cash flow
- $7,096/yr
For passive investors: Depreciation is non-cash, so a rental often shows a tax loss while cash-flowing — sheltering income. Rental losses are passive: they offset passive income freely, and up to $25,000/yr can offset ordinary (W-2) income if you actively participate and your MAGI is under $100k (phasing out to $0 by $150k); unused losses carry forward. On sale, claimed depreciation is recaptured at up to 25%, and gains may owe capital-gains tax (a 1031 exchange can defer both). Figures are a year-1 estimate at your 24.0% rate — not tax advice; consult a CPA.
Schools (NCES district)
- District
- Sarasota
- NCES district ID
- 1201680
- Math proficiency
- 63% ▼ -8.00%
- Reading proficiency
- 63% ▼ -3.00%
- Median HH income
- $51,167
- Composite
- 53.68/100
- National rank
- #1428
- State rank
- #7 of 73 in FL
Livability — Englewood
- Score
- 73/100
- State rank
- #321
- US rank
- #5655
Category grades
Schools grade is shown separately in the Schools card above.
Census & demographics
- Census place
- Englewood, FL
- County
- Sarasota County · 448,376 people
- City population
- 35,420
- Metro
- North Port-Sarasota-Bradenton, FL
- Population (ZIP)
- 19,884
- Household income
- $76,016
- Rent vs Own
- Severe rent burden
- 290.0
Population outlook (Sarasota County) Hauer SSP2
- Today (2025)
- 452,380 people
- By 2030
- 474,175 · +4.8%
- By 2040
- 511,577 · +13.1%
- By 2050
- 541,467 · +19.7%
- By 2075
- 604,947 · +33.7%
- By 2100
- 621,965 · +37.5%
Race, ethnicity, and origin ACS 2023
- Neighborhood character
- Predominantly White (94%)
- Race & ethnicity
- White 94% Two or more races 3% Hispanic / Latino 3% Asian 1%
- Common ancestry
- Romanian 7% Lithuanian 4% Iranian 2%
- Foreign-born
- 9% · Canada
- Languages at home
- 94% English-only · German/W. Germanic 2% Spanish 1% Other Indo-European 1%
Political lean MEDSL · Sarasota
- 2024 margin
- R (+18.2) · D 40.5% · R 58.7%
- 2008→2024 swing
- -18.1pp toward R · 2008: -0.1pp · 2024: -18.2pp
- All cycles
- 2024: R+18.2 2020: R+10.4 2016: R+11.6 2012: R+7.4 2008: R+0.1
Not yet ingested
- Civics
- —
Market trends
- HPI YoY
- ▼ -146.26%
- Current HPI
- 281.0529
- Rent YoY
- ▲ 9.02%
- Metro
- North Port-Sarasota-Bradenton, FL
- State GDP YoY
- ▲ 3.28%
- F500 in state
- 36
Industry mix (Fortune 500 HQ in FL)
| Industry | F500 HQs | Revenue |
|---|---|---|
| Industrial Technology | 2 | $29B |
|
||
| Insurance | 2 | $17B |
|
||
| Retail | 1 | $60B |
|
||
| Technology Distribution | 1 | $58B |
|
||
| Homebuilding | 1 | $35B |
|
||
| Technology Manufacturing | 1 | $35B |
|
||
Price history
+6.5% since first listed4 events — show timeline
- 2026-02-10 Listed $149,000 Stellar MLS as Distributed by MLS Grid
- 2005-07-15 Sold (Public Records) $133,900 Public Records
- 2005-02-04 Sold (MLS) $133,900 Stellar MLS as Distributed by MLS Grid
- 2004-10-28 Listed $139,900 Stellar MLS as Distributed by MLS Grid
Property tax history
+7.6%/yrLatest (2025): $1,996 · +95.1% YoY. Source: county tax records.
Cash-flow waterfall
monthlySold comps — $/sqft
last 12 mo · ≤1 miLoading sold comps…