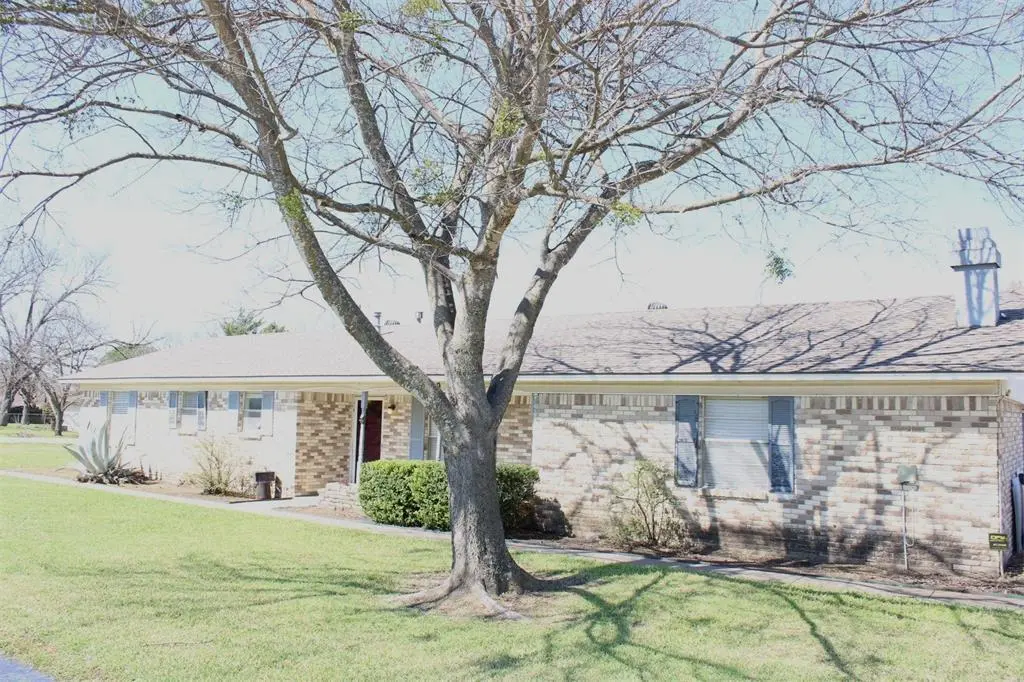
110 E Vanston Ln · Crandall, TX
Flood risk 1/10 · Minimal
- FEMA flood zone
- X (unshaded)
- Chance of flooding over 30 yrs
- 0.0%
- Est. flood insurance / yr
- $507 – $1,088
Fire risk 5/10 · Moderate
- Est. fire insurance / yr
- $1,222 – $2,270
Heat risk 7/10 · Major
- Hot days now (above 110°F)
- 7 days/yr
- Hot days in 30 yrs
- 25 days/yr
Wind risk 6/10 · Moderate
- Chance of severe wind over 30 yrs
- 27.0%
Air-quality risk 2/10 · Minimal
- Unhealthy air days now
- 1 days/yr
- Unhealthy air days in 30 yrs
- 1 days/yr
Risk factors via First Street. Map © Google.
Why this score? — see what drove the D+ grade
The composite is a weighted blend of 9 inputs, each scored 0–100. Each bar is that input's sub-score; the figure is the points it added to the 100-point composite (weight × sub-score).
- ARV discount +15.0/15.0
- Cash flow +13.5/30.0
- 1% rule +5.4/10.0
- DSCR +4.1/10.0
- Schools +3.6/10.0
- Livability +3.4/5.0
- Rent growth +2.5/5.0
- Condition / age +2.5/5.0
- Appreciation +0.0/10.0
$204,900
🖨 Deal sheet (PDF) 📄 Offer letter ✓ Due diligence
Listing remarks MLS
Spacious 3 bedrooms - 1 bathroom house just blocks away from downtown Crandall. This house offers two living areas with a wood burning fireplace and built in bookcase. Fenced in back yard with a storage shed for your lawn equipment Owner-agent
Key facts
- Large living areas
- 0.25 acre lot
- Built 1966
Tags
Neighborhood map
What this means for you Summary
Snapshot
- This is a 3-bed/1.0-bath single-family listed at $205k.
Deal economics
- At list price, monthly cash flow is $6 ($73/yr) — positive.
- The deal already cash-flows at list — no discount required.
- Meets the 1% rule at list price ($2k rent vs $205k).
- Recommended offer: $186k (9.0% below list) — sets the bar for market timing.
- Cap rate 6.3% vs local median 5.3% in Crandall — meaningfully above typical; check what's discounted (condition, days-on-market, listing class) to confirm the premium yield is real.
Location & tenants
- Location reads 68/100 on livability (#507 in TX) — a middle-class / working-renter tenant base. Strengths: employment A+, cost of living A+, housing A+; Watch: crime F, amenities F, commute F.
- Crandall ISD (rural): math 36% / reading 42% proficiency, ranked #351 of 826 in TX (top 42%) — families likely to look elsewhere, expect single-tenant / working-renter base with shorter leases.
- Market conditions: 800 active listings in the ZIP; 3 comparable units currently listed for rent nearby; rentals leasing fast (median 8d on market — plan ~1-2 weeks tenant-placement turnaround); solid renter incomes; 1,747 units permitted in Kaufman County in 2024 (180 in 5+ unit buildings).
Forward outlook
- Local home prices are declining (-3.0%/yr); year-one equity from $1k of loan paydown is wiped out by about $6k of value loss. Plan a longer hold.
- Kaufman County population projected at +43% by 2050 — long-run rental-demand tailwind backs the buy-and-hold thesis.
Negotiation context
- It's been on market 105 days — a 9% lower offer ($186k) is reasonable based on typical stale-listing flexibility.
- 3 sale attempts since 16y ago; this cycle's ask has dropped $15k (7%) from the opening price — seller is motivated, your offer sets the floor, not the list.
Risks & watch-outs
- Watch-outs: property tax is 3.0% of price.
- Climate carrying-cost: major wind risk, 27% chance of damaging wind over 30y; moderate wildfire risk; extreme-heat days projected 7→25/yr by 2055 (HVAC capex compounding) — expect insurance premiums to compound above CPI over the hold.
Questions for the listing agent
- It's been on market 105 days. Have you received any prior offers? Is the seller open to a 9% concession, seller financing, or rate buy-down credit?
- Built in 1966 — when were the roof, HVAC, electrical panel, plumbing, and water heater last replaced?
- Property tax is high relative to price — has the assessment been appealed recently, and will the sale trigger a re-assessment?
- Why hasn't it sold? Are there any deal-killer items the seller is aware of (foundation, flood, title, zoning, code violations)?
- Is there a deadline driving the sale (1031 exchange, divorce, estate, relocation)? That informs how much negotiation room exists.
- Schools are B-rated — typically a magnet for longer-tenancy family renters. What's the average tenant stay here, and is there a school-zone premium baked into asking?
- Crime grade is F in this area — have there been break-ins, vandalism, or insurance claims at this property in the last 3 years? What carrier currently insures it and at what premium?
- The area grade is low — what's the realistic commute time and amenity access for the typical tenant pool here? Any planned neighborhood developments (good or bad) we should know about?
- What's the average days-on-market for RENTAL listings here right now (not sales)? A rising rental-DOM trend means longer vacancies and softer asking-rent achievability than the comps imply.
- What's the recent tenant-quality profile in this submarket — average credit score on applications, eviction rate, late-payment / NSF rate, and stable-employment percentage? A property-management company in the area should have these aggregated.
- How much new for-sale + rental construction is in the pipeline within 1–3 miles? Heavy new supply typically softens prices + rents 12–24 months out; constrained supply supports both.
Investment metrics
- 1% rule
- 1.04% ✓
- Cap rate
- 6.33%
- Cash-on-cash
- 0.13%
- DSCR
- 1.01
- GRM
- 8.0
CMA / ARV
- ARV (median comp)
- $255,415
- List price
- $204,900
- Delta
- -17.82%
- Verdict
- UNDERPRICED
- Comps
- 20 within 1.0 mi
Show comp detail 12 sales within ~0.75 mi
| Address | Dist | Beds/Ba | Sqft | Sold | Price | $/sf | Match |
|---|---|---|---|---|---|---|---|
| 531 Hart Dr | 0.12mi | 4/2.0 (+1) | 1,667 (-9%) | 1mo | $298,999 | $179 | 70 |
| 7836 Reese St | 0.12mi | 4/2.0 (+1) | 1,667 (-9%) | 4mo | $271,999 | $163 | 67 |
| 703 S 4th St | 0.34mi | 4/2.0 (+1) | 1,922 (+5%) | 1mo | $274,900 | $143 | 66 |
| 623 Comal Dr | 0.49mi | 3/2.0 | 1,828 (-0%) | 11mo | $324,900 | $178 | 63 |
| 619 Comal Dr | 0.47mi | 3/2.0 | 1,893 (+3%) | 9mo | $299,900 | $158 | 61 |
| 601 S 4th St | 0.26mi | 3/2.0 | 1,650 (-10%) | 9mo | $299,990 | $182 | 60 |
| 305 W Trunk St | 0.20mi | 3/2.0 | 1,584 (-14%) | 10mo | $255,000 | $161 | 56 |
| 415 Colorado Dr | 0.59mi | 3/2.0 | 1,696 (-8%) | 1mo | $279,990 | $165 | 55 |
| 209 Countryside Dr | 0.39mi | 4/2.0 (+1) | 1,711 (-7%) | 9mo | $240,900 | $141 | 54 |
| 106 Willow Lake Ln | 0.59mi | 4/3.0 (+1) | 1,735 (-6%) | 4mo | $399,000 | $230 | 47 |
| 217 Rio Grande Dr | 0.42mi | 4/2.0 (+1) | 1,604 (-13%) | 9mo | $290,000 | $181 | 42 |
| 322 Pecos Dr | 0.52mi | 4/3.0 (+1) | 2,078 (+13%) | 2mo | $305,000 | $147 | 39 |
Match score weights: distance 35% · size 25% · config 20% · recency 20%. Top-matched comps best support the ARV.
Projected returns pro-forma
-3.0% appreciation · 3.0% rent growth · sell at horizon
- IRR
- -16.0%
- Equity multiple
- 0.43×
- Total profit
- $-32,626
- Equity at exit
- $30,551
- IRR
- -7.4%
- Equity multiple
- 0.53×
- Total profit
- $-27,139
- Equity at exit
- $17,716
Cash invested: $57,372 (down + closing). Projections, not guarantees.
Landlord ↔ Tenant lean methodology
- Overall (STATE)
- 87 Strongly Landlord-Friendly
- State Texas
- 87 Strongly Landlord-Friendly · R+5
- County
- — inherits STATE
- City
- — inherits STATE
ZIP-level market 75114
- Home prices YoY
- -26.7%
- Active inventory
- 800
- Price-to-rent
- 8.0×
Monthly cashflow live
- Estimated rent
- $2,126 medium interval (Pro) →
- Mortgage (P&I)
- −$1,075
- Tax from tax record
- −$513 /mo · $6,160/yr
- Insurance
- −$85
- HOA
- −$0
- Vacancy / Maint / Mgmt
- −$446
- Net cashflow
- $6
Break-even live
Sensitivity live
| Price | -10% $122 | -5% $64 | +0% $6 | +5% $-52 | +10% $-110 |
|---|---|---|---|---|---|
| Rent | -10% $-162 | -5% $-78 | +0% $6 | +5% $90 | +10% $174 |
| Rate | -1.0pp $109 | -0.5pp $58 | base $6 | +0.5pp $-47 | +1.0pp $-101 |
UW: 25.0% down · 7.5% · 30yr · 1.5% tax · 5.0% vac · 8.0% maint · 8.0% mgmt
Financing live
Cash to close
- Down payment
- $51,225
- Closing costs
- $6,147
- Reserves months
- —
- Total cash needed
- —
Loan-product check · same deal, 3 products live
Conventional
25% down · 7.5% · 30yr
- Down + closing
- —
- Monthly P&I
- —
- Monthly cashflow
- —
- DSCR
- —
- Eligible?
- —
Personal DTI + credit; lowest rate.
DSCR
20% down · 8.5% · 30yr
- Down + closing
- —
- Monthly P&I
- —
- Monthly cashflow
- —
- DSCR
- —
- Eligible?
- —
No personal income docs; deal must DSCR.
Hard money
10% down · 12.0% · 12mo
- Down + closing
- —
- Monthly P&I
- —
- Monthly cashflow
- —
- DSCR
- —
- Eligible?
- —
Short-term bridge; refi at stabilization.
Rent comps 3 comps
| Address | Beds | Baths | Sqft | Rent | $/sqft | DOM | Units | Dist |
|---|---|---|---|---|---|---|---|---|
| 505 S 5th St Crandall, TX | 3.0 | 2.0 | 1360 | $1,900 | $1.40 | 44d | 1 | 0.25mi |
| 1322 Olivewood Pl Crandall, TX | 3.0 | 2.0 | 1458 | $2,100 | $1.44 | 8d | 1 | 1.30mi |
| 1322 Olivewood Pl Crandall, TX | 3.0 | 2.0 | 1458 | $2,100 | $1.44 | 0d | 1 | 1.30mi |
Listing history 22 events
-
2026-06-21pricedays on market $204,900 Active 105 DOM
-
2026-06-18days on market $209,900 Active 102 DOM
-
2026-06-17days on market $209,900 Active 101 DOM
-
2026-06-16days on market $209,900 Active 100 DOM
-
2026-06-15days on market $209,900 Active 99 DOM
-
2026-06-13days on market $209,900 Active 97 DOM
-
2026-06-09days on market $209,900 Active 93 DOM
-
2026-06-08days on market $209,900 Active 92 DOM
-
2026-06-07days on market $209,900 Active 91 DOM
-
2026-06-04days on market $209,900 Active 88 DOM
-
2026-06-03days on market $209,900 Active 87 DOM
-
2026-06-02days on market $209,900 Active 86 DOM
-
2026-06-01days on market $209,900 Active 85 DOM
-
2026-05-31pricedays on market $209,900 Active 84 DOM
-
2026-04-08price $214,900 248-char remark
Show marketing remark (248 chars)
Spacious 3 bedrooms - 1 bathroom house just blocks away from downtown Crandall. This house offers two living areas with a wood burning fireplace and built in bookcase. Fenced in back yard with a storage shed for your lawn equipment Owner-agent
-
2026-03-08$219,900 Active 248-char remark
Show marketing remark (248 chars)
Spacious 3 bedrooms - 1 bathroom house just blocks away from downtown Crandall. This house offers two living areas with a wood burning fireplace and built in bookcase. Fenced in back yard with a storage shed for your lawn equipment Owner-agent
-
2010-09-23soldstatus
-
2010-09-17soldstatus 224-char remark
Show marketing remark (224 chars)
Complete remodel kitchen, carpert, paint, title, fenece, storage building, roof update's. To large living areas stone fire place. Located on large corner lot. Bring your picky buyer's they will love this one. Priced to sell.
-
2010-08-30historical 224-char remark
Show marketing remark (224 chars)
Complete remodel kitchen, carpert, paint, title, fenece, storage building, roof update's. To large living areas stone fire place. Located on large corner lot. Bring your picky buyer's they will love this one. Priced to sell.
-
2010-06-01historical
-
2010-05-28$89,900
Show marketing remark (224 chars)
Complete remodel kitchen, carpert, paint, title, fenece, storage building, roof update's. To large living areas stone fire place. Located on large corner lot. Bring your picky buyer's they will love this one. Priced to sell.
-
2010-05-28$69,900 224-char remark
Show marketing remark (224 chars)
Complete remodel kitchen, carpert, paint, title, fenece, storage building, roof update's. To large living areas stone fire place. Located on large corner lot. Bring your picky buyer's they will love this one. Priced to sell.
ⓘ Source: listings_history table (triggers on properties + properties_extension) + one-shot
backfill from property_details.listing_events for pre-trigger history.
Tax reassessment forecast TX · Resets to sale price
- Current annual tax
- $6,160 · $513/mo
- Projected year-2 tax
- $6,160 · $513/mo
- Expected delta
- $0/yr ($0/mo · 0.0%)
ⓘ Screening estimate from a state-policy table — verify with the county assessor before closing.
Climate risk First Street
- Flood 1/10 Low FEMA zone X (unshaded) · 0% chance over 30 yrs
- Wildfire 5/10 Major
- Heat 7/10 Severe 7 d/yr ≥110°F today · 25 d/yr by 30 yrs out
- Wind 6/10 Major 27% chance of damaging wind over 30 yrs
- Air quality 2/10 Low 1 unhealthy d/yr today · 1 by 30 yrs out
Nearby sold comps map
Loading sold comps map…
Walkable amenities ~0.75 mi
Loading nearby amenities…
Taxation est. · year 1
- Rental income
- $25,508
- − Mortgage interest
- −$11,478
- − Property taxes
- −$6,160
- − Insurance
- −$1,024
- − Repairs & maintenance
- −$2,041
- − Management
- −$2,041
- − Depreciation
- −$5,961
- Taxable loss
- −$3,196
- Est. tax savings @ 24.0%
- +$767
- After-tax cash flow
- $840/yr
For passive investors: Depreciation is non-cash, so a rental often shows a tax loss while cash-flowing — sheltering income. Rental losses are passive: they offset passive income freely, and up to $25,000/yr can offset ordinary (W-2) income if you actively participate and your MAGI is under $100k (phasing out to $0 by $150k); unused losses carry forward. On sale, claimed depreciation is recaptured at up to 25%, and gains may owe capital-gains tax (a 1031 exchange can defer both). Figures are a year-1 estimate at your 24.0% rate — not tax advice; consult a CPA.
Schools (NCES district)
- District
- Crandall ISD
- NCES district ID
- 4815510
- Math proficiency
- 36% ▼ -13.00%
- Reading proficiency
- 42% ▼ -8.00%
- Median HH income
- $70,076
- Composite
- 35.57/100
- National rank
- #4901
- State rank
- #351 of 826 in TX
Livability — Crandall
- Score
- 68/100
- State rank
- #507
- US rank
- #10022
Category grades
Schools grade is shown separately in the Schools card above.
Census & demographics
- Census place
- Crandall, TX
- County
- Kaufman County · 122,338 people
- City population
- 9,333
- Metro
- Dallas-Fort Worth-Arlington, TX
- Population (ZIP)
- 9,333
- Household income
- $88,013
- Rent vs Own
- Severe rent burden
- 33.0
Population outlook (Kaufman County) Hauer SSP2
- Today (2025)
- 138,716 people
- By 2030
- 150,815 · +8.7%
- By 2040
- 174,877 · +26.1%
- By 2050
- 198,020 · +42.8%
- By 2075
- 251,908 · +81.6%
- By 2100
- 285,325 · +105.7%
Race, ethnicity, and origin ACS 2023
- Neighborhood character
- Diverse neighborhood (Simpson 0.62)
- Race & ethnicity
- White 48% Hispanic / Latino 36% Two or more races 14% Black 14%
- Hispanic origin (detail)
- Mexican 34%
- Common ancestry
- Slovak 1%
- Foreign-born
- 18% · Canada, China
- Languages at home
- 71% English-only · Spanish 27% Other Indo-European 1%
Political lean MEDSL · Kaufman
- 2024 margin
- Strong R (+27.9) · D 35.6% · R 63.5%
- 2008→2024 swing
- +7.9pp toward D · 2008: -35.8pp · 2024: -27.9pp
- All cycles
- 2024: R+27.9 2020: R+33.9 2016: R+47.0 2012: R+44.4 2008: R+35.8
Not yet ingested
- Civics
- —
Market trends
- HPI YoY
- ▼ -71.61%
- Current HPI
- 196.4773
- Rent YoY
- —
- Metro
- Dallas-Fort Worth-Arlington, TX
- State GDP YoY
- ▲ 3.95%
- F500 in state
- 110
Industry mix (Fortune 500 HQ in TX)
| Industry | F500 HQs | Revenue |
|---|---|---|
| Energy | 16 | $1,198B |
|
||
| Technology | 5 | $198B |
|
||
| Engineering / Construction | 4 | $72B |
|
||
| Energy Services | 3 | $60B |
|
||
| Utilities | 3 | $41B |
|
||
| Healthcare | 2 | $330B |
|
||
Price history
+139.0% since first listed8 events — show timeline
- 2026-04-08 Price Changed $214,900 NTREIS
- 2026-03-08 Listed $219,900 NTREIS
- 2010-09-23 Sold (Public Records) — Public Records
- 2010-09-17 Sold (MLS) — NTREIS
- 2010-08-30 Listing Removed — NTREIS
- 2010-06-01 Listing Removed — NTREIS
- 2010-05-28 Listed $69,900 NTREIS
- 2010-05-28 Listed $89,900 NTREIS
Property tax history
+6.1%/yrLatest (2025): $6,160 · -11.4% YoY. Source: county tax records.
Cash-flow waterfall
monthlySold comps — $/sqft
last 12 mo · ≤1 miLoading sold comps…