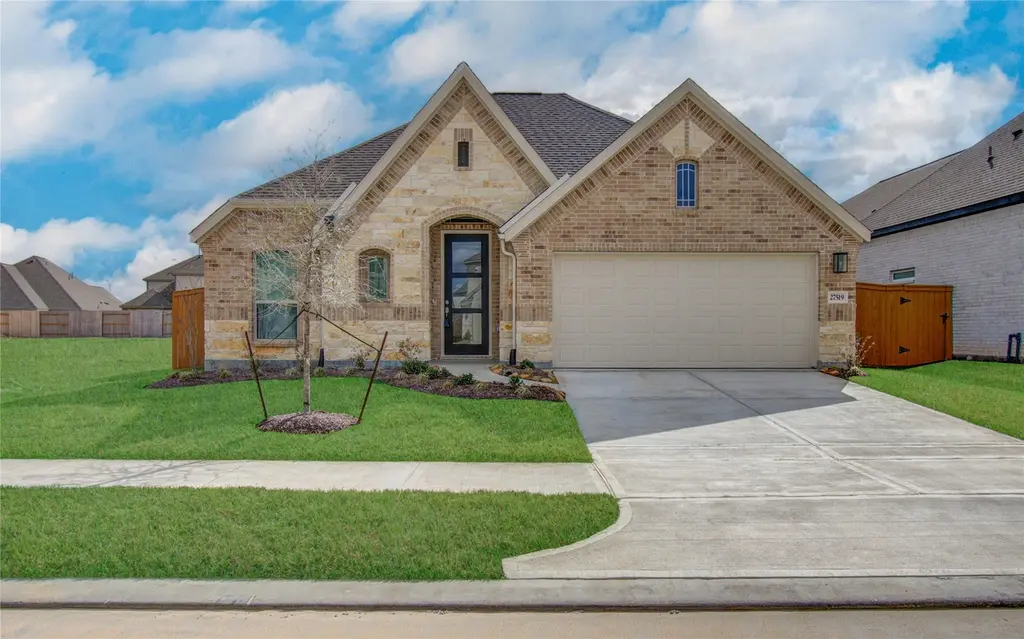
27519 Paddle Grove Dr · Katy, TX
Flood risk 4/10 · Minor
- FEMA flood zone
- X (unshaded)
- Chance of flooding over 30 yrs
- 0.21%
- Est. flood insurance / yr
- $507 – $1,088
Fire risk 4/10 · Minor
- Est. fire insurance / yr
- $1,222 – $2,270
Heat risk 9/10 · Severe
- Hot days now (above 111°F)
- 7 days/yr
- Hot days in 30 yrs
- 22 days/yr
Wind risk 9/10 · Severe
- Chance of severe wind over 30 yrs
- 99.0%
Air-quality risk 2/10 · Minimal
- Unhealthy air days now
- 1 days/yr
- Unhealthy air days in 30 yrs
- 1 days/yr
Risk factors via First Street. Map © Google.
Why this score? — see what drove the D grade
The composite is a weighted blend of 9 inputs, each scored 0–100. Each bar is that input's sub-score; the figure is the points it added to the 100-point composite (weight × sub-score).
- Cash flow +11.2/30.0
- ARV discount +8.9/15.0
- Schools +5.7/10.0
- Livability +3.8/5.0
- DSCR +3.3/10.0
- 1% rule +2.8/10.0
- Condition / age +2.5/5.0
- Rent growth +2.3/5.0
- Appreciation +0.0/10.0
$330,000
🖨 Deal sheet (PDF) 📄 Offer letter ✓ Due diligence
Listing remarks
Discover this stunning one-story home featuring 3 bedrooms, 2 baths, and a dedicated study, showcasing the popular Laurel floor plan in the highly sought-after Sunterra community of Katy. The home offers a formal dining area and a bright, open-concept layout ideal for everyday living and entertaining. The contemporary kitchen is appointed with granite countertops, stainless steel appliances, and ample workspace. Elegant laminate flooring flows throughout the home, complemented by modern wood-style blinds. The cozy study offers flexible use for a home office or hobby room. Additional features include a functional sprinkler system and a covered patio for outdoor enjoyment. Sunterra provides a
Key facts
- Formal dining area
- Granite countertops
- One-story home
Tags
Property features AI
Finance
- HOA & community: Part of Grandmanors association; Annual association fee of $1,160; Association amenities include clubhouse, playground; fee covers clubhouse, common areas, recreation facilities; Community pool
Exterior
- Parking: Attached 2-car garage; Garage door opener
- Security: Prewired for security; Smoke detectors
- Utilities: Public water; Public sewer
- Home design: Residential property; Faces south; Slab foundation; Built in 2025; Composition roof; Total living area about 2,047
- Construction: Brick and stone construction; Composition roof; Slab foundation; Built in 2025
- Exterior features: Covered patio; Patio; Deck; Fence (back yard); Sprinkler/irrigation; Subdivision setting; Concrete road access
Interior
- Kitchen: Dishwasher; Gas cooktop; Garbage disposal; Gas oven; Microwave; ENERGY STAR qualified appliances; Refrigerator; Granite counters; Pantry; Breakfast nook (approx. 15 x 9); Breakfast bar
- Bedrooms: Primary bedroom (First floor, approx. 18 x 14); Bedroom (First floor, approx. 12 x 10); Bedroom (First floor, approx. 12 x 10); Bedrooms possible: 3
- Flooring: Laminate; Tile
- Bathrooms: 2 full bathrooms; Double vanity; Soaking tub; Separate shower; Tub/shower
- Heating & cooling: Central heating (Gas); Central air (Electric); Programmable thermostat
- Interior features: Breakfast bar; Double vanity; Entrance foyer; Granite counters; High ceilings; Kitchen/family room combo; Pantry; Soaking tub; Separate shower; Tub/shower; Window treatments; Ceiling fan(s); Living/dining room; Programmable thermostat; Insulated doors; Low emissivity windows; Window coverings
- Laundry & utility: Washer hookup; Electric dryer hookup; Gas dryer hookup
Neighborhood map
What this means for you Summary
Snapshot
- This is a 3-bed/2.5-bath single-family listed at $330k.
Deal economics
- At list price, monthly cash flow is $-126 ($-2k/yr) — negative.
- To cash-flow at today's rent, offer at most $308k (6.7% below list).
- To meet the 1% rule (rent ≥ 1% of price), the offer needs to be $257k (22.3% below list).
- Recommended offer: $257k (22.3% below list) — sets the bar for 1% rule.
- Cap rate 5.8% vs local median 3.0% in Katy — top-decile yield for the area; either an underpriced asset or a hidden risk that comps aren't pricing in. Stress-test before assuming the spread holds.
Location & tenants
- Location reads 76/100 on livability (#111 in TX, #3,613 nationally) — a middle-class / working-renter tenant base. Strengths: employment A+, cost of living A+, housing A+; Watch: crime C-, amenities D, commute F.
- Katy ISD (suburban): math 61% / reading 63% proficiency, ranked #29 of 826 in TX (top 4%) — acceptable for families but not a draw, mixed tenant base, ~2y average lease.
- Zoned schools: Robert King El (math 41% / reading 44%, grade F, #1,313 of 4,322 statewide, top 31%, 981 students, 68% FRL); Katy J H (math 52% / reading 51%, grade C, #318 of 1,662 statewide, top 20%, 1,094 students, 53% FRL); Katy H S (math 62% / reading 74%, grade B, #150 of 1,632 statewide, top 10%, 3,330 students, 38% FRL) — zoned schools average 53% FRL vs 27% district-wide (25 pts higher); higher-poverty schools than district average — tighter screening recommended.
- Market conditions: Rents soft (-0.8%/yr); 2729 active listings in the ZIP; 29 comparable units currently listed for rent nearby; rentals at typical pace (median 27d on market — plan ~3-4 weeks tenant-placement turnaround); high-income renter base; 29,883 units permitted in Harris County in 2024 (8,621 in 5+ unit buildings).
Forward outlook
- Local home prices are declining (-3.0%/yr); year-one equity from $2k of loan paydown is wiped out by about $10k of value loss. Plan a longer hold.
- Harris County population projected at +47% by 2050 — long-run rental-demand tailwind backs the buy-and-hold thesis.
Negotiation context
- It's been on market 32 days — a 3% lower offer ($320k) is reasonable based on typical stale-listing flexibility.
- 2 sale attempts with the ask held roughly flat each time — persistent listings suggest the price (not the market) is what's stuck; bring a comps-based counter.
Risks & watch-outs
- Climate carrying-cost: severe wind risk, 99% chance of damaging wind over 30y; extreme-heat days projected 7→22/yr by 2055 (HVAC capex compounding) — expect insurance premiums to compound above CPI over the hold.
Questions for the listing agent
- What do current leases actually rent for vs. the listed asking? Can we see a recent rent roll and the last 12 months of T-12 income?
- It's been on market 32 days. Have you received any prior offers? Is the seller open to a 22% concession, seller financing, or rate buy-down credit?
- What does the HOA fee cover, when was the last increase, and are there any pending special assessments or reserve-fund shortfalls?
- Is there a deadline driving the sale (1031 exchange, divorce, estate, relocation)? That informs how much negotiation room exists.
- Schools are B-rated — typically a magnet for longer-tenancy family renters. What's the average tenant stay here, and is there a school-zone premium baked into asking?
- The area grade is low — what's the realistic commute time and amenity access for the typical tenant pool here? Any planned neighborhood developments (good or bad) we should know about?
- What's the average days-on-market for RENTAL listings here right now (not sales)? A rising rental-DOM trend means longer vacancies and softer asking-rent achievability than the comps imply.
- What's the recent tenant-quality profile in this submarket — average credit score on applications, eviction rate, late-payment / NSF rate, and stable-employment percentage? A property-management company in the area should have these aggregated.
- How much new for-sale + rental construction is in the pipeline within 1–3 miles? Heavy new supply typically softens prices + rents 12–24 months out; constrained supply supports both.
Investment metrics
- 1% rule
- 0.78% ✗
- Cap rate
- 5.83%
- Cash-on-cash
- -1.64%
- DSCR
- 0.93
- GRM
- 10.7
CMA / ARV
- ARV (median comp)
- $340,879
- List price
- $330,000
- Delta
- -1.72%
- Verdict
- FAIR
- Comps
- 20 within 1.0 mi
Show comp detail 12 sales within ~0.75 mi
| Address | Dist | Beds/Ba | Sqft | Sold | Price | $/sf | Match |
|---|---|---|---|---|---|---|---|
| 27519 Crystalline Sage Ln | 0.20mi | 4/2.0 (+1) | 2,035 (+7%) | 0mo | $371,990 | $183 | 72 |
| 4632 Cleo Day Dr | 0.49mi | 3/2.0 | 1,859 (-2%) | 0mo | $299,990 | $161 | 71 |
| 3036 Huntersville Dr | 0.59mi | 3/2.0 | 1,876 (-1%) | 1mo | $334,990 | $179 | 68 |
| 5814 Capri Forest Dr | 0.28mi | 3/2.5 | 2,165 (+14%) | 1mo | $314,900 | $145 | 63 |
| 27507 Crystalline Sage Ln | 0.20mi | 4/3.0 (+1) | 2,170 (+14%) | 0mo | $364,990 | $168 | 60 |
| 3056 Huntersville Dr | 0.56mi | 4/2.5 (+1) | 2,015 (+6%) | 0mo | $346,990 | $172 | 59 |
| 4680 Peony Green Dr | 0.44mi | 4/2.0 (+1) | 2,056 (+8%) | 0mo | $343,990 | $167 | 58 |
| 27618 Spearmint Ridge Dr | 0.64mi | 3/2.0 | 1,792 (-6%) | 0mo | $345,990 | $193 | 58 |
| 3017 Paradise Capri Dr | 0.74mi | 4/2.0 (+1) | 1,883 (-1%) | 1mo | $300,000 | $159 | 56 |
| 4784 Luna Landing Dr | 0.31mi | 4/3.0 (+1) | 2,168 (+14%) | 0mo | $335,990 | $155 | 55 |
| 5806 Havana Mist Dr | 0.47mi | 4/2.5 (+1) | 2,134 (+12%) | 0mo | $305,000 | $143 | 52 |
| 26843 Vanilla Pearls Ln | 0.70mi | 4/2.0 (+1) | 1,656 (-13%) | 0mo | $254,240 | $154 | 39 |
Match score weights: distance 35% · size 25% · config 20% · recency 20%. Top-matched comps best support the ARV.
Projected returns pro-forma
-3.0% appreciation · 0.0% rent growth · sell at horizon
- IRR
- -22.2%
- Equity multiple
- 0.25×
- Total profit
- $-69,059
- Equity at exit
- $49,204
- IRR
- -25.4%
- Equity multiple
- -0.08×
- Total profit
- $-99,688
- Equity at exit
- $28,532
Cash invested: $92,400 (down + closing). Projections, not guarantees.
Landlord ↔ Tenant lean methodology
- Overall (STATE)
- 87 Strongly Landlord-Friendly
- State Texas
- 87 Strongly Landlord-Friendly · R+5
- County
- — inherits STATE
- City
- — inherits STATE
ZIP-level market 77493
- Rents YoY
- -0.8%
- Active inventory
- 2729
- Price-to-rent
- 10.7×
Monthly cashflow live
- Estimated rent
- $2,565 high interval (Pro) →
- Mortgage (P&I)
- −$1,731
- Tax from tax record
- −$188 /mo · $2,252/yr
- Insurance
- −$138
- HOA
- −$97
- Vacancy / Maint / Mgmt
- −$539
- Net cashflow
- $-126
Break-even live
Sensitivity live
| Price | -10% $61 | -5% $-33 | +0% $-126 | +5% $-219 | +10% $-313 |
|---|---|---|---|---|---|
| Rent | -10% $-329 | -5% $-227 | +0% $-126 | +5% $-25 | +10% $77 |
| Rate | -1.0pp $40 | -0.5pp $-42 | base $-126 | +0.5pp $-212 | +1.0pp $-299 |
UW: 25.0% down · 7.5% · 30yr · 1.5% tax · 5.0% vac · 8.0% maint · 8.0% mgmt
Financing live
Cash to close
- Down payment
- $82,500
- Closing costs
- $9,900
- Reserves months
- —
- Total cash needed
- —
Loan-product check · same deal, 3 products live
Conventional
25% down · 7.5% · 30yr
- Down + closing
- —
- Monthly P&I
- —
- Monthly cashflow
- —
- DSCR
- —
- Eligible?
- —
Personal DTI + credit; lowest rate.
DSCR
20% down · 8.5% · 30yr
- Down + closing
- —
- Monthly P&I
- —
- Monthly cashflow
- —
- DSCR
- —
- Eligible?
- —
No personal income docs; deal must DSCR.
Hard money
10% down · 12.0% · 12mo
- Down + closing
- —
- Monthly P&I
- —
- Monthly cashflow
- —
- DSCR
- —
- Eligible?
- —
Short-term bridge; refi at stabilization.
Rent comps 29 comps
| Address | Beds | Baths | Sqft | Rent | $/sqft | DOM | Units | Dist |
|---|---|---|---|---|---|---|---|---|
| 5819 Bright Keel Dr Katy, TX | 4.0 | 3.0 | 2598 | $2,400 | $0.92 | 46d | 1 | 0.09mi |
| 27327 Blue Pool Dr Katy, TX | 4.0 | 3.0 | 2100 | $2,600 | $1.24 | 46d | 1 | 0.14mi |
| 5631 Pearl Vista Dr Katy, TX | 4.0 | 3.0 | 2039 | $3,000 | $1.47 | 23d | 1 | 0.24mi |
| 27507 Hudson Sands Ln Katy, TX | 4.0 | 3.0 | 2294 | $3,000 | $1.31 | 19d | 1 | 0.24mi |
| 3076 Dylan Skyland Dr Katy, TX | 4.0 | 2.5 | 2240 | $3,395 | $1.52 | 26d | 1 | 0.41mi |
| 3056 Sea Turtle Dr Katy, TX | 4.0 | 2.0 | 1500 | $2,200 | $1.47 | 46d | 1 | 0.43mi |
| 6303 Marigold Blaze Dr Katy, TX | 3.0 | 2.0 | 1474 | $2,250 | $1.53 | 46d | 1 | 0.50mi |
| 27064 Beach Ball Dr Katy, TX | 3.0–4.0 | 2.5–3.5 | 1705 | $2,406 | $1.41 | 0d | 25 | 0.55mi |
| 6427 Seafoam Lake Dr Katy, TX | 4.0 | 4.0 | 2479 | $3,000 | $1.21 | 0d | 1 | 0.60mi |
| 3084 Fantasy Terrace Dr Katy, TX | 4.0 | 2.0 | 2085 | $2,325 | $1.12 | 15d | 1 | 0.63mi |
| 3072 Fantasy Terrace Dr Katy, TX | 4.0 | 2.0 | 2279 | $2,550 | $1.12 | 24d | 1 | 0.65mi |
| 3081 Fantasy Terrace Dr Katy, TX | 4.0 | 2.0 | 1670 | $2,275 | $1.36 | 26d | 1 | 0.66mi |
| 3057 Majestic Sunrise Dr Katy, TX | 4.0 | 2.0 | 1644 | $2,252 | $1.37 | 26d | 1 | 0.67mi |
| 3053 Fantasy Terrace Dr Katy, TX | 4.0 | 2.0 | 2085 | $2,440 | $1.17 | 17d | 1 | 0.68mi |
| 3064 Dawn Sound Dr Katy, TX | 3.0 | 2.0 | 1464 | $1,950 | $1.33 | 46d | 1 | 0.68mi |
| 3041 Colusa Ridge Dr Katy, TX | 4.0 | 2.5 | 2263 | $2,500 | $1.10 | 15d | 1 | 0.68mi |
| 3048 Majestic Sunrise Dr Katy, TX | 4.0 | 2.0 | 1670 | $2,275 | $1.36 | 26d | 1 | 0.70mi |
| 3020 Wild Dunes Dr Katy, TX | 4.0 | 2.0 | 1776 | $2,355 | $1.33 | 15d | 1 | 0.71mi |
| 3071 Wild Dunes Dr Katy, TX | 3.0 | 2.0 | 1538 | $2,164 | $1.41 | 26d | 1 | 0.71mi |
| 3083 Wild Dunes Dr Katy, TX | 3.0 | 2.0 | 1538 | $2,185 | $1.42 | 15d | 1 | 0.72mi |
| 3112 Wild Dunes Dr Katy, TX | 4.0 | 2.0 | 1776 | $2,330 | $1.31 | 26d | 1 | 0.75mi |
| 3124 Wild Dunes Dr Katy, TX | 4.0 | 2.0 | 1776 | $2,330 | $1.31 | 26d | 1 | 0.75mi |
| 3037 Wild Dunes Dr Katy, TX | 3.0 | 2.0 | 1538 | $2,164 | $1.41 | 26d | 1 | 0.75mi |
| 3004 Majestic Sunrise Dr Katy, TX | 3.0 | 2.0 | 1474 | $1,942 | $1.32 | 46d | 1 | 0.75mi |
| 3136 Wild Dunes Dr Katy, TX | 4.0 | 2.0 | 1776 | $2,355 | $1.33 | 15d | 1 | 0.76mi |
| 1495 Twilight Green Dr Katy, TX | 3.0 | 2.5 | 2000 | $2,400 | $1.20 | 46d | 1 | 0.94mi |
| 26811 Prairie Smoke Ln Katy, TX | 4.0 | 2.0 | 1656 | $2,250 | $1.36 | 46d | 1 | 1.25mi |
| 27035 Beacon Glen Dr Katy, TX | 2.0–4.0 | 2.0–3.0 | 1890 | $3,024 | $1.60 | 0d | 17 | 1.33mi |
| 26642 Prairie Smoke Ln Katy, TX | 3.0 | 2.0 | 1949 | $2,300 | $1.18 | 46d | 1 | 1.40mi |
HOA detail
- Monthly dues
- $97 · $1,164/yr
Listing history 17 events
-
2026-06-21days on market $330,000 Active 32 DOM
-
2026-06-18days on market $330,000 Active 29 DOM
-
2026-06-17days on market $330,000 Active 28 DOM
-
2026-06-16days on market $330,000 Active 27 DOM
-
2026-06-15days on market $330,000 Active 26 DOM
-
2026-06-13days on market $330,000 Active 24 DOM
-
2026-06-09days on market $330,000 Active 20 DOM
-
2026-06-08days on market $330,000 Active 19 DOM
-
2026-06-07days on market $330,000 Active 18 DOM
-
2026-06-04days on market $330,000 Active 15 DOM
-
2026-06-03days on market $330,000 Active 14 DOM
-
2026-06-02days on market $330,000 Active 13 DOM
-
2026-06-01days on market $330,000 Active 12 DOM
-
2026-05-31days on market $330,000 Active 11 DOM
-
2026-03-05price $335,000 881-char remark
-
2026-02-25price $345,000 881-char remark
-
2026-02-04$355,000 Active 881-char remark
ⓘ Source: listings_history table (triggers on properties + properties_extension) + one-shot
backfill from property_details.listing_events for pre-trigger history.
Tax reassessment forecast TX · Resets to sale price
- Current annual tax
- $2,252 · $188/mo
- Projected year-2 tax
- $6,039 · $503/mo
- Expected delta
- +$3,787/yr (+$316/mo · 168.2%)
ⓘ Screening estimate from a state-policy table — verify with the county assessor before closing.
Climate risk First Street
- Flood 4/10 Moderate FEMA zone X (unshaded) · 21% chance over 30 yrs
- Wildfire 4/10 Moderate
- Heat 9/10 Extreme 7 d/yr ≥111°F today · 22 d/yr by 30 yrs out
- Wind 9/10 Extreme 99% chance of damaging wind over 30 yrs
- Air quality 2/10 Low 1 unhealthy d/yr today · 1 by 30 yrs out
Nearby sold comps map
Loading sold comps map…
Walkable amenities ~0.75 mi
Loading nearby amenities…
Taxation est. · year 1
- Rental income
- $30,785
- − Mortgage interest
- −$18,485
- − Property taxes
- −$2,252
- − Insurance
- −$1,650
- − Repairs & maintenance
- −$2,463
- − Management
- −$2,463
- − HOA
- −$1,164
- − Depreciation
- −$9,600
- Taxable loss
- −$7,292
- Est. tax savings @ 24.0%
- +$1,750
- After-tax cash flow
- $238/yr
For passive investors: Depreciation is non-cash, so a rental often shows a tax loss while cash-flowing — sheltering income. Rental losses are passive: they offset passive income freely, and up to $25,000/yr can offset ordinary (W-2) income if you actively participate and your MAGI is under $100k (phasing out to $0 by $150k); unused losses carry forward. On sale, claimed depreciation is recaptured at up to 25%, and gains may owe capital-gains tax (a 1031 exchange can defer both). Figures are a year-1 estimate at your 24.0% rate — not tax advice; consult a CPA.
Schools (NCES district)
- District
- Katy ISD
- NCES district ID
- 4825170
- Math proficiency
- 61% ▼ -7.00%
- Reading proficiency
- 63% ▼ -3.00%
- Median HH income
- $90,312
- Composite
- 56.59/100
- National rank
- #1146
- State rank
- #29 of 826 in TX
Livability — Katy
- Score
- 76/100
- State rank
- #111
- US rank
- #3613
Category grades
Schools grade is shown separately in the Schools card above.
Census & demographics
- County
- Harris County · 4,702,590 people
- City population
- 413,575
- Metro
- Houston-The Woodlands-Sugar Land, TX
- Population (ZIP)
- 71,484
- Household income
- $118,464
- Rent vs Own
- Severe rent burden
- 913.0
Population outlook (Harris County) Hauer SSP2
- Today (2025)
- 5,571,493 people
- By 2030
- 6,089,821 · +9.3%
- By 2040
- 7,142,806 · +28.2%
- By 2050
- 8,185,864 · +46.9%
- By 2075
- 10,574,329 · +89.8%
- By 2100
- 12,109,958 · +117.4%
Race, ethnicity, and origin ACS 2023
- Neighborhood character
- Highly diverse neighborhood (Simpson 0.73)
- Race & ethnicity
- White 36% Hispanic / Latino 33% Two or more races 16% Black 15% Asian 12%
- Hispanic origin (detail)
- Mexican 20%
- Common ancestry
- Lithuanian 2% Slovak 1% Italian 1%
- Foreign-born
- 21% · Canada, Vietnam, Jamaica
- Languages at home
- 64% English-only · Spanish 22% Vietnamese 5% French/Haitian/Cajun 4%
Political lean MEDSL · Harris
- 2024 margin
- Lean D (+5.5) · D 52.0% · R 46.4% · Other 1.6%
- 2008→2024 swing
- +3.9pp toward D · 2008: 1.6pp · 2024: 5.5pp
- All cycles
- 2024: D+5.5 2020: D+13.3 2016: D+12.4 2012: D+0.1 2008: D+1.6
Not yet ingested
- Civics
- —
Market trends
- HPI YoY
- ▼ -140.65%
- Current HPI
- 233.1683
- Rent YoY
- ▼ -0.80%
- Metro
- Houston-The Woodlands-Sugar Land, TX
- State GDP YoY
- ▲ 3.95%
- F500 in state
- 110
Industry mix (Fortune 500 HQ in TX)
| Industry | F500 HQs | Revenue |
|---|---|---|
| Energy | 16 | $1,198B |
|
||
| Technology | 5 | $198B |
|
||
| Engineering / Construction | 4 | $72B |
|
||
| Energy Services | 3 | $60B |
|
||
| Utilities | 3 | $41B |
|
||
| Healthcare | 2 | $330B |
|
||
Price history
-7.0% since first listed5 events — show timeline
- 2026-05-20 Listed $330,000 HARMLS
- 2026-05-20 Listing Removed — HARMLS
- 2026-03-05 Price Changed $335,000 HARMLS
- 2026-02-25 Price Changed $345,000 HARMLS
- 2026-02-04 Listed $355,000 HARMLS
Property tax history
+1.6%/yrLatest (2025): $2,252 · +0.7% YoY. Source: county tax records.
Cash-flow waterfall
monthlySold comps — $/sqft
last 12 mo · ≤1 miLoading sold comps…