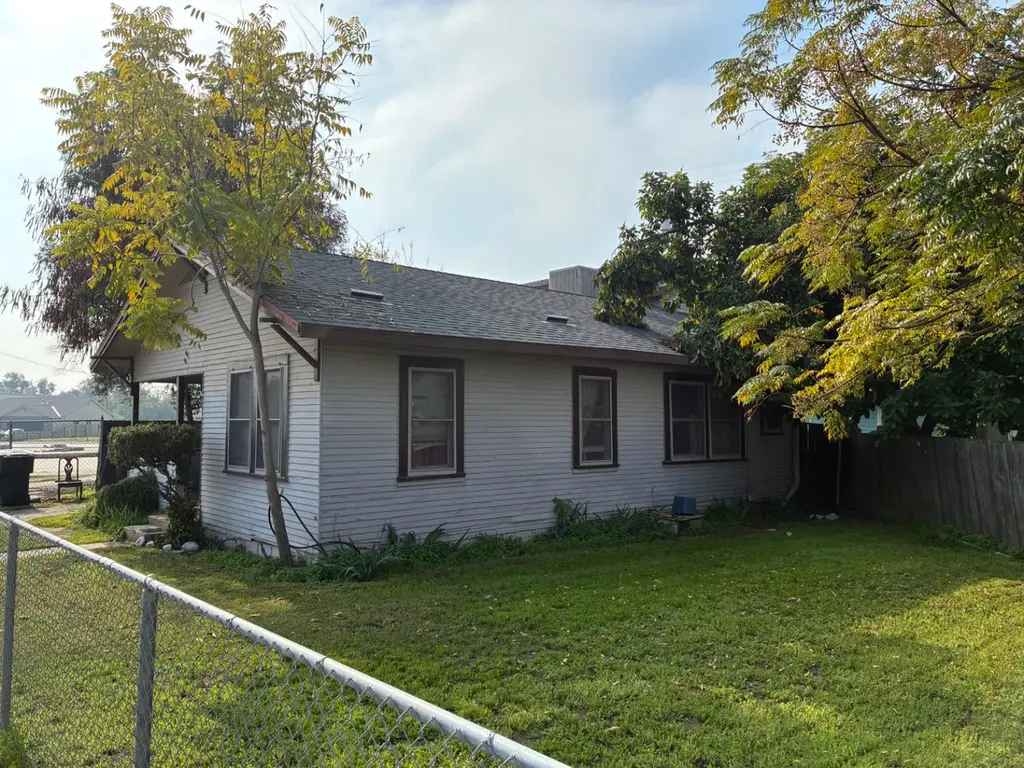
1215 N Court St · Visalia, CA
Flood risk 1/10 · Minimal
- FEMA flood zone
- X (shaded)
- Chance of flooding over 30 yrs
- 0.0%
- Est. flood insurance / yr
- $507 – $1,088
Fire risk 7/10 · Major
- Est. fire insurance / yr
- $659 – $1,223
Heat risk 8/10 · Major
- Hot days now (above 105°F)
- 7 days/yr
- Hot days in 30 yrs
- 17 days/yr
Wind risk 1/10 · Minimal
- Chance of severe wind over 30 yrs
- —
Air-quality risk 10/10 · Severe
- Unhealthy air days now
- 40 days/yr
- Unhealthy air days in 30 yrs
- 43 days/yr
Risk factors via First Street. Map © Google.
Why this score? — see what drove the D grade
The composite is a weighted blend of 9 inputs, each scored 0–100. Each bar is that input's sub-score; the figure is the points it added to the 100-point composite (weight × sub-score).
- ARV discount +13.1/15.0
- Cash flow +11.0/30.0
- Livability +3.6/5.0
- Rent growth +3.3/5.0
- DSCR +3.2/10.0
- Schools +3.0/10.0
- Condition / age +2.5/5.0
- 1% rule +2.2/10.0
- Appreciation +0.0/10.0
$250,000
🖨 Deal sheet 📄 Offer letter ✓ Due diligence
Listing remarks MLS
Positioned in a high-demand rental pocket of Visalia, this 2-bedroom, 1.5-bath bungalow with an upstairs loft and attached 1-car garage is a turnkey investment opportunity tailored for savvy buyers seeking steady cash flow and long-term appreciation.The property is professionally managed and tenant-occupied with a dependable long-term resident in place, delivering immediate income from day one. Its functional floor plan, low-maintenance design, and walkable access to shopping, dining, and everyday amenities enhance tenant retention and reduce vacancy risk.Ideal for investors looking to expand their portfolio with a performing asset in a strong rental market, this property offers the advantages of consistent returns, minimal oversight, and future upside potential in a growing Central Valley community.
Key facts
- Walkable access
- Strong rental market
- 5,270 sq ft lot
Tags
Neighborhood map
What this means for you Summary
Snapshot
- This is a 2-bed/1.0-bath single-family listed at $250k.
Deal economics
- At list price, monthly cash flow is $-106 ($-1k/yr) — negative.
- To cash-flow at today's rent, offer at most $231k (7.5% below list).
- To meet the 1% rule (rent ≥ 1% of price), the offer needs to be $181k (27.8% below list).
- Recommended offer: $181k (27.8% below list) — sets the bar for 1% rule.
- Cap rate 5.8% vs local median 3.3% in Visalia — top-decile yield for the area; either an underpriced asset or a hidden risk that comps aren't pricing in. Stress-test before assuming the spread holds.
Location & tenants
- Location reads 72/100 on livability (#196 in CA) — a middle-class / working-renter tenant base. Strengths: commute A+, housing A+, employment B; Watch: amenities D, crime D-, cost of living F.
- Visalia Unified (urban): math 30% / reading 40% proficiency, ranked #273 of 517 in CA (top 53%) — families likely to look elsewhere, expect single-tenant / working-renter base with shorter leases.
- Market conditions: Rents rising (+3.1%/yr); 552 active listings in the ZIP; 21 comparable units currently listed for rent nearby; rentals at typical pace (median 21d on market — plan ~3-4 weeks tenant-placement turnaround); solid renter incomes; 1,447 units permitted in Tulare County in 2024 (307 in 5+ unit buildings).
Forward outlook
- Local home prices are declining (-3.0%/yr); year-one equity from $2k of loan paydown is wiped out by about $8k of value loss. Plan a longer hold.
- Tulare County population projected at +10% by 2050 — modest demand growth; plan on rents tracking national, not racing it.
Negotiation context
- It's been on market 111 days — a 9% lower offer ($228k) is reasonable based on typical stale-listing flexibility.
- Current owner paid $115k; list at $250k implies a 117% gain — meaningful room to come down on a strong offer.
Risks & watch-outs
- Watch-outs: built in 1926 — expect roof / HVAC / electrical / plumbing capex.
- Climate carrying-cost: major wildfire risk; extreme-heat days projected 7→17/yr by 2055 (HVAC capex compounding) — expect insurance premiums to compound above CPI over the hold.
Questions for the listing agent
- What do current leases actually rent for vs. the listed asking? Can we see a recent rent roll and the last 12 months of T-12 income?
- It's been on market 111 days. Have you received any prior offers? Is the seller open to a 28% concession, seller financing, or rate buy-down credit?
- Built in 1926 — when were the roof, HVAC, electrical panel, plumbing, and water heater last replaced?
- Why hasn't it sold? Are there any deal-killer items the seller is aware of (foundation, flood, title, zoning, code violations)?
- Is there a deadline driving the sale (1031 exchange, divorce, estate, relocation)? That informs how much negotiation room exists.
- Crime grade is D in this area — have there been break-ins, vandalism, or insurance claims at this property in the last 3 years? What carrier currently insures it and at what premium?
- The area grade is low — what's the realistic commute time and amenity access for the typical tenant pool here? Any planned neighborhood developments (good or bad) we should know about?
- What's the average days-on-market for RENTAL listings here right now (not sales)? A rising rental-DOM trend means longer vacancies and softer asking-rent achievability than the comps imply.
- What's the recent tenant-quality profile in this submarket — average credit score on applications, eviction rate, late-payment / NSF rate, and stable-employment percentage? A property-management company in the area should have these aggregated.
- How much new for-sale + rental construction is in the pipeline within 1–3 miles? Heavy new supply typically softens prices + rents 12–24 months out; constrained supply supports both.
Investment metrics
- 1% rule
- 0.72% ✗
- Cap rate
- 5.79%
- Cash-on-cash
- -1.81%
- DSCR
- 0.92
- GRM
- 11.5
CMA / ARV
- ARV (median comp)
- $285,549
- List price
- $250,000
- Delta
- -12.45%
- Verdict
- UNDERPRICED
- Comps
- 20 within 1.0 mi
Show comp detail 12 sales within ~0.75 mi
| Address | Dist | Beds/Ba | Sqft | Sold | Price | $/sf | Match |
|---|---|---|---|---|---|---|---|
| 1432 N Locust St | 0.07mi | 3/2.0 (+1) | 1,285 (-8%) | 3mo | $295,000 | $230 | 72 |
| 312 NE 4th Ave | 0.13mi | 3/2.0 (+1) | 1,475 (+5%) | 7mo | $307,000 | $208 | 70 |
| 601 N Church St | 0.43mi | 3/1.0 (+1) | 1,462 (+4%) | 5mo | $269,000 | $184 | 64 |
| 1420 N Court St | 0.05mi | 3/2.0 (+1) | 1,200 (-14%) | 2mo | $275,225 | $229 | 63 |
| 220 NW 1st Ave | 0.31mi | 3/3.0 (+1) | 1,515 (+8%) | 2mo | $360,000 | $238 | 57 |
| 523 N Locust St | 0.48mi | 2/1.0 | 1,200 (-14%) | 0mo | $330,000 | $275 | 53 |
| 1825 N Liberty Ct | 0.49mi | 3/2.0 (+1) | 1,240 (-11%) | 0mo | $358,000 | $289 | 49 |
| 223 W Buena Vista Ave | 0.36mi | 3/2.0 (+1) | 1,193 (-15%) | 4mo | $270,000 | $226 | 47 |
| 1101 N Conyer St | 0.49mi | 3/2.0 (+1) | 1,219 (-13%) | 2mo | $330,000 | $271 | 45 |
| 807 W Grove Ave | 0.60mi | 3/2.0 (+1) | 1,239 (-12%) | 2mo | $325,000 | $262 | 43 |
| 729 W Perez Ave | 0.57mi | 3/2.0 (+1) | 1,597 (+14%) | 2mo | $370,000 | $232 | 39 |
| 2141 N Highland St | 0.67mi | 3/2.0 (+1) | 1,597 (+14%) | 1mo | $365,000 | $229 | 35 |
Match score weights: distance 35% · size 25% · config 20% · recency 20%. Top-matched comps best support the ARV.
Projected returns pro-forma
-3.0% appreciation · 3.12% rent growth · sell at horizon
- IRR
- -19.2%
- Equity multiple
- 0.33×
- Total profit
- $-47,123
- Equity at exit
- $37,276
- IRR
- -11.8%
- Equity multiple
- 0.30×
- Total profit
- $-49,190
- Equity at exit
- $21,615
Cash invested: $70,000 (down + closing). Projections, not guarantees.
Landlord ↔ Tenant lean methodology
- Overall (STATE)
- 18 Strongly Tenant-Friendly
- State California
- 18 Strongly Tenant-Friendly · D+13
- County
- — inherits STATE
- City
- — inherits STATE
ZIP-level market 93291
- Rents YoY
- 3.1%
- Active inventory
- 552
- Price-to-rent
- 11.5×
Monthly cashflow live
- Estimated rent
- $1,805 high interval (Pro) →
- Mortgage (P&I)
- −$1,311
- Tax from tax record
- −$117 /mo · $1,399/yr
- Insurance
- −$104
- HOA
- −$0
- Vacancy / Maint / Mgmt
- −$379
- Net cashflow
- $-106
Break-even live
UW: 25.0% down · 7.5% · 30yr · 1.5% tax · 5.0% vac · 8.0% maint · 8.0% mgmt
Financing live
Cash to close
- Down payment
- $62,500
- Closing costs
- $7,500
- Reserves months
- —
- Total cash needed
- —
Loan-product check · same deal, 3 products live
Conventional
25% down · 7.5% · 30yr
- Down + closing
- —
- Monthly P&I
- —
- Monthly cashflow
- —
- DSCR
- —
- Eligible?
- —
Personal DTI + credit; lowest rate.
DSCR
20% down · 8.5% · 30yr
- Down + closing
- —
- Monthly P&I
- —
- Monthly cashflow
- —
- DSCR
- —
- Eligible?
- —
No personal income docs; deal must DSCR.
Hard money
10% down · 12.0% · 12mo
- Down + closing
- —
- Monthly P&I
- —
- Monthly cashflow
- —
- DSCR
- —
- Eligible?
- —
Short-term bridge; refi at stabilization.
Rent comps 21 comps
| Address | Beds | Baths | Sqft | Rent | $/sqft | DOM | Units | Dist |
|---|---|---|---|---|---|---|---|---|
| 1101 N Stevenson St Visalia, CA | 3.0 | 2.0 | 1350 | $1,750 | $1.30 | 43d | 1 | 0.42mi |
| 1216 N Conyer St Visalia, CA | 2.0 | 1.0 | 996 | $1,500 | $1.51 | 43d | 1 | 0.43mi |
| 528 N Encina St Unit 530A Visalia, CA | 3.0 | 1.0 | 1125 | $1,795 | $1.60 | 21d | 1 | 0.50mi |
| 803 E Prospect Ave Visalia, CA | 2.0 | 1.0 | 960 | $1,495 | $1.56 | 21d | 1 | 0.53mi |
| 502 W School Ave Visalia, CA | 1.0 | 1.0 | 900 | $1,350 | $1.50 | 13d | 1 | 0.66mi |
| 907 E Oakridge Ave Visalia, CA | 2.0 | 2.0 | 1009 | $1,695 | $1.68 | 21d | 1 | 0.90mi |
| 312 1/2 N Park St Visalia, CA | 2.0 | 1.0 | 944 | $1,550 | $1.64 | 13d | 1 | 0.99mi |
| 407 N Park St Visalia, CA | 2.0 | 2.0 | 995 | $1,550 | $1.56 | 21d | 1 | 1.01mi |
| 401 N Park St Unit 407 Visalia, CA | 2.0 | 2.0 | 995 | $1,550 | $1.56 | 21d | 1 | 1.02mi |
| 1737 W Buena Vista Ave Visalia, CA | 3.0 | 2.0 | 1101 | $1,950 | $1.77 | 43d | 1 | 1.02mi |
| 309 W Noble Ave Visalia, CA | 3.0 | 1.0 | 1609 | $1,900 | $1.18 | 13d | 1 | 1.10mi |
| 1630 E Knight Ct Visalia, CA | 3.0 | 2.0 | 1419 | $1,895 | $1.34 | 43d | 1 | 1.14mi |
| 432 S Bridge St Visalia, CA | 3.0 | 2.0 | 1200 | $1,895 | $1.58 | 13d | 1 | 1.15mi |
| 315 W Kaweah Ave Visalia, CA | 3.0 | 1.0 | 1246 | $1,750 | $1.40 | 13d | 1 | 1.15mi |
| 711 E Noble Ave Unit 711C5 Visalia, CA | 2.0 | 1.0 | 900 | $1,350 | $1.50 | 21d | 1 | 1.18mi |
| 1312 W Prescott Ave Visalia, CA | 3.0 | 3.0 | 1672 | $2,285 | $1.37 | 21d | 1 | 1.19mi |
| 2008 E Douglas Ave Visalia, CA | 3.0 | 2.0 | 1171 | $1,900 | $1.62 | 43d | 1 | 1.26mi |
| 2210 W Buena Vista Ave Visalia, CA | 3.0 | 2.0 | 1201 | $1,900 | $1.58 | 21d | 1 | 1.27mi |
| 802 S Locust St Visalia, CA | 3.0 | 2.5 | 1119 | $2,100 | $1.88 | 13d | 1 | 1.35mi |
| 1336 W Porter Ave Visalia, CA | 3.0 | 2.0 | 1855 | $2,500 | $1.35 | 21d | 1 | 1.41mi |
| 203 E Taylor Ave Visalia, CA | 3.0 | 2.0 | 1787 | $2,300 | $1.29 | 13d | 1 | 1.44mi |
Listing history 18 events
-
2026-06-18days on market $250,000 Active 111 DOM
-
2026-06-17days on market $250,000 Active 110 DOM
-
2026-06-16days on market $250,000 Active 109 DOM
-
2026-06-15days on market $250,000 Active 108 DOM
-
2026-06-14days on market $250,000 Active 106 DOM
-
2026-06-13days on market $250,000 Active 105 DOM
-
2026-06-10days on market $250,000 Active 103 DOM
-
2026-06-09days on market $250,000 Active 102 DOM
-
2026-06-08days on market $250,000 Active 101 DOM
-
2026-06-07days on market $250,000 Active 100 DOM
-
2026-06-05days on market $250,000 Active 97 DOM
-
2026-06-03days on market $250,000 Active 96 DOM
-
2026-06-02days on market $250,000 Active 95 DOM
-
2026-06-01days on market $250,000 Active 94 DOM
-
2026-05-31days on market $250,000 Active 93 DOM
-
2026-05-30days on market $250,000 Active 92 DOM
-
2026-02-27$250,000 Active 811-char remark
Show marketing remark (811 chars)
Positioned in a high-demand rental pocket of Visalia, this 2-bedroom, 1.5-bath bungalow with an upstairs loft and attached 1-car garage is a turnkey investment opportunity tailored for savvy buyers seeking steady cash flow and long-term appreciation.The property is professionally managed and tenant-occupied with a dependable long-term resident in place, delivering immediate income from day one. Its functional floor plan, low-maintenance design, and walkable access to shopping, dining, and everyday amenities enhance tenant retention and reduce vacancy risk.Ideal for investors looking to expand their portfolio with a performing asset in a strong rental market, this property offers the advantages of consistent returns, minimal oversight, and future upside potential in a growing Central Valley community.
-
2019-05-29soldstatus $115,000
ⓘ Source: listings_history table (triggers on properties + properties_extension) + one-shot
backfill from property_details.listing_events for pre-trigger history.
Tax reassessment forecast CA · Resets to sale price
- Current annual tax
- $1,399 · $117/mo
- Projected year-2 tax
- $1,900 · $158/mo
- Expected delta
- +$501/yr (+$42/mo · 35.8%)
ⓘ Screening estimate from a state-policy table — verify with the county assessor before closing.
Climate risk First Street
- Flood 1/10 Low FEMA zone X (shaded) · 0% chance over 30 yrs
- Wildfire 7/10 Severe
- Heat 8/10 Severe 7 d/yr ≥105°F today · 17 d/yr by 30 yrs out
- Wind 1/10 Low
- Air quality 10/10 Extreme 40 unhealthy d/yr today · 43 by 30 yrs out
Nearby sold comps map
Loading sold comps map…
Walkable amenities ~0.75 mi
Loading nearby amenities…
Taxation est. · year 1
- Rental income
- $21,661
- − Mortgage interest
- −$14,004
- − Property taxes
- −$1,399
- − Insurance
- −$1,250
- − Repairs & maintenance
- −$1,733
- − Management
- −$1,733
- − Depreciation
- −$7,273
- Taxable loss
- −$5,731
- Est. tax savings @ 24.0%
- +$1,375
- After-tax cash flow
- $106/yr
For passive investors: Depreciation is non-cash, so a rental often shows a tax loss while cash-flowing — sheltering income. Rental losses are passive: they offset passive income freely, and up to $25,000/yr can offset ordinary (W-2) income if you actively participate and your MAGI is under $100k (phasing out to $0 by $150k); unused losses carry forward. On sale, claimed depreciation is recaptured at up to 25%, and gains may owe capital-gains tax (a 1031 exchange can defer both). Figures are a year-1 estimate at your 24.0% rate — not tax advice; consult a CPA.
Schools (NCES district)
- District
- Visalia Unified
- NCES district ID
- 0641160
- Math proficiency
- 30% ▼ -3.00%
- Reading proficiency
- 40% ▼ -10.00%
- Median HH income
- $51,672
- Composite
- 30.47/100
- National rank
- #6223
- State rank
- #273 of 517 in CA
Livability — Visalia
- Score
- 72/100
- State rank
- #196
- US rank
- #6351
Category grades
Schools grade is shown separately in the Schools card above.
Census & demographics
- Census place
- Visalia, CA
- County
- Tulare County · 323,826 people
- City population
- 163,333
- Metro
- Visalia, CA
- Population (ZIP)
- 63,568
- Household income
- $82,610
- Rent vs Own
- Severe rent burden
- 1764.0
Population outlook (Tulare County) Hauer SSP2
- Today (2025)
- 484,681 people
- By 2030
- 496,241 · +2.4%
- By 2040
- 518,507 · +7.0%
- By 2050
- 534,920 · +10.4%
- By 2075
- 548,417 · +13.2%
- By 2100
- 513,085 · +5.9%
Race, ethnicity, and origin ACS 2023
- Neighborhood character
- Diverse neighborhood (Simpson 0.60)
- Race & ethnicity
- Hispanic / Latino 53% White 34% Two or more races 17% Asian 9% Black 2% Native American 1%
- Hispanic origin (detail)
- Mexican 48%
- Common ancestry
- Russian 2% Iranian 2% Lithuanian 1%
- Foreign-born
- 19% · Canada
- Languages at home
- 58% English-only · Spanish 36% Other Asian/Pacific 3% Other Indo-European 1%
Political lean MEDSL · Tulare
- 2024 margin
- Strong R (+20.7) · D 38.5% · R 59.2% · Other 2.3%
- 2008→2024 swing
- -5.4pp toward R · 2008: -15.3pp · 2024: -20.7pp
- All cycles
- 2024: R+20.7 2020: R+7.8 2016: R+12.1 2012: R+17.8 2008: R+15.3
Not yet ingested
- Civics
- —
Market trends
- HPI YoY
- ▼ -204.95%
- Current HPI
- 329.0192
- Rent YoY
- ▲ 3.12%
- Metro
- Visalia, CA
- State GDP YoY
- ▲ 3.21%
- F500 in state
- 116
Industry mix (Fortune 500 HQ in CA)
| Industry | F500 HQs | Revenue |
|---|---|---|
| Technology | 27 | $1,492B |
|
||
| Financial Services | 3 | $174B |
|
||
| Retail | 3 | $44B |
|
||
| Insurance | 3 | $26B |
|
||
| Media / Entertainment | 2 | $115B |
|
||
| Pharmaceuticals / Biotech | 2 | $62B |
|
||
Price history
+117.4% since first listed2 events — show timeline
- 2026-02-27 Listed $250,000 FRESNOMLS
- 2019-05-29 Sold (Public Records) $115,000 Public Records
Property tax history
+15.9%/yrLatest (2025): $1,399 · +2.9% YoY. Source: county tax records.
Cash-flow waterfall
monthlySold comps — $/sqft
last 12 mo · ≤1 miLoading sold comps…