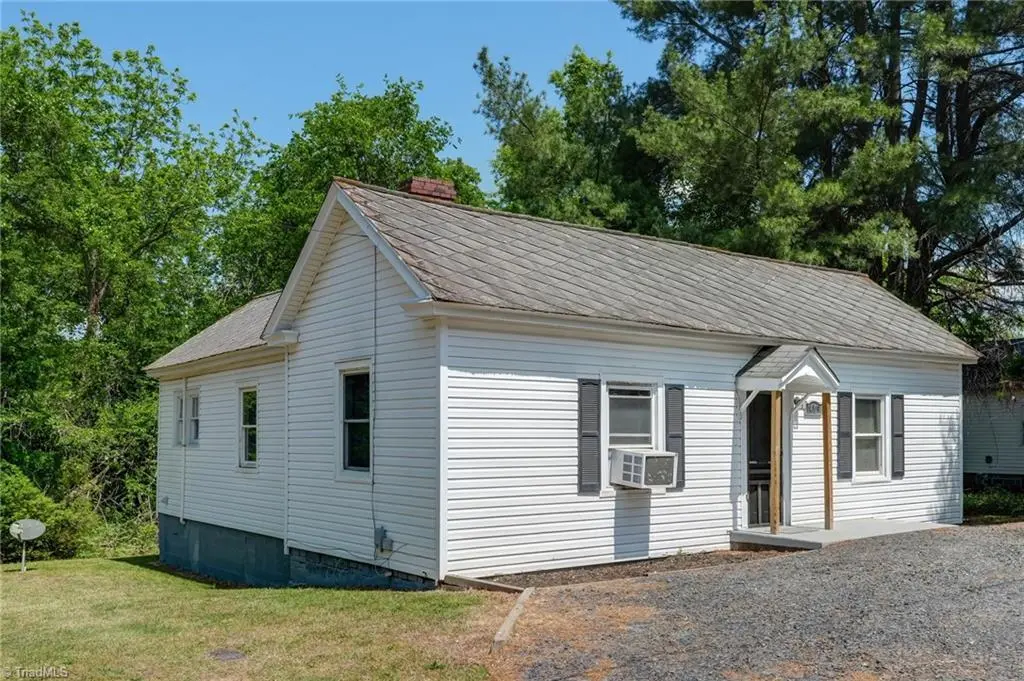
1409 Ridge Ave · Eden, NC
Flood risk 1/10 · Minimal
- FEMA flood zone
- X (unshaded)
- Chance of flooding over 30 yrs
- 0.0%
- Est. flood insurance / yr
- $507 – $1,088
Fire risk 3/10 · Minor
- Est. fire insurance / yr
- $906 – $1,684
Heat risk 6/10 · Moderate
- Hot days now (above 104°F)
- 7 days/yr
- Hot days in 30 yrs
- 18 days/yr
Wind risk 4/10 · Minor
- Chance of severe wind over 30 yrs
- 7.0%
Air-quality risk 2/10 · Minimal
- Unhealthy air days now
- 1 days/yr
- Unhealthy air days in 30 yrs
- 2 days/yr
Risk factors via First Street. Map © Google.
Why this score? — see what drove the B grade
The composite is a weighted blend of 9 inputs, each scored 0–100. Each bar is that input's sub-score; the figure is the points it added to the 100-point composite (weight × sub-score).
- Cash flow +29.8/30.0
- ARV discount +14.9/15.0
- DSCR +10.0/10.0
- 1% rule +7.3/10.0
- Livability +3.4/5.0
- Schools +3.3/10.0
- Rent growth +2.5/5.0
- Condition / age +2.5/5.0
- Appreciation +0.0/10.0
$89,999
🖨 Deal sheet 📄 Offer letter ✓ Due diligence
Listing remarks
Welcome to 1409 Ridge Ave—an ideal opportunity for first-time buyers, those looking to downsize, or investors seeking a solid rental property. This home offers low-maintenance living with baseboard heat and two window AC units for year-round comfort. New interior and some exterior paint. Conveniently located with public transportation nearby, it’s less than 2 miles to Purina and under 20 miles to Caesars Virginia. Enjoy an easy commute to Greensboro, Danville, and Martinsville, making this a smart choice for both homeowners and tenants alike. Close to UNC_-Rockingham hospital/medical facilities, restaurants, shopping, gold/swimming, skating, parks, rivers. Eden even has a drive
Key facts
- Close to parks
- Close to restaurants
- Close to shopping
Tags
Property features AI
Finance
- HOA & community: No homeowners association
Exterior
- Parking: Driveway (gravel)
- Utilities: Public water; Public sewer; Electric water heater; Electric heating fuel
- Home design: Residential stick/site-built house; One-level (single story); Built in 1921; Existing structure
- Construction: Vinyl siding and wood siding; Crawl space foundation
- Exterior features: City lot; Lot dimensions approximately 78 x 154 x 77 x 151
Interior
- Kitchen: Kitchen on the main level
- Bedrooms: Bedrooms on the main level (total rooms listed include bedrooms and living spaces)
- Bathrooms: One full bathroom
- Heating & cooling: Baseboard heating (electric); Window air conditioning units
- Interior features: Primary bedroom located on the main level; Attic access only
- Laundry & utility: Washer hookup; Dryer connection; Electric water heater
Neighborhood map
What this means for you Summary
Snapshot
- This is a 3-bed/1.0-bath single-family listed at $90k.
Deal economics
- At list price, monthly cash flow is $330 ($4k/yr) — positive.
- The deal already cash-flows at list — no discount required.
- Meets the 1% rule at list price ($1k rent vs $90k).
- Recommended offer: $87k (3.0% below list) — sets the bar for market timing.
- Cap rate 10.7% vs local median 4.3% in Eden — top-decile yield for the area; either an underpriced asset or a hidden risk that comps aren't pricing in. Stress-test before assuming the spread holds.
Location & tenants
- Location reads 67/100 on livability (#224 in NC) — a middle-class / working-renter tenant base. Strengths: cost of living A+, housing A+, health & safety A+; Watch: schools F, crime D-, amenities F.
- Rockingham County Schools (rural): math 38% / reading 40% proficiency, ranked #120 of 178 in NC (top 67%) — families likely to look elsewhere, expect single-tenant / working-renter base with shorter leases.
- Market conditions: 208 active listings in the ZIP; 3 comparable units currently listed for rent nearby; rentals at typical pace (median 23d on market — plan ~3-4 weeks tenant-placement turnaround); 344 units permitted in Rockingham County in 2024 (0 in 5+ unit buildings).
Forward outlook
- Local home prices are declining (-3.0%/yr); year-one equity from $622 of loan paydown is wiped out by about $3k of value loss. Plan a longer hold.
- Rockingham County population projected at -22% by 2050 — secular population decline; favor cash flow + early exit over multi-decade hold.
- At projected returns (-3.0% appreciation + 3.0% rent growth), your $25k cash investment doubles in ~8 years — after that, you're playing with house money.
Negotiation context
- It's been on market 52 days — a 3% lower offer ($87k) is reasonable based on typical stale-listing flexibility.
- Current owner paid $40k; list at $90k implies a 125% gain — meaningful room to come down on a strong offer.
Risks & watch-outs
- Watch-outs: built in 1921 — expect roof / HVAC / electrical / plumbing capex.
- Climate carrying-cost: extreme-heat days projected 7→18/yr by 2055 (HVAC capex compounding) — expect insurance premiums to compound above CPI over the hold.
Questions for the listing agent
- It's been on market 52 days. Have you received any prior offers? Is the seller open to a 3% concession, seller financing, or rate buy-down credit?
- Built in 1921 — when were the roof, HVAC, electrical panel, plumbing, and water heater last replaced?
- Is there a deadline driving the sale (1031 exchange, divorce, estate, relocation)? That informs how much negotiation room exists.
- Schools are F-rated, which usually means shorter tenancies and higher turnover. Who's the typical renter profile here, and what's been the actual vacancy rate?
- Crime grade is D in this area — have there been break-ins, vandalism, or insurance claims at this property in the last 3 years? What carrier currently insures it and at what premium?
- What's the average days-on-market for RENTAL listings here right now (not sales)? A rising rental-DOM trend means longer vacancies and softer asking-rent achievability than the comps imply.
- What's the recent tenant-quality profile in this submarket — average credit score on applications, eviction rate, late-payment / NSF rate, and stable-employment percentage? A property-management company in the area should have these aggregated.
- How much new for-sale + rental construction is in the pipeline within 1–3 miles? Heavy new supply typically softens prices + rents 12–24 months out; constrained supply supports both.
Investment metrics
- 1% rule
- 1.23% ✓
- Cap rate
- 10.70%
- Cash-on-cash
- 15.73%
- DSCR
- 1.70
- GRM
- 6.8
CMA / ARV
- ARV (on-the-fly)
- $107,632
- Comps found
- 12
Show comp detail 12 sales within ~0.75 mi
| Address | Dist | Beds/Ba | Sqft | Sold | Price | $/sf | Match |
|---|---|---|---|---|---|---|---|
| 124 S Byrd St | 0.22mi | 2/1.0 (-1) | 816 (-6%) | 1mo | $92,000 | $113 | 74 |
| 1411 Ridge Ave | 0.02mi | 2/1.0 (-1) | 964 (+11%) | 8mo | $89,500 | $93 | 69 |
| 406 S Byrd St | 0.48mi | 2/1.0 (-1) | 861 (-1%) | 6mo | $120,000 | $139 | 66 |
| 1202 Ridge Ave | 0.33mi | 2/1.0 (-1) | 937 (+8%) | 1mo | $47,500 | $51 | 66 |
| 104 Main St | 0.14mi | 2/1.0 (-1) | 967 (+11%) | 5mo | $120,000 | $124 | 65 |
| 107 S High St | 0.27mi | 2/1.0 (-1) | 803 (-8%) | 6mo | $23,000 | $29 | 64 |
| 1233 Front St | 0.31mi | 2/1.0 (-1) | 777 (-10%) | 6mo | $120,000 | $154 | 58 |
| 501 Overby St | 0.71mi | 3/1.0 | 890 (+2%) | 6mo | $145,000 | $163 | 58 |
| 1322 Delaware Ave | 0.27mi | 2/1.0 (-1) | 980 (+13%) | 4mo | $48,000 | $49 | 57 |
| 1424 South Ave | 0.34mi | 2/1.5 (-1) | 801 (-8%) | 12mo | $155,000 | $194 | 54 |
| 311 S Fieldcrest Rd | 0.41mi | 2/1.0 (-1) | 932 (+7%) | 12mo | $148,000 | $159 | 53 |
| 1137 W Fieldcrest Rd | 0.48mi | 2/1.0 (-1) | 992 (+14%) | 10mo | $110,000 | $111 | 40 |
Match score weights: distance 35% · size 25% · config 20% · recency 20%. Top-matched comps best support the ARV.
Projected returns pro-forma
-3.0% appreciation · 3.0% rent growth · sell at horizon
- IRR
- 6.5%
- Equity multiple
- 1.26×
- Total profit
- $6,427
- Equity at exit
- $13,419
- IRR
- 15.9%
- Equity multiple
- 2.29×
- Total profit
- $32,564
- Equity at exit
- $7,781
Cash invested: $25,200 (down + closing). Projections, not guarantees.
Landlord ↔ Tenant lean methodology
- Overall (STATE)
- 85 Strongly Landlord-Friendly
- State North Carolina
- 85 Strongly Landlord-Friendly · R+3
- County
- — inherits STATE
- City
- — inherits STATE
ZIP-level market 27288
- Home prices YoY
- -26.5%
- Active inventory
- 208
- Price-to-rent
- 6.8×
Monthly cashflow live
- Estimated rent
- $1,106 medium interval (Pro) →
- Mortgage (P&I)
- −$472
- Tax from tax record
- −$34 /mo · $403/yr
- Insurance
- −$37
- HOA
- −$0
- Vacancy / Maint / Mgmt
- −$232
- Net cashflow
- $330
Break-even live
UW: 25.0% down · 7.5% · 30yr · 1.5% tax · 5.0% vac · 8.0% maint · 8.0% mgmt
Financing live
Cash to close
- Down payment
- $22,500
- Closing costs
- $2,700
- Reserves months
- —
- Total cash needed
- —
Loan-product check · same deal, 3 products live
Conventional
25% down · 7.5% · 30yr
- Down + closing
- —
- Monthly P&I
- —
- Monthly cashflow
- —
- DSCR
- —
- Eligible?
- —
Personal DTI + credit; lowest rate.
DSCR
20% down · 8.5% · 30yr
- Down + closing
- —
- Monthly P&I
- —
- Monthly cashflow
- —
- DSCR
- —
- Eligible?
- —
No personal income docs; deal must DSCR.
Hard money
10% down · 12.0% · 12mo
- Down + closing
- —
- Monthly P&I
- —
- Monthly cashflow
- —
- DSCR
- —
- Eligible?
- —
Short-term bridge; refi at stabilization.
Rent comps 3 comps
| Address | Beds | Baths | Sqft | Rent | $/sqft | DOM | Units | Dist |
|---|---|---|---|---|---|---|---|---|
| 1318 Ridge Ave Eden, NC | 2.0 | 2.0 | 783 | $1,100 | $1.40 | 21d | 1 | 0.12mi |
| 1318 Front St Eden, NC | 3.0 | 1.0 | 1007 | $1,000 | $0.99 | 23d | 1 | 0.20mi |
| 1314 Front St Eden, NC | 2.0 | 1.0 | 1040 | $1,100 | $1.06 | 23d | 1 | 0.20mi |
Listing history 24 events
-
2026-06-18days on market $89,999 Active 52 DOM
-
2026-06-17days on market $89,999 Active 51 DOM
-
2026-06-16days on market $89,999 Active 50 DOM
-
2026-06-15days on market $89,999 Active 49 DOM
-
2026-06-14days on market $89,999 Active 47 DOM
-
2026-06-13pricedays on market $89,999 Active 46 DOM
-
2026-06-10days on market $99,999 Active 44 DOM
-
2026-06-09days on market $99,999 Active 43 DOM
-
2026-06-08days on market $99,999 Active 42 DOM
-
2026-06-07days on market $99,999 Active 41 DOM
-
2026-06-03days on market $99,999 Active 37 DOM
-
2026-06-02days on market $99,999 Active 36 DOM
-
2026-06-01days on market $99,999 Active 35 DOM
-
2026-05-31days on market $99,999 Active 34 DOM
-
2026-05-31days on market $99,999 Active 33 DOM
-
2026-04-27$120,000 Active
-
2026-01-02price $79,900
-
2025-08-26price $85,000
-
2025-06-24price $99,900
-
2025-05-29price $105,000
-
2017-02-01soldstatus $40,000
-
2009-04-29soldstatus $22,750
-
2006-04-13soldstatus $39,000
-
2002-06-10soldstatus $17,000
ⓘ Source: listings_history table (triggers on properties + properties_extension) + one-shot
backfill from property_details.listing_events for pre-trigger history.
Tax reassessment forecast NC · Resets to sale price
- Current annual tax
- $403 · $34/mo
- Projected year-2 tax
- $738 · $61/mo
- Expected delta
- +$335/yr (+$28/mo · 83.0%)
ⓘ Screening estimate from a state-policy table — verify with the county assessor before closing.
Climate risk First Street
- Flood 1/10 Low FEMA zone X (unshaded) · 0% chance over 30 yrs
- Wildfire 3/10 Moderate
- Heat 6/10 Major 7 d/yr ≥104°F today · 18 d/yr by 30 yrs out
- Wind 4/10 Moderate 7% chance of damaging wind over 30 yrs
- Air quality 2/10 Low 1 unhealthy d/yr today · 2 by 30 yrs out
Nearby sold comps map
Loading sold comps map…
Walkable amenities ~0.75 mi
Loading nearby amenities…
Taxation est. · year 1
- Rental income
- $13,268
- − Mortgage interest
- −$5,041
- − Property taxes
- −$403
- − Insurance
- −$450
- − Repairs & maintenance
- −$1,061
- − Management
- −$1,061
- − Depreciation
- −$2,618
- Taxable income
- $2,632
- Est. tax owed @ 24.0%
- −$632
- After-tax cash flow
- $3,333/yr
For passive investors: Depreciation is non-cash, so a rental often shows a tax loss while cash-flowing — sheltering income. Rental losses are passive: they offset passive income freely, and up to $25,000/yr can offset ordinary (W-2) income if you actively participate and your MAGI is under $100k (phasing out to $0 by $150k); unused losses carry forward. On sale, claimed depreciation is recaptured at up to 25%, and gains may owe capital-gains tax (a 1031 exchange can defer both). Figures are a year-1 estimate at your 24.0% rate — not tax advice; consult a CPA.
Schools (NCES district)
- District
- Rockingham County Schools
- NCES district ID
- 3703990
- Math proficiency
- 38% ▼ -2.00%
- Reading proficiency
- 40% ▲ 1.00%
- Median HH income
- $38,914
- Composite
- 32.6/100
- National rank
- #5673
- State rank
- #120 of 178 in NC
Livability — Eden
- Score
- 67/100
- State rank
- #224
- US rank
- #10535
Category grades
Schools grade is shown separately in the Schools card above.
Census & demographics
- Census place
- Eden, NC
- County
- Rockingham County · 22,926 people
- City population
- 22,926
- Metro
- Greensboro-High Point, NC
- Population (ZIP)
- 22,926
- Household income
- $52,594
- Rent vs Own
- Severe rent burden
- 860.0
Population outlook (Rockingham County) Hauer SSP2
- Today (2025)
- 87,103 people
- By 2030
- 83,763 · -3.8%
- By 2040
- 76,082 · -12.7%
- By 2050
- 68,106 · -21.8%
- By 2075
- 52,531 · -39.7%
- By 2100
- 39,871 · -54.2%
Race, ethnicity, and origin ACS 2023
- Neighborhood character
- Predominantly White (67%)
- Race & ethnicity
- White 67% Black 23% Hispanic / Latino 6% Two or more races 5% Native American 1%
- Hispanic origin (detail)
- Mexican 4%
- Common ancestry
- Serbian 2% Slovak 2% Lithuanian 1%
- Foreign-born
- 3% · Canada
- Languages at home
- 94% English-only · Spanish 5% German/W. Germanic 1%
Political lean MEDSL · Rockingham
- 2024 margin
- Solid R (+35.9) · D 31.7% · R 67.6%
- 2008→2024 swing
- -19.9pp toward R · 2008: -16.0pp · 2024: -35.9pp
- All cycles
- 2024: R+35.9 2020: R+32.0 2016: R+30.0 2012: R+21.3 2008: R+16.0
Not yet ingested
- Civics
- —
Market trends
- HPI YoY
- ▼ -66.28%
- Current HPI
- 183.5709
- Rent YoY
- —
- Metro
- Greensboro-High Point, NC
- State GDP YoY
- ▲ 3.28%
- F500 in state
- 26
Industry mix (Fortune 500 HQ in NC)
| Industry | F500 HQs | Revenue |
|---|---|---|
| Financial Services | 2 | $213B |
|
||
| Retail | 2 | $95B |
|
||
| Industrial Conglomerate | 1 | $38B |
|
||
| Metals / Steel | 1 | $35B |
|
||
| Utilities | 1 | $30B |
|
||
| Industrial Machinery | 1 | $19B |
|
||
Price history
+605.9% since first listed9 events — show timeline
- 2026-04-27 Listed $120,000 Triad MLS
- 2026-01-02 Price Changed $79,900 Triad MLS
- 2025-08-26 Price Changed $85,000 Triad MLS
- 2025-06-24 Price Changed $99,900 Triad MLS
- 2025-05-29 Price Changed $105,000 Triad MLS
- 2017-02-01 Sold (Public Records) $40,000 Public Records
- 2009-04-29 Sold (Public Records) $22,750 Public Records
- 2006-04-13 Sold (Public Records) $39,000 Public Records
- 2002-06-10 Sold (Public Records) $17,000 Public Records
Property tax history
+1.4%/yrLatest (2025): $403 · +0.0% YoY. Source: county tax records.
Cash-flow waterfall
monthlySold comps — $/sqft
last 12 mo · ≤1 miLoading sold comps…