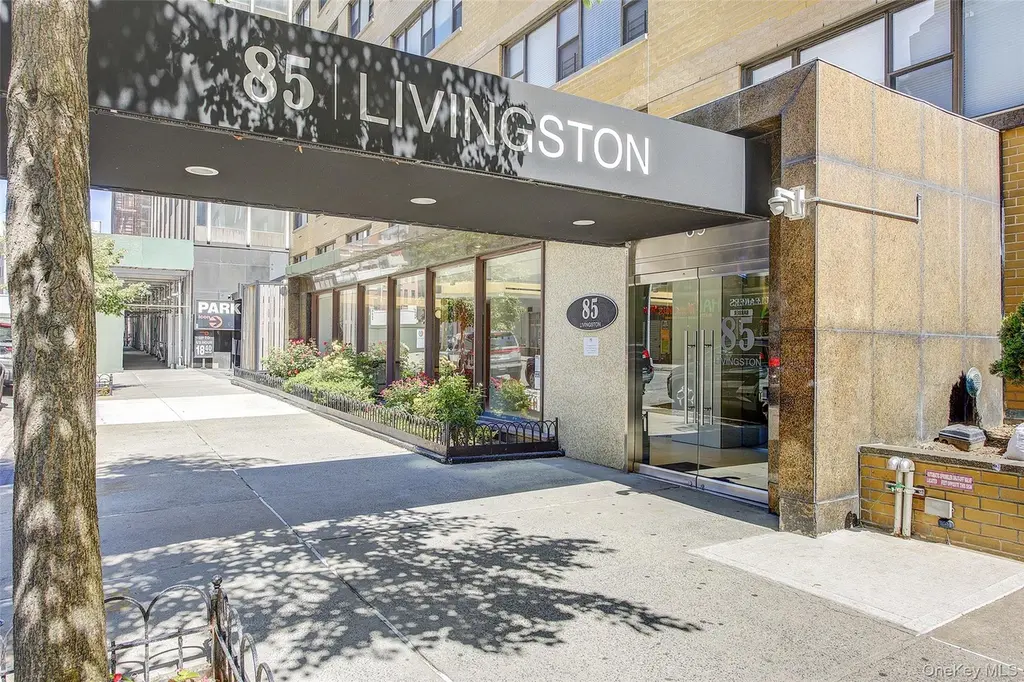
85 Livingston Unit 8O · New York, NY
Flood risk No data
- FEMA flood zone
- —
- Chance of flooding over 30 yrs
- —
- Est. flood insurance / yr
- —
Fire risk No data
- Est. fire insurance / yr
- —
Heat risk No data
- Hot days now (above threshold)
- —
- Hot days in 30 yrs
- —
Wind risk No data
- Chance of severe wind over 30 yrs
- —
Air-quality risk No data
- Unhealthy air days now
- —
- Unhealthy air days in 30 yrs
- —
Risk factors via First Street. Map © Google.
Why this score? — see what drove the B+ grade
The composite is a weighted blend of 9 inputs, each scored 0–100. Each bar is that input's sub-score; the figure is the points it added to the 100-point composite (weight × sub-score).
- Cash flow +28.5/30.0
- DSCR +10.0/10.0
- Appreciation +8.0/10.0
- 1% rule +7.9/10.0
- ARV discount +7.5/15.0
- Schools +5.0/10.0
- Rent growth +3.8/5.0
- Livability +3.8/5.0
- Condition / age +1.0/5.0
$399,000
🖨 Deal sheet 📄 Offer letter ✓ Due diligence
Listing remarks
This incredible "blank canvas" opportunity is tailor-made for a visionary cash buyer looking to design their dream space from scratch at The Robert Livingston co-op, located at 85 Livingston Street in Brooklyn. A true contractor's special requiring a complete top-to-bottom renovation, this bright alcove studio is bathed in natural light and features a spacious layout that easily accommodates distinct living and dining areas, complete with a partial wall already in place to separate the sleeping nook. While the apartment interior awaits your architect's touch, the building itself has been beautifully modernized with premium upgrades, including a renovated lobby, a WiFi-enabled co-w
Key facts
- Renovated lobby
- Brand new gym
- Spacious layout
Tags
Property features AI
Exterior
- Parking: No carport; Other parking features
- Utilities: Public sewer; Electricity connected; Natural gas connected
- Home design: Stock Cooperative property
- Construction: Measured living area reported
- Exterior features: Not waterfront; Other construction materials; Other foundation details
Interior
- Kitchen: No appliances included
- Bedrooms: 3 total rooms (includes bedrooms and living areas)
- Bathrooms: 1 full bathroom
- Heating & cooling: Steam heating; Electric cooling
- Interior features: Other interior features; Pets allowed; Measured living area
- Laundry & utility: Basement: common
Neighborhood map
What this means for you Summary
Snapshot
- This is a 1-bed/1.0-bath condo listed at $399k. Condition is rated poor.
Deal economics
- At list price, monthly cash flow is $1k ($16k/yr) — positive.
- The deal already cash-flows at list — no discount required.
- Meets the 1% rule at list price ($5k rent vs $399k).
- Cap rate 10.2% vs local median 2.6% in New York — top-decile yield for the area; either an underpriced asset or a hidden risk that comps aren't pricing in. Stress-test before assuming the spread holds.
Location & tenants
- Location reads 75/100 on livability (#268 in NY, #4,188 nationally) — a middle-class / working-renter tenant base. Strengths: amenities A+, commute A+, health & safety A; Watch: crime F, cost of living F.
- Market conditions: Rents rising fast (+5.4%/yr); 393 active listings in the ZIP; 31 comparable units currently listed for rent nearby; rentals leasing fast (median 3d on market — plan ~1-2 weeks tenant-placement turnaround); high-income renter base; 10,063 units permitted in Kings County in 2024 (9,789 in 5+ unit buildings).
- This rent runs 36% of the median local income ($173k/yr) — at the standard rent-burdened threshold; future hikes will face affordability resistance.
Forward outlook
- In year one you build about $27k of equity ($3k loan paydown + $24k appreciation (6.0% local appreciation)).
- Kings County population projected at +13% by 2050 — modest demand growth; plan on rents tracking national, not racing it.
- At projected returns (6.0% appreciation + 5.4% rent growth), your $112k cash investment doubles in ~3 years — after that, you're playing with house money.
- By year 2, paydown + projected appreciation supports a ~$43k cash-out refi (75% LTV) — recoverable capital for the next deal without selling this one.
Negotiation context
- Only 13 days on market — expect competitive offers; lowballing is unlikely to land.
Questions for the listing agent
- Have any recent inspections been done? Can we get a copy of the seller's disclosures and any deferred-maintenance estimates?
- Built in 1964 — when were the roof, HVAC, electrical panel, plumbing, and water heater last replaced?
- Any open or pending special assessments — roof, HVAC, plumbing, elevator, façade? What's the per-unit balance and payoff schedule, and is the seller paying it off at close or rolling it to the buyer?
- Is there a deadline driving the sale (1031 exchange, divorce, estate, relocation)? That informs how much negotiation room exists.
- Schools are B-rated — typically a magnet for longer-tenancy family renters. What's the average tenant stay here, and is there a school-zone premium baked into asking?
- Crime grade is F in this area — have there been break-ins, vandalism, or insurance claims at this property in the last 3 years? What carrier currently insures it and at what premium?
- What's the average days-on-market for RENTAL listings here right now (not sales)? A rising rental-DOM trend means longer vacancies and softer asking-rent achievability than the comps imply.
- What's the recent tenant-quality profile in this submarket — average credit score on applications, eviction rate, late-payment / NSF rate, and stable-employment percentage? A property-management company in the area should have these aggregated.
- How much new apartment / multifamily construction is in the pipeline within 1–3 miles? Heavy new supply (>2% of stock underway) typically softens rents 12–24 months out; light construction supports rent growth.
Investment metrics
- 1% rule
- 1.29% ✓
- Cap rate
- 10.23%
- Cash-on-cash
- 14.06%
- DSCR
- 1.63
- GRM
- 6.5
CMA / ARV
No comps found within radius.
Projected returns pro-forma
5.97% appreciation · 5.39% rent growth · sell at horizon
- IRR
- 28.4%
- Equity multiple
- 2.88×
- Total profit
- $210,534
- Equity at exit
- $249,961
- IRR
- 27.6%
- Equity multiple
- 6.22×
- Total profit
- $582,709
- Equity at exit
- $452,546
Cash invested: $111,720 (down + closing). Projections, not guarantees.
Landlord ↔ Tenant lean methodology
- Overall (CITY)
- 0 Strongly Tenant-Friendly
- State New York
- 15 Strongly Tenant-Friendly · D+10
- County
- — inherits STATE
- City New York
- 0 Strongly Tenant-Friendly · D+34
ZIP-level market 11201
- Home prices YoY
- 1.9%
- Rents YoY
- 5.4%
- Active inventory
- 393
- Price-to-rent
- 6.5×
Monthly cashflow live
- Estimated rent
- $5,148 high interval (Pro) →
- Mortgage (P&I)
- −$2,092
- Tax est. 1.5%
- −$499 /mo · $5,985/yr
- Insurance
- −$166
- HOA
- −$0
- Vacancy / Maint / Mgmt
- −$1,081
- Net cashflow
- $1,309
Break-even live
UW: 25.0% down · 7.5% · 30yr · 1.5% tax · 5.0% vac · 8.0% maint · 8.0% mgmt
Financing live
Cash to close
- Down payment
- $99,750
- Closing costs
- $11,970
- Reserves months
- —
- Total cash needed
- —
Loan-product check · same deal, 3 products live
Conventional
25% down · 7.5% · 30yr
- Down + closing
- —
- Monthly P&I
- —
- Monthly cashflow
- —
- DSCR
- —
- Eligible?
- —
Personal DTI + credit; lowest rate.
DSCR
20% down · 8.5% · 30yr
- Down + closing
- —
- Monthly P&I
- —
- Monthly cashflow
- —
- DSCR
- —
- Eligible?
- —
No personal income docs; deal must DSCR.
Hard money
10% down · 12.0% · 12mo
- Down + closing
- —
- Monthly P&I
- —
- Monthly cashflow
- —
- DSCR
- —
- Eligible?
- —
Short-term bridge; refi at stabilization.
Rent comps 31 comps
| Address | Beds | Baths | Sqft | Rent | $/sqft | DOM | Units | Dist |
|---|---|---|---|---|---|---|---|---|
| 200 Montague St #1516 Brooklyn, NY | 1.0 | 1.0 | 600 | $7,500 | $12.50 | 21d | 1 | 0.12mi |
| 180 Montague St Brooklyn, NY | 3.0 | 1.0–2.0 | 901 | $5,327 | $5.91 | 2d | 13 | 0.15mi |
| 141 Joralemon St #819 Brooklyn, NY | 1.0–3.0 | 1.0–2.0 | 750 | $5,820 | $7.76 | 2d | 3 | 0.16mi |
| 150 Lawrence St Brooklyn, NY | 1.0–2.0 | 1.0–2.0 | 700 | $4,920 | $7.03 | 2d | 2 | 0.24mi |
| 111 Lawrence St Brooklyn, NY | 3.0 | 1.0–2.0 | 950 | $4,356 | $4.58 | 2d | 24 | 0.27mi |
| 72 Willoughby St Brooklyn, NY | 1.0–2.0 | 1.0 | 487 | $3,900 | $8.00 | 2d | 2 | 0.27mi |
| 100 Willoughby St Brooklyn, NY | 3.0 | 1.0–2.0 | 892 | $5,232 | $5.87 | 8d | 1 | 0.33mi |
| 214 Duffield St Brooklyn, NY | 3.0 | 1.0–2.0 | 956 | $4,347 | $4.55 | 2d | 1 | 0.34mi |
| 343 Gold St Brooklyn, NY | 3.0 | 1.0–2.0 | 903 | $5,053 | $5.59 | 5d | 1 | 0.45mi |
| 540 Fulton St #1729 Brooklyn, NY | 3.0 | 1.0–2.0 | 750 | $5,737 | $7.65 | 25d | 4 | 0.56mi |
| 107 Columbia Hts #1757 Brooklyn, NY | 1.0–2.0 | 1.0–2.0 | 708 | $5,710 | $8.06 | 2d | 2 | 0.56mi |
| 10 Nevins St Unit 9D Brooklyn, NY | — | 1.0 | 488 | $3,500 | $7.17 | 25d | 1 | 0.56mi |
| 196 Willoughby St Brooklyn, NY | 2.0 | 1.0–2.0 | 717 | $6,064 | $8.46 | 2d | 8 | 0.57mi |
| 333 Schermerhorn St Brooklyn, NY | 1.0 | 1.0 | 585 | $6,782 | $11.58 | 4d | 16 | 0.62mi |
| 160 Front St Brooklyn, NY | 1.0 | 1.0 | 597 | $5,191 | $8.70 | 2d | 2 | 0.73mi |
| 68 Gold St New York, NY | 1.0–2.0 | 1.0 | 700 | $3,610 | $5.16 | 25d | 2 | 0.97mi |
| 151 S Elliott Pl Brooklyn, NY | 1.0–2.0 | 1.0–2.0 | 655 | $4,670 | $7.13 | 2d | 2 | 0.98mi |
| 461 Dean St Brooklyn, NY | 1.0 | 1.0 | 781 | $5,320 | $6.81 | 5d | 5 | 1.07mi |
| 655 Union St #1846 Brooklyn, NY | 1.0–2.0 | 1.0–2.0 | 727 | $5,780 | $7.95 | 3d | 2 | 1.07mi |
| 95 Wall St New York, NY | 2.0 | 1.0–2.0 | 733 | $5,862 | $8.00 | 2d | 39 | 1.24mi |
| 75 Wall St Unit 251 New York, NY | 1.0 | 1.5 | 653 | $6,580 | $10.08 | 25d | 1 | 1.27mi |
| 75 Wall St New York, NY | 3.0 | 1.0–3.0 | 452 | $7,598 | $16.81 | 15d | 16 | 1.27mi |
| 10 Hanover Sq New York, NY | 2.0 | 1.0–2.0 | 790 | $5,948 | $7.53 | 2d | 25 | 1.28mi |
| 25 Water St Unit 707 New York, NY | — | 1.0 | 550 | $3,950 | $7.18 | 25d | 1 | 1.28mi |
| 25 Water St Apt 706 New York, NY | — | 1.0 | 550 | $3,990 | $7.25 | 25d | 1 | 1.28mi |
| 180 Water St #537 New York, NY | 1.0–2.0 | 1.0–2.0 | 728 | $8,040 | $11.04 | 3d | 2 | 1.29mi |
| 67 Wall St #13 New York, NY | 1.0–2.0 | 1.0 | 636 | $5,750 | $9.03 | 3d | 2 | 1.31mi |
| 3 Hanover Sq New York, NY | 3.0 | 1.0–2.0 | 600 | $4,534 | $7.56 | 25d | 5 | 1.32mi |
| 63 Wall St #1971 New York, NY | — | 1.0 | 489 | $5,190 | $10.61 | 21d | 1 | 1.32mi |
| 475 Clermont Ave Brooklyn, NY | 2.0 | 1.0–2.0 | 807 | $5,144 | $6.37 | 4d | 7 | 1.34mi |
| 545 Vanderbilt Ave Brooklyn, NY | 2.0 | 1.0 | 600 | $4,910 | $8.18 | 3d | 3 | 1.41mi |
HOA detail condo
- Monthly dues
- $0 · $0/yr
- Likely covers
- internet
- Assessments
- None detected in remarks — confirm with the listing agent.
Listing history 9 events
-
2026-06-18days on market $399,000 Active 13 DOM
-
2026-06-17days on market $399,000 Active 12 DOM
-
2026-06-16days on market $399,000 Active 11 DOM
-
2026-06-15days on market $399,000 Active 10 DOM
-
2026-06-13days on market $399,000 Active 8 DOM
-
2026-06-09days on market $399,000 Active 4 DOM
-
2026-06-08days on market $399,000 Active 3 DOM
-
2026-06-07remarks 689-char remark
-
2026-06-07$399,000 Active 2 DOM
ⓘ Source: listings_history table (triggers on properties + properties_extension) + one-shot
backfill from property_details.listing_events for pre-trigger history.
Nearby sold comps map
Loading sold comps map…
Walkable amenities ~0.75 mi
Loading nearby amenities…
Taxation est. · year 1
- Rental income
- $61,774
- − Mortgage interest
- −$22,350
- − Property taxes
- −$5,985
- − Insurance
- −$1,995
- − Repairs & maintenance
- −$4,942
- − Management
- −$4,942
- − Depreciation
- −$11,607
- Taxable income
- $9,953
- Est. tax owed @ 24.0%
- −$2,389
- After-tax cash flow
- $13,324/yr
For passive investors: Depreciation is non-cash, so a rental often shows a tax loss while cash-flowing — sheltering income. Rental losses are passive: they offset passive income freely, and up to $25,000/yr can offset ordinary (W-2) income if you actively participate and your MAGI is under $100k (phasing out to $0 by $150k); unused losses carry forward. On sale, claimed depreciation is recaptured at up to 25%, and gains may owe capital-gains tax (a 1031 exchange can defer both). Figures are a year-1 estimate at your 24.0% rate — not tax advice; consult a CPA.
Condition & rehab AI · 13 photos
This property requires a complete renovation, including kitchen and bathroom updates, to become move-in ready and increase its value.
Repairs flagged
- Major Exposed wiring — Safety hazard
- Major Missing appliances — Functionality compromised
- Major Damaged flooring — Structural integrity compromised
Value-add opportunities
- Both Complete renovation of kitchen and bathroom — Essential for functionality and safety
- Both Rehabilitation of flooring and walls — Improves aesthetics and structural integrity
Renovation cost estimate screening
| Repair item | Severity | Est. cost |
|---|---|---|
| Exposed wiring · Safety hazard | Major | $15,000–50,000 |
| Missing appliances · Functionality compromised | Major | $15,000–50,000 |
| Damaged flooring · Structural integrity compromised | Major | $15,000–50,000 |
| Total estimated repair cost · 3 items | $45,000–150,000 |
Value-add ROI direction
- Both Complete renovation of kitchen and bathroom — Essential for functionality and safety ↑
- Both Rehabilitation of flooring and walls — Improves aesthetics and structural integrity ↑
ⓘ Cost ranges are severity-bucket heuristics (US national rule-of-thumb). Get contractor quotes + a written scope before underwriting a rehab budget.
Schools (NCES district)
No district data.
Livability — New York
- Score
- 75/100
- State rank
- #268
- US rank
- #4188
Category grades
Schools grade is shown separately in the Schools card above.
Census & demographics
- Census place
- New York, NY
- County
- Kings County · 2,614,986 people
- City population
- 7,731,280
- Metro
- New York-Newark-Jersey City, NY-NJ-PA
- Population (ZIP)
- 70,674
- Household income
- $173,136
- Rent vs Own
- Severe rent burden
- 4080.0
Population outlook (Kings County) Hauer SSP2
- Today (2025)
- 2,847,441 people
- By 2030
- 2,937,006 · +3.1%
- By 2040
- 3,095,491 · +8.7%
- By 2050
- 3,228,968 · +13.4%
- By 2075
- 3,321,723 · +16.7%
- By 2100
- 3,111,387 · +9.3%
Race, ethnicity, and origin ACS 2023
- Neighborhood character
- Diverse neighborhood (Simpson 0.62)
- Race & ethnicity
- White 58% Asian 14% Black 12% Hispanic / Latino 11% Two or more races 10%
- Hispanic origin (detail)
- Mexican 1% Puerto Rican 3% Dominican 2%
- Common ancestry
- Romanian 4% Scotch-Irish 3% Lithuanian 3%
- Foreign-born
- 21% · Canada, China, South Korea
- Languages at home
- 75% English-only · Spanish 7% Chinese 6% Other Indo-European 3%
Political lean MEDSL · Kings
- 2024 margin
- Solid D (+44.0) · D 72.0% · R 28.0%
- 2008→2024 swing
- -15.5pp toward R · 2008: 59.4pp · 2024: 44.0pp
- All cycles
- 2024: D+44.0 2020: D+54.8 2016: D+61.8 2012: D+63.9 2008: D+59.4
Not yet ingested
- Civics
- —
Market trends
- HPI YoY
- ▲ 5.97%
- Current HPI
- 321.3623
- Rent YoY
- ▲ 5.39%
- Metro
- New York-Newark-Jersey City, NY-NJ-PA
- State GDP YoY
- ▲ 2.60%
- F500 in state
- 92
Industry mix (Fortune 500 HQ in NY)
| Industry | F500 HQs | Revenue |
|---|---|---|
| Financial Services | 10 | $950B |
|
||
| Consumer Goods | 9 | $162B |
|
||
| Insurance | 4 | $225B |
|
||
| Telecommunications | 2 | $144B |
|
||
| Pharmaceuticals | 2 | $112B |
|
||
| Media / Entertainment | 2 | $69B |
|
||
Price history
1 event — show timeline
- 2026-06-05 Listed $399,000 OneKey® MLS as Distributed by MLS Grid
Cash-flow waterfall
monthlySold comps — $/sqft
last 12 mo · ≤1 miLoading sold comps…