1612 Ridge Rd · El Paso, AR
Flood risk 1/10 · Minimal
- FEMA flood zone
- X (unshaded)
- Chance of flooding over 30 yrs
- 0.0%
- Est. flood insurance / yr
- $507 – $1,088
Fire risk 4/10 · Minor
- Est. fire insurance / yr
- $1,499 – $2,785
Heat risk 6/10 · Moderate
- Hot days now (above 110°F)
- 7 days/yr
- Hot days in 30 yrs
- 19 days/yr
Wind risk 3/10 · Minor
- Chance of severe wind over 30 yrs
- 6.0%
Air-quality risk 2/10 · Minimal
- Unhealthy air days now
- 1 days/yr
- Unhealthy air days in 30 yrs
- 1 days/yr
Risk factors via First Street. Map © Google.
Why this score? — see what drove the C grade
The composite is a weighted blend of 9 inputs, each scored 0–100. Each bar is that input's sub-score; the figure is the points it added to the 100-point composite (weight × sub-score).
- Cash flow +16.9/30.0
- ARV discount +14.7/15.0
- Appreciation +5.8/10.0
- DSCR +5.3/10.0
- Schools +3.4/10.0
- 1% rule +3.3/10.0
- Rent growth +2.5/5.0
- Livability +2.5/5.0
- Condition / age +2.5/5.0
$115,000
🖨 Deal sheet (PDF) 📄 Offer letter ✓ Due diligence
Listing remarks
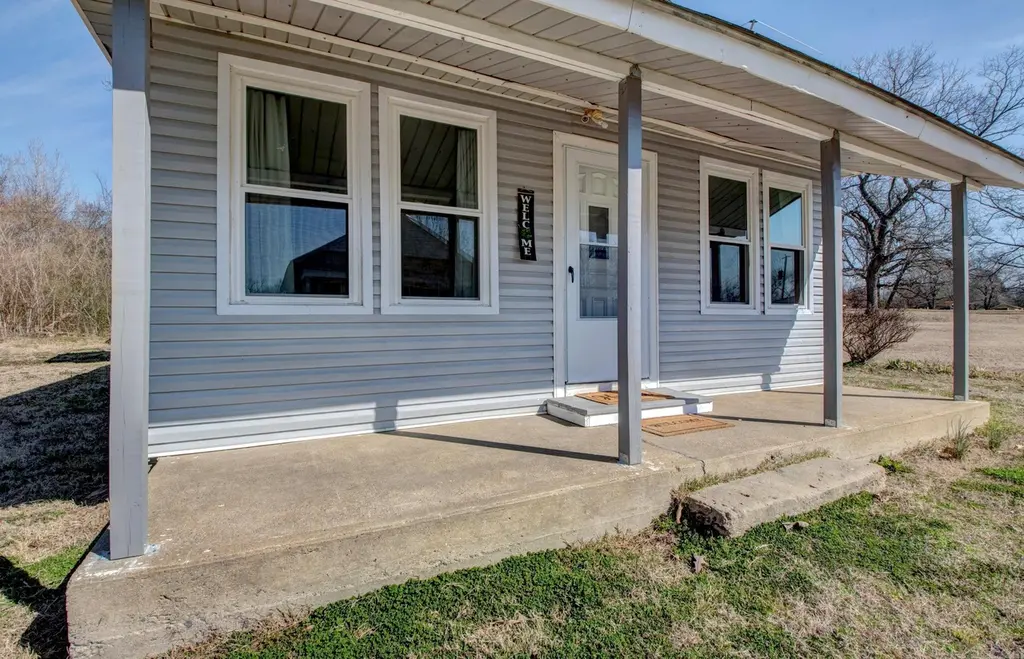
Welcome to 1612 Ridge Road in El Paso, Arkansas! This charming 2-bedroom, 1-bath home offers approximately 1,016 square feet of comfortable living space in the heart of a peaceful small-town setting. Built in 1964, this cozy home blends character and functionality with an inviting atmosphere that feels like home the moment you walk through the door. The efficient floor plan makes excellent use of space, while the spacious lot provides room to enjoy outdoor living, gardening, or simply relaxing in a quiet rural setting. Conveniently located near local amenities while maintaining the tranquility of country living, this property is ideal for first-time buyers, downsizers, or investors looking
Key facts
- 7,405 sq ft lot
- Built 1939
- Listed 9 days
Property features AI
Finance
- Financial info: Financing options may include VA, FHA, conventional, rural development, cash, or in-house financing
Exterior
- Parking: Carport
- Utilities: Septic system; Public water; Municipal electric service (Entergy)
- Home design: Metal/Vinyl siding exterior
- Construction: 3-tab shingle roof; Crawl space foundation
- Exterior features: Front porch; Paved road access; Level lot; Rural property setting; Not in a subdivision; No-fee area amenities
Interior
- Kitchen: Free-standing stove
- Flooring: Luxury vinyl flooring
- Bathrooms: 1 full bathroom
- Heating & cooling: Central electric heat; Central electric cooling
- Interior features: Washer connection; Electric dryer connection; Paneling walls/ceilings
- Laundry & utility: Washer hookup; Electric dryer hookup
Neighborhood map
What this means for you Summary
Snapshot
- This is a 2-bed/1.0-bath single-family listed at $115k.
Deal economics
- At list price, monthly cash flow is $76 ($913/yr) — positive.
- The deal already cash-flows at list — no discount required.
- To meet the 1% rule (rent ≥ 1% of price), the offer needs to be $95k (17.2% below list).
- Recommended offer: $95k (17.2% below list) — sets the bar for 1% rule.
Location & tenants
- Location reads: area grade C — affects rentability + tenant quality, not the cash-flow math above.
- Beebe School District (town): math 44% / reading 36% proficiency, ranked #64 of 238 in AR (top 27%) — families likely to look elsewhere, expect single-tenant / working-renter base with shorter leases.
- Market conditions: 10 active listings in the ZIP; 219 units permitted in White County in 2024 (36 in 5+ unit buildings).
Forward outlook
- In year one you build about $3k of equity ($795 loan paydown + $2k appreciation (1.5% local appreciation)).
- White County population projected at +7% by 2050 — modest demand growth; plan on rents tracking national, not racing it.
- At projected returns (1.5% appreciation + 3.0% rent growth), your $32k cash investment doubles in ~8 years — after that, you're playing with house money.
Negotiation context
- Only 10 days on market — expect competitive offers; lowballing is unlikely to land.
- 8 sale attempts since 13y ago with the ask held roughly flat each time — persistent listings suggest the price (not the market) is what's stuck; bring a comps-based counter.
- Current owner paid $45k; list at $115k implies a 156% gain — meaningful room to come down on a strong offer.
Risks & watch-outs
- Watch-outs: built in 1939 — expect roof / HVAC / electrical / plumbing capex.
- Climate carrying-cost: extreme-heat days projected 7→19/yr by 2055 (HVAC capex compounding) — expect insurance premiums to compound above CPI over the hold.
Questions for the listing agent
- Built in 1939 — when were the roof, HVAC, electrical panel, plumbing, and water heater last replaced?
- Is there a deadline driving the sale (1031 exchange, divorce, estate, relocation)? That informs how much negotiation room exists.
- What's the average days-on-market for RENTAL listings here right now (not sales)? A rising rental-DOM trend means longer vacancies and softer asking-rent achievability than the comps imply.
- What's the recent tenant-quality profile in this submarket — average credit score on applications, eviction rate, late-payment / NSF rate, and stable-employment percentage? A property-management company in the area should have these aggregated.
- How much new for-sale + rental construction is in the pipeline within 1–3 miles? Heavy new supply typically softens prices + rents 12–24 months out; constrained supply supports both.
Investment metrics
- 1% rule
- 0.83% ✗
- Cap rate
- 7.09%
- Cash-on-cash
- 2.84%
- DSCR
- 1.13
- GRM
- 10.1
CMA / ARV
- ARV (median comp)
- $136,976
- List price
- $115,000
- Delta
- -16.04%
- Verdict
- UNDERPRICED
- Comps
- 3 within 2.0 mi
Projected returns pro-forma
1.52% appreciation · 3.0% rent growth · sell at horizon
- IRR
- 5.9%
- Equity multiple
- 1.31×
- Total profit
- $9,883
- Equity at exit
- $42,391
- IRR
- 9.7%
- Equity multiple
- 2.24×
- Total profit
- $39,911
- Equity at exit
- $58,841
Cash invested: $32,200 (down + closing). Projections, not guarantees.
Landlord ↔ Tenant lean methodology
- Overall (STATE)
- 92 Strongly Landlord-Friendly
- State Arkansas
- 92 Strongly Landlord-Friendly · R+14
- County
- — inherits STATE
- City
- — inherits STATE
ZIP-level market 72045
- Home prices YoY
- 0.6%
- Active inventory
- 10
- Price-to-rent
- 10.1×
Monthly cashflow live
- Estimated rent
- $952 medium interval (Pro) →
- Mortgage (P&I)
- −$603
- Tax from tax record
- −$25 /mo · $300/yr
- Insurance
- −$48
- HOA
- −$0
- Vacancy / Maint / Mgmt
- −$200
- Net cashflow
- $76
Break-even live
Sensitivity live
| Price | -10% $141 | -5% $109 | +0% $76 | +5% $44 | +10% $11 |
|---|---|---|---|---|---|
| Rent | -10% $1 | -5% $39 | +0% $76 | +5% $114 | +10% $151 |
| Rate | -1.0pp $134 | -0.5pp $105 | base $76 | +0.5pp $46 | +1.0pp $16 |
UW: 25.0% down · 7.5% · 30yr · 1.5% tax · 5.0% vac · 8.0% maint · 8.0% mgmt
Financing live
Cash to close
- Down payment
- $28,750
- Closing costs
- $3,450
- Reserves months
- —
- Total cash needed
- —
Loan-product check · same deal, 3 products live
Conventional
25% down · 7.5% · 30yr
- Down + closing
- —
- Monthly P&I
- —
- Monthly cashflow
- —
- DSCR
- —
- Eligible?
- —
Personal DTI + credit; lowest rate.
DSCR
20% down · 8.5% · 30yr
- Down + closing
- —
- Monthly P&I
- —
- Monthly cashflow
- —
- DSCR
- —
- Eligible?
- —
No personal income docs; deal must DSCR.
Hard money
10% down · 12.0% · 12mo
- Down + closing
- —
- Monthly P&I
- —
- Monthly cashflow
- —
- DSCR
- —
- Eligible?
- —
Short-term bridge; refi at stabilization.
Listing history 27 events
-
2026-06-19days on market $115,000 Active 10 DOM
-
2026-06-18days on market $115,000 Active 9 DOM
-
2026-06-17days on market $115,000 Active 8 DOM
-
2026-06-16statusdays on market $115,000 Active 7 DOM
-
2026-06-15days on market $115,000 New Listing 6 DOM
-
2026-06-14days on market $115,000 New Listing 4 DOM
-
2026-06-12remarks 699-char remark
-
2026-06-12statusdays on market $115,000 New Listing 3 DOM
-
2026-05-31days on market $115,000 Active 150 DOM
-
2026-05-30days on market $115,000 Active 149 DOM
-
2026-05-14historical Take Backups 583-char remark
-
2026-04-22price $115,000 583-char remark
-
2026-01-01$120,000 New Listing 583-char remark
-
2025-12-01historical
-
2025-09-08status Back on Market
-
2025-08-30historical Take Backups
-
2025-08-13status Back on Market
-
2025-08-06historical Take Backups
-
2025-03-04$120,000 New Listing
-
2023-08-28soldstatus $45,000
-
2023-08-11soldstatus $45,000 Sold
-
2023-07-21$45,000
-
2023-07-21historical
-
2013-08-14soldstatus $22,000
-
2013-07-19historical
-
2013-03-11$29,950
-
2002-01-02soldstatus $10,000
ⓘ Source: listings_history table (triggers on properties + properties_extension) + one-shot
backfill from property_details.listing_events for pre-trigger history.
Tax reassessment forecast AR · Resets to sale price
- Current annual tax
- $300 · $25/mo
- Projected year-2 tax
- $736 · $61/mo
- Expected delta
- +$436/yr (+$36/mo · 145.0%)
ⓘ Screening estimate from a state-policy table — verify with the county assessor before closing.
Climate risk First Street
- Flood 1/10 Low FEMA zone X (unshaded) · 0% chance over 30 yrs
- Wildfire 4/10 Moderate
- Heat 6/10 Major 7 d/yr ≥110°F today · 19 d/yr by 30 yrs out
- Wind 3/10 Moderate 6% chance of damaging wind over 30 yrs
- Air quality 2/10 Low 1 unhealthy d/yr today · 1 by 30 yrs out
Nearby sold comps map
Loading sold comps map…
Walkable amenities ~0.75 mi
Loading nearby amenities…
Taxation est. · year 1
- Rental income
- $11,425
- − Mortgage interest
- −$6,442
- − Property taxes
- −$300
- − Insurance
- −$575
- − Repairs & maintenance
- −$914
- − Management
- −$914
- − Depreciation
- −$3,345
- Taxable loss
- −$1,066
- Est. tax savings @ 24.0%
- +$256
- After-tax cash flow
- $1,169/yr
For passive investors: Depreciation is non-cash, so a rental often shows a tax loss while cash-flowing — sheltering income. Rental losses are passive: they offset passive income freely, and up to $25,000/yr can offset ordinary (W-2) income if you actively participate and your MAGI is under $100k (phasing out to $0 by $150k); unused losses carry forward. On sale, claimed depreciation is recaptured at up to 25%, and gains may owe capital-gains tax (a 1031 exchange can defer both). Figures are a year-1 estimate at your 24.0% rate — not tax advice; consult a CPA.
Schools (NCES district)
- District
- Beebe School District
- NCES district ID
- 0502880
- Math proficiency
- 44% ▼ -10.00%
- Reading proficiency
- 36% ▼ -7.00%
- Median HH income
- $45,433
- Composite
- 34.1/100
- National rank
- #5293
- State rank
- #64 of 238 in AR
Livability — El Paso
No livability data for this city. (Only ~50 U.S. cities are tracked.)
Census & demographics
- Census place
- El Paso, AR
- Population (ZIP)
- 935
Population outlook (White County) Hauer SSP2
- Today (2025)
- 82,310 people
- By 2030
- 83,861 · +1.9%
- By 2040
- 86,492 · +5.1%
- By 2050
- 88,246 · +7.2%
- By 2075
- 91,307 · +10.9%
- By 2100
- 91,548 · +11.2%
Race, ethnicity, and origin ACS 2023
- Neighborhood character
- Predominantly White (90%)
- Race & ethnicity
- White 90% Two or more races 10% Hispanic / Latino 7%
- Hispanic origin (detail)
- Common ancestry
- Slovak 9% Lithuanian 2% Serbian 1%
- Foreign-born
- 1% · Canada
- Languages at home
- 95% English-only · Spanish 5%
Political lean MEDSL · White
- 2024 margin
- Solid R (+61.2) · D 18.3% · R 79.5% · Other 2.2%
- 2008→2024 swing
- -14.0pp toward R · 2008: -47.2pp · 2024: -61.2pp
- All cycles
- 2024: R+61.2 2020: R+58.9 2016: R+57.9 2012: R+53.7 2008: R+47.2
Not yet ingested
- Civics
- —
Market trends
- HPI YoY
- ▲ 1.52%
- Current HPI
- 260.3635
- Rent YoY
- —
- Metro
- —
- State GDP YoY
- ▲ 3.80%
- F500 in state
- 10
Industry mix (Fortune 500 HQ in AR)
| Industry | F500 HQs | Revenue |
|---|---|---|
| Retail | 1 | $681B |
|
||
| Food / Agriculture | 1 | $53B |
|
||
| Retail / Energy | 1 | $22B |
|
||
| Transportation / Logistics | 1 | $12B |
|
||
| Energy | 1 | $4B |
|
||
Price history
+1050.0% since first listed20 events — show timeline
- 2026-06-09 Listed $115,000 CARMLS
- 2026-06-01 Listing Removed — CARMLS
- 2026-05-22 Relisted — CARMLS
- 2026-05-14 Contingent — CARMLS
- 2026-04-22 Price Changed $115,000 CARMLS
- 2026-01-01 Listed $120,000 CARMLS
- 2025-12-01 Listing Removed — CARMLS
- 2025-09-08 Relisted — CARMLS
- 2025-08-30 Contingent — CARMLS
- 2025-08-13 Relisted — CARMLS
- 2025-08-06 Contingent — CARMLS
- 2025-03-04 Listed $120,000 CARMLS
- 2023-08-28 Sold (Public Records) $45,000 Public Records
- 2023-08-11 Sold (MLS) $45,000 CARMLS
- 2023-07-21 Listing Removed — CARMLS
- 2023-07-21 Listed $45,000 CARMLS
- 2013-08-14 Sold (MLS) $22,000 CARMLS
- 2013-07-19 Listing Removed — CARMLS
- 2013-03-11 Listed $29,950 CARMLS
- 2002-01-02 Sold (Public Records) $10,000 Public Records
Property tax history
+7.1%/yrLatest (2025): $300 · +0.0% YoY. Source: county tax records.
Cash-flow waterfall
monthlySold comps — $/sqft
last 12 mo · ≤1 miLoading sold comps…