 Duplex
18 Morton Ave · Rochester, NH
Flood risk 1/10 · Minimal
- FEMA flood zone
- X (unshaded)
- Chance of flooding over 30 yrs
- 0.0%
- Est. flood insurance / yr
- $473 – $860
Fire risk 1/10 · Minimal
- Est. fire insurance / yr
- $507 – $941
Heat risk 4/10 · Minor
- Hot days now (above 97°F)
- 7 days/yr
- Hot days in 30 yrs
- 15 days/yr
Wind risk 4/10 · Minor
- Chance of severe wind over 30 yrs
- 20.0%
Air-quality risk 2/10 · Minimal
- Unhealthy air days now
- 1 days/yr
- Unhealthy air days in 30 yrs
- 1 days/yr
Risk factors via First Street. Map © Google.
Why this score? — see what drove the C+ grade
The composite is a weighted blend of 9 inputs, each scored 0–100. Each bar is that input's sub-score; the figure is the points it added to the 100-point composite (weight × sub-score).
- Cash flow +28.8/30.0
- DSCR +10.0/10.0
- 1% rule +7.7/10.0
- Livability +4.2/5.0
- ARV discount +3.8/15.0
- Rent growth +3.6/5.0
- Schools +2.7/10.0
- Condition / age +2.5/5.0
- Appreciation +0.0/10.0
$340,000
🖨 Deal sheet 📄 Offer letter ✓ Due diligence
Multi-family units
County records classify this as Multi-Family (2-4 Unit). Listing-text estimate: 2 units. confirmed
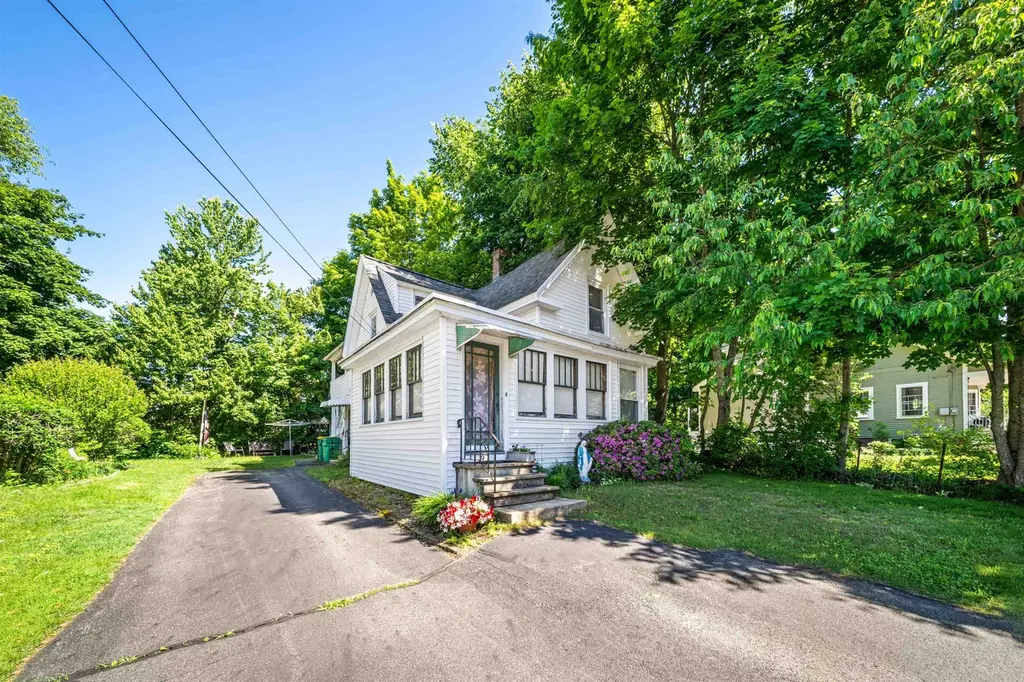
Listing remarks
This duplex is tucked away on a quiet dead-end street, offering a peaceful setting with the convenience of being just minutes from downtown Rochester's shops, restaurants, and local amenities. Whether you're looking to expand your investment portfolio or occupy one unit while generating rental income from the other, this property presents an excellent opportunity. The upper unit features 2 bedrooms and 1 bathroom, while the lower unit offers 1 bedroom, 1 bathroom and a fully enclosed sunroom. Attached to the duplex is a two-story barn, providing storage and currently accessible to both tenants. Outside, you'll find a yard with room for gardening and outdoor enjoyment. Recent improvements in
Key facts
- Newer roof
- Newer siding
- Two-story barn
Tags
Property features AI
Other
- Location: Located in Rochester, NH; Road frontage length reported (value excluded per instructions)
- Documents & disclosures: Aerials, association docs, deed, other documents, property disclosure, tax map available
Finance
- Other: Total units: 2; Total finished living area reported (value provided but excluded per instructions)
- Financial info: Property configured as a 2-unit multi-family with month-to-month leases
- HOA & community: No HOA information provided
Exterior
- Parking: Paved driveway
- Security: No security features provided
- Utilities: Public water; Public sewer; 100 Amp electric service with circuit breakers; Cable available; Trash service: curbside cans; Internet availability unknown
- Home design: Duplex; Existing structure built in 1902
- Construction: Wood frame construction with vinyl siding; Asphalt shingle roof; Year built 1902
- Exterior features: Landscaped, level lot; Near shopping and schools; Paved driveway; Road frontage on a paved public dead-end street
Interior
- Kitchen: No specific appliance details provided
- Bedrooms: One 1-bedroom unit on the first level; One 2-bedroom unit on the second level
- Flooring: No flooring information provided
- Bathrooms: Two full bathrooms total (one in each unit)
- Heating & cooling: Oil heating with radiators; No central cooling
- Interior features: Full unfinished basement with interior access
- Laundry & utility: No laundry or utility appliance details provided
Neighborhood map
What this means for you Summary
Snapshot
- This is a 2 × 3-bed/2.0-bath units multifamily listed at $340k.
Deal economics
- At list price, monthly cash flow is $1k ($14k/yr) — positive. Per door: $569/mo.
- The deal already cash-flows at list — no discount required.
- Meets the 1% rule at list price ($4k rent vs $340k).
- Cap rate 10.3% vs local median 3.6% in Rochester — top-decile yield for the area; either an underpriced asset or a hidden risk that comps aren't pricing in. Stress-test before assuming the spread holds.
Location & tenants
- Location reads 84/100 on livability (#8 in NH, #698 nationally) — a professional / high-income tenant draw. Strengths: crime A+, commute A+, cost of living A+; Watch: amenities C-.
- Rochester School District (suburban): math 27% / reading 35% proficiency, ranked #83 of 98 in NH (top 85%) — families likely to look elsewhere, expect single-tenant / working-renter base with shorter leases.
- Zoned schools: School Street School (math 30% / reading 50%, grade F, #155 of 263 statewide, top 62%, 66 students, 67% FRL) — zoned schools average 67% FRL vs 39% district-wide (28 pts higher); higher-poverty schools than district average — tighter screening recommended.
- Market conditions: Rents rising fast (+4.2%/yr); 108 active listings in the ZIP; 13 comparable units currently listed for rent nearby; rentals at typical pace (median 15d on market — plan ~3-4 weeks tenant-placement turnaround); solid renter incomes; 951 units permitted in Strafford County in 2024 (551 in 5+ unit buildings).
- At $4,315/mo this rent would consume 66% of the median local household income ($79k/yr) (locally 663% of renters already pay >50% of income on rent) — very limited rent-growth headroom before tenants either downsize or default.
Forward outlook
- Local home prices are declining (-3.0%/yr); year-one equity from $2k of loan paydown is wiped out by about $10k of value loss. Plan a longer hold.
- Strafford County population projected at +7% by 2050 — modest demand growth; plan on rents tracking national, not racing it.
- At projected returns (-3.0% appreciation + 4.2% rent growth), your $95k cash investment doubles in ~8 years — after that, you're playing with house money.
Negotiation context
- Only 7 days on market — expect competitive offers; lowballing is unlikely to land.
- Current owner paid $58k; list at $340k implies a 486% gain — meaningful room to come down on a strong offer.
Risks & watch-outs
- Watch-outs: built in 1902 — expect roof / HVAC / electrical / plumbing capex.
Questions for the listing agent
- Can we see the unit-by-unit rent roll, current vacancy, and any below-market leases? What's the average tenancy length?
- What capital expenditures (roof, boiler, parking lot, exteriors) have been made in the last 5 years, and what's planned in the next 2?
- Built in 1902 — when were the roof, HVAC, electrical panel, plumbing, and water heater last replaced?
- Is there a deadline driving the sale (1031 exchange, divorce, estate, relocation)? That informs how much negotiation room exists.
- What's the average days-on-market for RENTAL listings here right now (not sales)? A rising rental-DOM trend means longer vacancies and softer asking-rent achievability than the comps imply.
- What's the recent tenant-quality profile in this submarket — average credit score on applications, eviction rate, late-payment / NSF rate, and stable-employment percentage? A property-management company in the area should have these aggregated.
- How much new apartment / multifamily construction is in the pipeline within 1–3 miles? Heavy new supply (>2% of stock underway) typically softens rents 12–24 months out; light construction supports rent growth.
Investment metrics
- 1% rule
- 1.27% ✓
- Cap rate
- 10.31%
- Cash-on-cash
- 14.35%
- DSCR
- 1.64
- GRM
- 6.6
CMA / ARV
- ARV (on-the-fly)
- $313,984
- Comps found
- 1
Show comp detail 1 sale within ~0.75 mi
| Address | Dist | Beds/Ba | Sqft | Sold | Price | $/sf | Match |
|---|---|---|---|---|---|---|---|
| 43 River St | 0.65mi | 4/2.0 (+1) | 1,500 (+6%) | 11mo | $335,000 | $223 | 45 |
Match score weights: distance 35% · size 25% · config 20% · recency 20%. Top-matched comps best support the ARV.
Projected returns pro-forma
-3.0% appreciation · 4.22% rent growth · sell at horizon
- IRR
- 6.1%
- Equity multiple
- 1.24×
- Total profit
- $22,806
- Equity at exit
- $50,695
- IRR
- 16.5%
- Equity multiple
- 2.43×
- Total profit
- $135,863
- Equity at exit
- $29,397
Cash invested: $95,200 (down + closing). Projections, not guarantees.
Landlord ↔ Tenant lean methodology
- Overall (STATE)
- 56 Moderately Landlord-Leaning
- State New Hampshire
- 56 Moderately Landlord-Leaning · D+1
- County
- — inherits STATE
- City
- — inherits STATE
ZIP-level market 03867
- Home prices YoY
- -22.0%
- Rents YoY
- 4.2%
- Active inventory
- 108
- Price-to-rent
- 13.1×
Monthly cashflow live
- Estimated rent
- $4,315 medium interval (Pro) →
- Mortgage (P&I)
- −$1,783
- Tax from tax record
- −$346 /mo · $4,146/yr
- Insurance
- −$142
- HOA
- −$0
- Vacancy / Maint / Mgmt
- −$906
- Net cashflow
- $1,139
Break-even live
2-unit breakdown (identical units grouped — click to expand)
| Units | Beds | Baths | Est. rent |
|---|---|---|---|
| 2× units | 3 | 2 | $4,314 |
| #1 | 3 | 2 | $2,157 |
| #2 | 3 | 2 | $2,157 |
| Total (2 units) | $4,315 | ||
UW: 25.0% down · 7.5% · 30yr · 1.5% tax · 5.0% vac · 8.0% maint · 8.0% mgmt
Financing live
Cash to close
- Down payment
- $85,000
- Closing costs
- $10,200
- Reserves months
- —
- Total cash needed
- —
Loan-product check · same deal, 3 products live
Conventional
25% down · 7.5% · 30yr
- Down + closing
- —
- Monthly P&I
- —
- Monthly cashflow
- —
- DSCR
- —
- Eligible?
- —
Personal DTI + credit; lowest rate.
DSCR
20% down · 8.5% · 30yr
- Down + closing
- —
- Monthly P&I
- —
- Monthly cashflow
- —
- DSCR
- —
- Eligible?
- —
No personal income docs; deal must DSCR.
Hard money
10% down · 12.0% · 12mo
- Down + closing
- —
- Monthly P&I
- —
- Monthly cashflow
- —
- DSCR
- —
- Eligible?
- —
Short-term bridge; refi at stabilization.
Rent comps 13 comps
| Address | Beds | Baths | Sqft | Rent | $/sqft | DOM | Units | Dist |
|---|---|---|---|---|---|---|---|---|
| 12 Beaver Way Unit 101 Rochester, NH | 2.0 | 1.5 | 1375 | $2,000 | $1.45 | 23d | 1 | 0.62mi |
| 20 Fownes Mill Ct Rochester, NH | 2.0 | 2.0 | 1200 | $2,350 | $1.96 | 43d | 1 | 0.68mi |
| 20 Fownes Mill Ct Rochester, NH | 2.0 | 2.0 | 1200 | $2,300 | $1.92 | 24d | 1 | 0.68mi |
| 21 Knight St Unit 1 Rochester, NH | 3.0 | 1.0 | 900 | $2,300 | $2.56 | 5d | 1 | 0.69mi |
| 27 Knight St Unit 2 Rochester, NH | 3.0 | 1.0 | 1400 | $2,000 | $1.43 | 43d | 1 | 0.72mi |
| 28 Chestnut St Unit Upstairs Rochester, NH | 2.0 | 1.0 | 925 | $1,650 | $1.78 | 15d | 1 | 0.76mi |
| 58 Washington St Rochester, NH | 3.0 | 1.0 | 1120 | $2,300 | $2.05 | 5d | 1 | 1.04mi |
| 664 Columbus Ave Unit 205 Rochester, NH | 2.0 | 1.0 | 1000 | $2,000 | $2.00 | 18d | 1 | 1.29mi |
| 52 Woodland Grn Rochester, NH | 2.0 | 1.5 | 1048 | $2,350 | $2.24 | 5d | 1 | 1.38mi |
| 32 Emerson Ave Rochester, NH | 3.0 | 2.5 | 1525 | $3,350 | $2.20 | 1d | 7 | 1.41mi |
| 36 Hawthorne Way Unit F Rochester, NH | 3.0 | 2.5 | 1525 | $3,250 | $2.13 | 43d | 1 | 1.42mi |
| 36 Hawthorne Way Unit D Rochester, NH | 3.0 | 2.5 | 1525 | $3,250 | $2.13 | 4d | 1 | 1.42mi |
| 2 Townsend Ln Rochester, NH | 3.0 | 2.5 | 1600 | $2,350 | $1.47 | 1d | 1 | 1.48mi |
Listing history 7 events
-
2026-06-18days on market $340,000 Active 7 DOM
-
2026-06-17days on market $340,000 Active 6 DOM
-
2026-06-16days on market $340,000 Active 5 DOM
-
2026-06-15days on market $340,000 Active 4 DOM
-
2026-06-13days on market $340,000 Active 2 DOM
-
2026-06-13remarks 699-char remark
-
2026-06-13$340,000 Active 1 DOM
ⓘ Source: listings_history table (triggers on properties + properties_extension) + one-shot
backfill from property_details.listing_events for pre-trigger history.
Tax reassessment forecast NH · Partial reset (capped growth)
- Current annual tax
- $4,146 · $346/mo
- Projected year-2 tax
- $5,779 · $482/mo
- Expected delta
- +$1,633/yr (+$136/mo · 39.4%)
ⓘ Screening estimate from a state-policy table — verify with the county assessor before closing.
Climate risk First Street
- Flood 1/10 Low FEMA zone X (unshaded) · 0% chance over 30 yrs
- Wildfire 1/10 Low
- Heat 4/10 Moderate 7 d/yr ≥97°F today · 15 d/yr by 30 yrs out
- Wind 4/10 Moderate 20% chance of damaging wind over 30 yrs
- Air quality 2/10 Low 1 unhealthy d/yr today · 1 by 30 yrs out
Nearby sold comps map
Loading sold comps map…
Walkable amenities ~0.75 mi
Loading nearby amenities…
Taxation est. · year 1
- Rental income
- $51,780
- − Mortgage interest
- −$19,045
- − Property taxes
- −$4,146
- − Insurance
- −$1,700
- − Repairs & maintenance
- −$4,142
- − Management
- −$4,142
- − Depreciation
- −$9,891
- Taxable income
- $8,713
- Est. tax owed @ 24.0%
- −$2,091
- After-tax cash flow
- $11,573/yr
For passive investors: Depreciation is non-cash, so a rental often shows a tax loss while cash-flowing — sheltering income. Rental losses are passive: they offset passive income freely, and up to $25,000/yr can offset ordinary (W-2) income if you actively participate and your MAGI is under $100k (phasing out to $0 by $150k); unused losses carry forward. On sale, claimed depreciation is recaptured at up to 25%, and gains may owe capital-gains tax (a 1031 exchange can defer both). Figures are a year-1 estimate at your 24.0% rate — not tax advice; consult a CPA.
Schools (NCES district)
- District
- Rochester School District
- NCES district ID
- 3305940
- Math proficiency
- 27% ▼ -15.00%
- Reading proficiency
- 35% ▼ -14.00%
- Median HH income
- $51,080
- Composite
- 27.11/100
- National rank
- #7039
- State rank
- #83 of 98 in NH
Livability — Rochester
- Score
- 84/100
- State rank
- #8
- US rank
- #698
Category grades
Schools grade is shown separately in the Schools card above.
Census & demographics
- Census place
- Rochester, NH
- County
- Strafford County · 75,181 people
- City population
- 22,732
- Metro
- Boston-Cambridge-Newton, MA-NH
- Population (ZIP)
- 22,732
- Household income
- $78,674
- Rent vs Own
- Severe rent burden
- 663.0
Population outlook (Strafford County) Hauer SSP2
- Today (2025)
- 132,503 people
- By 2030
- 135,377 · +2.2%
- By 2040
- 139,609 · +5.4%
- By 2050
- 141,803 · +7.0%
- By 2075
- 149,280 · +12.7%
- By 2100
- 148,667 · +12.2%
Race, ethnicity, and origin ACS 2023
- Neighborhood character
- Predominantly White (93%)
- Race & ethnicity
- White 93% Two or more races 4% Hispanic / Latino 2% Asian 1%
- Common ancestry
- Lithuanian 12% Romanian 2% Serbian 2%
- Foreign-born
- 3% · Canada
- Languages at home
- 96% English-only · Spanish 1% French/Haitian/Cajun 1%
Political lean MEDSL · Strafford
- 2024 margin
- D (+12.1) · D 55.5% · R 43.5% · Other 1.0%
- 2008→2024 swing
- -8.3pp toward R · 2008: 20.4pp · 2024: 12.1pp
- All cycles
- 2024: D+12.1 2020: D+15.2 2016: D+8.6 2012: D+14.5 2008: D+20.4
Not yet ingested
- Civics
- —
Market trends
- HPI YoY
- ▼ -107.34%
- Current HPI
- 379.5755
- Rent YoY
- ▲ 4.22%
- Metro
- Boston-Cambridge-Newton, MA-NH
- State GDP YoY
- —
- F500 in state
- 0
Price history
+486.2% since first listed2 events — show timeline
- 2026-06-11 Listed $340,000 PrimeMLS
- 2000-05-30 Sold (Public Records) $58,000 Public Records
Property tax history
+3.0%/yrLatest (2025): $4,146 · +3.0% YoY. Source: county tax records.
Cash-flow waterfall
monthlySold comps — $/sqft
last 12 mo · ≤1 miLoading sold comps…