 6-Plex
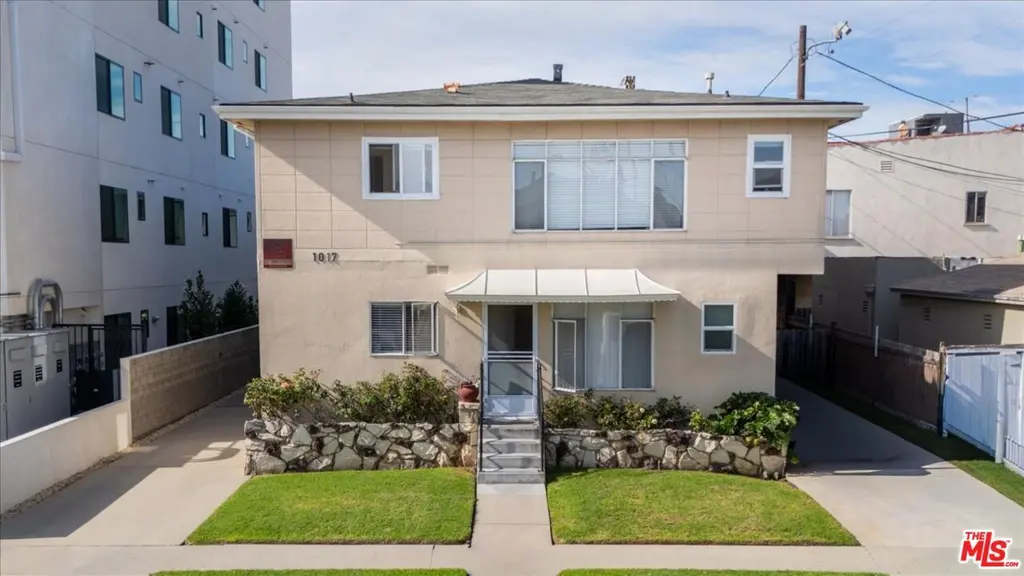
1017 S Shenandoah St · Los Angeles, CA
Flood risk 1/10 · Minimal
- FEMA flood zone
- X (unshaded)
- Chance of flooding over 30 yrs
- 0.0%
- Est. flood insurance / yr
- $507 – $1,088
Fire risk 1/10 · Minimal
- Est. fire insurance / yr
- $659 – $1,223
Heat risk 6/10 · Moderate
- Hot days now (above 88°F)
- 7 days/yr
- Hot days in 30 yrs
- 21 days/yr
Wind risk 1/10 · Minimal
- Chance of severe wind over 30 yrs
- —
Air-quality risk 5/10 · Moderate
- Unhealthy air days now
- 7 days/yr
- Unhealthy air days in 30 yrs
- 7 days/yr
Risk factors via First Street. Map © Google.
Why this score? — see what drove the D grade
The composite is a weighted blend of 9 inputs, each scored 0–100. Each bar is that input's sub-score; the figure is the points it added to the 100-point composite (weight × sub-score).
- ARV discount +10.8/15.0
- Cash flow +9.5/30.0
- Appreciation +6.4/10.0
- Schools +3.6/10.0
- Livability +3.4/5.0
- 1% rule +2.9/10.0
- DSCR +2.7/10.0
- Condition / age +2.5/5.0
- Rent growth +2.1/5.0
$1,995,000
🖨 Deal sheet (PDF) 📄 Offer letter ✓ Due diligence
Multi-family units
County records classify this as Multi-Family (5+ Unit). Listing-text estimate: 6 units. confirmed
5+ unit building — per-unit beds/baths from public records are typically unavailable; the breakdown below (if shown) is an estimate from the listing text.
Listing remarks MLS
Discover 1017 S Shenandoah St, a charming 6-unit multifamily building in Pico-Robertson. This well-maintained property offers a diverse unit mix, including one studio, three 1-bedroom units, one 2-bedroom unit, and one spacious 3-bedroom unit, all fully occupied. Situated in a vibrant neighborhood, residents enjoy proximity to amenities like restaurants, coffee shops, and grocery stores. Nearby attractions such as La Cienega Park and the Beverly Center offer recreation and shopping options. The property's strategic location provides easy access to major freeways, ensuring seamless commutes. Constructed in 1955 on a 6,010 square foot lot, it combines timeless charm with modern conveniences. Investors will benefit from stable cash flow and the potential for future appreciation in this thriving area. Don't miss this opportunity to own a piece of Los Angeles real estate in a prime location known for its community feel and urban conveniences.
Key facts
- Nearby attractions
- Modern conveniences
- Multifamily building
Tags
Neighborhood map
What this means for you Summary
Snapshot
- This is a 6 × 1-bed/1-bath units multifamily listed at $2.00M.
Deal economics
- At list price, monthly cash flow is $-1k ($-17k/yr) — negative. Per door: $-232/mo.
- To cash-flow at today's rent, offer at most $1.79M (10.1% below list).
- To meet the 1% rule (rent ≥ 1% of price), the offer needs to be $1.57M (21.3% below list).
- Recommended offer: $1.57M (21.3% below list) — sets the bar for 1% rule.
- Cap rate 5.5% vs local median 2.1% in Los Angeles — top-decile yield for the area; either an underpriced asset or a hidden risk that comps aren't pricing in. Stress-test before assuming the spread holds.
Location & tenants
- Location reads 68/100 on livability (#273 in CA) — a middle-class / working-renter tenant base. Strengths: amenities A+, commute A+, employment B; Watch: health & safety C-, crime F, cost of living F.
- Los Angeles Unified (urban): math 29% / reading 54% proficiency, ranked #223 of 517 in CA (top 43%) — families likely to look elsewhere, expect single-tenant / working-renter base with shorter leases; 67% free/reduced lunch — lower-income household profile, screen leases tightly.
- Zoned schools: Carthay Elementary of Environmental Studies Magnet (323 students, 66% FRL); Emerson Community Charter (492 students, 51% FRL, charter); Fairfax Senior High (math 40% / reading 61%, grade D+, #324 of 1,170 statewide, top 28%, 1,632 students, 81% FRL) — zoned schools at 66% FRL track the district average.
- Market conditions: Rents soft (-1.6%/yr); 108 active listings in the ZIP; 13 comparable units currently listed for rent nearby; rentals at typical pace (median 26d on market — plan ~3-4 weeks tenant-placement turnaround); 46% of comp listings sitting > 30 days — soft ceiling on asking rent; solid renter incomes; 19,697 units permitted in Los Angeles County in 2024 (9,426 in 5+ unit buildings).
- At $15,691/mo this rent would consume 179% of the median local household income ($105k/yr) (locally 2317% of renters already pay >50% of income on rent) — very limited rent-growth headroom before tenants either downsize or default.
Forward outlook
- In year one you build about $68k of equity ($14k loan paydown + $54k appreciation (2.7% local appreciation)).
- Los Angeles County population projected at +9% by 2050 — modest demand growth; plan on rents tracking national, not racing it.
- By year 3, paydown + projected appreciation supports a ~$170k cash-out refi (75% LTV) — recoverable capital for the next deal without selling this one.
Negotiation context
- It's been on market 130 days — a 12% lower offer ($1.76M) is reasonable based on typical stale-listing flexibility.
Risks & watch-outs
- Watch-outs: built in 1955 — expect roof / HVAC / electrical / plumbing capex.
- Climate carrying-cost: extreme-heat days projected 7→21/yr by 2055 (HVAC capex compounding) — expect insurance premiums to compound above CPI over the hold.
Questions for the listing agent
- What do current leases actually rent for vs. the listed asking? Can we see a recent rent roll and the last 12 months of T-12 income?
- It's been on market 130 days. Have you received any prior offers? Is the seller open to a 21% concession, seller financing, or rate buy-down credit?
- Can we see the unit-by-unit rent roll, current vacancy, and any below-market leases? What's the average tenancy length?
- What capital expenditures (roof, boiler, parking lot, exteriors) have been made in the last 5 years, and what's planned in the next 2?
- Built in 1955 — when were the roof, HVAC, electrical panel, plumbing, and water heater last replaced?
- Why hasn't it sold? Are there any deal-killer items the seller is aware of (foundation, flood, title, zoning, code violations)?
- Is there a deadline driving the sale (1031 exchange, divorce, estate, relocation)? That informs how much negotiation room exists.
- Schools are D-rated, which usually means shorter tenancies and higher turnover. Who's the typical renter profile here, and what's been the actual vacancy rate?
- Crime grade is F in this area — have there been break-ins, vandalism, or insurance claims at this property in the last 3 years? What carrier currently insures it and at what premium?
- The area grade is low — what's the realistic commute time and amenity access for the typical tenant pool here? Any planned neighborhood developments (good or bad) we should know about?
- What's the average days-on-market for RENTAL listings here right now (not sales)? A rising rental-DOM trend means longer vacancies and softer asking-rent achievability than the comps imply.
- What's the recent tenant-quality profile in this submarket — average credit score on applications, eviction rate, late-payment / NSF rate, and stable-employment percentage? A property-management company in the area should have these aggregated.
- How much new apartment / multifamily construction is in the pipeline within 1–3 miles? Heavy new supply (>2% of stock underway) typically softens rents 12–24 months out; light construction supports rent growth.
Investment metrics
- 1% rule
- 0.79% ✗
- Cap rate
- 5.46%
- Cash-on-cash
- -2.99%
- DSCR
- 0.87
- GRM
- 10.6
CMA / ARV
- ARV (median comp)
- $2,152,364
- List price
- $1,995,000
- Delta
- -7.31%
- Verdict
- FAIR
- Comps
- 20 within 1.0 mi
Show comp detail 11 sales within ~0.75 mi
| Address | Dist | Beds/Ba | Sqft | Sold | Price | $/sf | Match |
|---|---|---|---|---|---|---|---|
| 1026 S Shenandoah St | 0.04mi | 8/8.0 (+1) | 5,294 (+5%) | 8mo | $2,152,000 | $406 | 74 |
| 1111 S Holt Ave | 0.22mi | 7/7.0 | 4,630 (-8%) | 6mo | $1,785,000 | $386 | 70 |
| 8701 W Olympic Blvd | 0.06mi | 8/4.0 (+1) | 4,681 (-7%) | 10mo | $1,960,000 | $419 | 60 |
| 6120 Packard St | 0.51mi | 7/7.0 | 4,864 (-4%) | 22mo | $1,730,625 | $356 | 52 |
| 1200 S Alfred St | 0.48mi | 6/4.0 (-1) | 4,814 (-5%) | 2mo | $2,278,950 | $473 | 51 |
| 439 S Palm Dr | 0.60mi | 8/6.0 (+1) | 5,620 (+11%) | 5mo | $2,968,000 | $528 | 40 |
| 419 S Rexford Dr | 0.71mi | 8/8.0 (+1) | 5,511 (+9%) | 3mo | $3,995,000 | $725 | 40 |
| 1437 Cardiff Ave | 0.69mi | 8/9.0 (+1) | 4,982 (-2%) | 21mo | $3,500,000 | $703 | 35 |
| 215 S Gale Dr | 0.55mi | 8/4.0 (+1) | 4,656 (-8%) | 12mo | $2,226,000 | $478 | 34 |
| 6107 Alcott St | 0.62mi | 6/5.0 (-1) | 5,550 (+10%) | 18mo | $1,500,000 | $270 | 27 |
| 128 S Oakhurst Dr | 0.71mi | 8/6.0 (+1) | 5,532 (+9%) | 20mo | $3,018,260 | $546 | 26 |
Match score weights: distance 35% · size 25% · config 20% · recency 20%. Top-matched comps best support the ARV.
Projected returns pro-forma
2.72% appreciation · 0.0% rent growth · sell at horizon
- IRR
- 2.4%
- Equity multiple
- 1.14×
- Total profit
- $76,277
- Equity at exit
- $865,440
- IRR
- 4.8%
- Equity multiple
- 1.68×
- Total profit
- $379,633
- Equity at exit
- $1,309,682
Cash invested: $558,600 (down + closing). Projections, not guarantees.
Landlord ↔ Tenant lean methodology
- Overall (CITY)
- 0 Strongly Tenant-Friendly
- State California
- 18 Strongly Tenant-Friendly · D+13
- County
- — inherits STATE
- City Los Angeles
- 0 Strongly Tenant-Friendly · D+22
ZIP-level market 90035
- Home prices YoY
- 0.7%
- Rents YoY
- -1.6%
- Active inventory
- 108
- Price-to-rent
- 63.6×
Monthly cashflow live
- Estimated rent
- $15,691 high interval (Pro) →
- Mortgage (P&I)
- −$10,462
- Tax est. 1.5%
- −$2,494 /mo · $29,925/yr
- Insurance
- −$831
- HOA
- −$0
- Vacancy / Maint / Mgmt
- −$3,295
- Net cashflow
- $-1,391
Break-even live
Sensitivity live
| Price | -10% $-12 | -5% $-702 | +0% $-1,391 | +5% $-2,080 | +10% $-2,770 |
|---|---|---|---|---|---|
| Rent | -10% $-2,631 | -5% $-2,011 | +0% $-1,391 | +5% $-771 | +10% $-152 |
| Rate | -1.0pp $-386 | -0.5pp $-884 | base $-1,391 | +0.5pp $-1,908 | +1.0pp $-2,434 |
6-unit breakdown (identical units grouped — click to expand)
| Units | Beds | Baths | Est. rent |
|---|---|---|---|
| 6× units | 1 | 1 | $15,690 |
| #1 | 1 | 1 | $2,615 |
| #2 | 1 | 1 | $2,615 |
| #3 | 1 | 1 | $2,615 |
| #4 | 1 | 1 | $2,615 |
| #5 | 1 | 1 | $2,615 |
| #6 | 1 | 1 | $2,615 |
| Total (6 units) | $15,691 | ||
UW: 25.0% down · 7.5% · 30yr · 1.5% tax · 5.0% vac · 8.0% maint · 8.0% mgmt
Financing live
Cash to close
- Down payment
- $498,750
- Closing costs
- $59,850
- Reserves months
- —
- Total cash needed
- —
Loan-product check · same deal, 3 products live
Conventional
25% down · 7.5% · 30yr
- Down + closing
- —
- Monthly P&I
- —
- Monthly cashflow
- —
- DSCR
- —
- Eligible?
- —
Personal DTI + credit; lowest rate.
DSCR
20% down · 8.5% · 30yr
- Down + closing
- —
- Monthly P&I
- —
- Monthly cashflow
- —
- DSCR
- —
- Eligible?
- —
No personal income docs; deal must DSCR.
Hard money
10% down · 12.0% · 12mo
- Down + closing
- —
- Monthly P&I
- —
- Monthly cashflow
- —
- DSCR
- —
- Eligible?
- —
Short-term bridge; refi at stabilization.
Rent comps 13 comps
| Address | Beds | Baths | Sqft | Rent | $/sqft | DOM | Units | Dist |
|---|---|---|---|---|---|---|---|---|
| 332 S Almont Dr Beverly Hills, CA | 6.0 | 7.5 | 6040 | $18,000 | $2.98 | 45d | 1 | 0.34mi |
| 1510 Cardiff Ave Los Angeles, CA | 7.0 | 5.5 | 4747 | $19,000 | $4.00 | 9d | 1 | 0.73mi |
| 137 S Rexford Dr Unit 1 Beverly Hills, CA | 6.0 | 5.0 | 3500 | $15,900 | $4.54 | 26d | 1 | 0.84mi |
| 9033 Cresta Dr Los Angeles, CA | 6.0 | 5.5 | 5500 | $16,500 | $3.00 | 45d | 1 | 0.93mi |
| 9033 Cresta Dr Los Angeles, CA | 6.0 | 5.5 | 5500 | $18,000 | $3.27 | 4d | 1 | 0.93mi |
| 1170 Beverwil Dr Los Angeles, CA | 6.0 | 5.5 | 3581 | $12,995 | $3.63 | 45d | 1 | 0.98mi |
| 1170 Beverwil Dr Los Angeles, CA | 6.0 | 5.5 | 3581 | $11,995 | $3.35 | 26d | 1 | 0.98mi |
| 9500 Sawyer St Los Angeles, CA | 7.0 | 4.5 | 3554 | $17,500 | $4.92 | 3d | 1 | 1.20mi |
| 2122 Castle Heights Ave Los Angeles, CA | 6.0 | 6.0 | 4555 | $19,950 | $4.38 | 45d | 1 | 1.36mi |
| 2122 Castle Heights Ave Los Angeles, CA | 6.0 | 5.0 | 4555 | $19,950 | $4.38 | 0d | 1 | 1.36mi |
| 2122 Castle Heights Ave Los Angeles, CA | 6.0 | 5.5 | 4192 | $18,995 | $4.53 | 26d | 1 | 1.36mi |
| 346 N Kings Rd Los Angeles, CA | 6.0 | 7.0 | 4500 | $22,950 | $5.10 | 45d | 1 | 1.40mi |
| 2408 Castle Heights Ave Los Angeles, CA | 6.0 | 6.5 | 5800 | $24,950 | $4.30 | 45d | 1 | 1.46mi |
Listing history 15 events
-
2026-06-21days on market $1,995,000 Active 130 DOM
-
2026-06-18days on market $1,995,000 Active 127 DOM
-
2026-06-17days on market $1,995,000 Active 126 DOM
-
2026-06-16days on market $1,995,000 Active 125 DOM
-
2026-06-15days on market $1,995,000 Active 124 DOM
-
2026-06-13days on market $1,995,000 Active 122 DOM
-
2026-06-09days on market $1,995,000 Active 118 DOM
-
2026-06-08days on market $1,995,000 Active 117 DOM
-
2026-06-07days on market $1,995,000 Active 116 DOM
-
2026-06-04days on market $1,995,000 Active 113 DOM
-
2026-06-03days on market $1,995,000 Active 112 DOM
-
2026-06-02days on market $1,995,000 Active 111 DOM
-
2026-06-01days on market $1,995,000 Active 110 DOM
-
2026-05-31days on market $1,995,000 Active 109 DOM
-
2026-02-11$1,995,000 Active 951-char remark
Show marketing remark (951 chars)
Discover 1017 S Shenandoah St, a charming 6-unit multifamily building in Pico-Robertson. This well-maintained property offers a diverse unit mix, including one studio, three 1-bedroom units, one 2-bedroom unit, and one spacious 3-bedroom unit, all fully occupied. Situated in a vibrant neighborhood, residents enjoy proximity to amenities like restaurants, coffee shops, and grocery stores. Nearby attractions such as La Cienega Park and the Beverly Center offer recreation and shopping options. The property's strategic location provides easy access to major freeways, ensuring seamless commutes. Constructed in 1955 on a 6,010 square foot lot, it combines timeless charm with modern conveniences. Investors will benefit from stable cash flow and the potential for future appreciation in this thriving area. Don't miss this opportunity to own a piece of Los Angeles real estate in a prime location known for its community feel and urban conveniences.
ⓘ Source: listings_history table (triggers on properties + properties_extension) + one-shot
backfill from property_details.listing_events for pre-trigger history.
Climate risk First Street
- Flood 1/10 Low FEMA zone X (unshaded) · 0% chance over 30 yrs
- Wildfire 1/10 Low
- Heat 6/10 Major 7 d/yr ≥88°F today · 21 d/yr by 30 yrs out
- Wind 1/10 Low
- Air quality 5/10 Major 7 unhealthy d/yr today · 7 by 30 yrs out
Nearby sold comps map
Loading sold comps map…
Walkable amenities ~0.75 mi
Loading nearby amenities…
Taxation est. · year 1
- Rental income
- $188,292
- − Mortgage interest
- −$111,751
- − Property taxes
- −$29,925
- − Insurance
- −$9,975
- − Repairs & maintenance
- −$15,063
- − Management
- −$15,063
- − Depreciation
- −$58,036
- Taxable loss
- −$51,522
- Est. tax savings @ 24.0%
- +$12,365
- After-tax cash flow
- $-4,328/yr
For passive investors: Depreciation is non-cash, so a rental often shows a tax loss while cash-flowing — sheltering income. Rental losses are passive: they offset passive income freely, and up to $25,000/yr can offset ordinary (W-2) income if you actively participate and your MAGI is under $100k (phasing out to $0 by $150k); unused losses carry forward. On sale, claimed depreciation is recaptured at up to 25%, and gains may owe capital-gains tax (a 1031 exchange can defer both). Figures are a year-1 estimate at your 24.0% rate — not tax advice; consult a CPA.
Schools (NCES district)
- District
- Los Angeles Unified
- NCES district ID
- 0622710
- Math proficiency
- 29% ▼ -4.00%
- Reading proficiency
- 54% ▲ 10.00%
- Median HH income
- $50,403
- Composite
- 35.67/100
- National rank
- #4875
- State rank
- #223 of 517 in CA
Livability — Los Angeles
- Score
- 68/100
- State rank
- #273
- US rank
- #9237
Category grades
Schools grade is shown separately in the Schools card above.
Census & demographics
- Census place
- Los Angeles, CA
- County
- Los Angeles County · 9,444,647 people
- City population
- 3,838,149
- Metro
- Los Angeles-Long Beach-Anaheim, CA
- Population (ZIP)
- 29,000
- Household income
- $105,013
- Rent vs Own
- Severe rent burden
- 2317.0
Population outlook (Los Angeles County) Hauer SSP2
- Today (2025)
- 10,940,515 people
- By 2030
- 11,256,481 · +2.9%
- By 2040
- 11,729,929 · +7.2%
- By 2050
- 11,948,407 · +9.2%
- By 2075
- 11,818,114 · +8.0%
- By 2100
- 10,842,928 · -0.9%
Race, ethnicity, and origin ACS 2023
- Neighborhood character
- Diverse neighborhood (Simpson 0.57)
- Race & ethnicity
- White 64% Hispanic / Latino 14% Two or more races 11% Asian 7% Black 7%
- Hispanic origin (detail)
- Mexican 7% Cuban 1%
- Common ancestry
- Scotch-Irish 4% Italian 3% Romanian 3%
- Foreign-born
- 21% · Canada, China, South Korea
- Languages at home
- 72% English-only · Other Indo-European 8% Spanish 7% Russian/Polish/Slavic 1%
Political lean MEDSL · Los Angeles
- 2024 margin
- Solid D (+32.9) · D 64.8% · R 31.9% · Other 3.3%
- 2008→2024 swing
- -7.4pp toward R · 2008: 40.4pp · 2024: 32.9pp
- All cycles
- 2024: D+32.9 2020: D+44.2 2016: D+48.0 2012: D+40.0 2008: D+40.4
Not yet ingested
- Civics
- —
Market trends
- HPI YoY
- ▲ 2.72%
- Current HPI
- 394.903
- Rent YoY
- ▼ -1.60%
- Metro
- Los Angeles-Long Beach-Anaheim, CA
- State GDP YoY
- ▲ 3.21%
- F500 in state
- 116
Industry mix (Fortune 500 HQ in CA)
| Industry | F500 HQs | Revenue |
|---|---|---|
| Technology | 27 | $1,492B |
|
||
| Financial Services | 3 | $174B |
|
||
| Retail | 3 | $44B |
|
||
| Insurance | 3 | $26B |
|
||
| Media / Entertainment | 2 | $115B |
|
||
| Pharmaceuticals / Biotech | 2 | $62B |
|
||
Price history
1 event — show timeline
- 2026-02-11 Listed $1,995,000 TheMLS
Property tax history
+1.8%/yrLatest (2025): $3,394 · +3.1% YoY. Source: county tax records.
Cash-flow waterfall
monthlySold comps — $/sqft
last 12 mo · ≤1 miLoading sold comps…