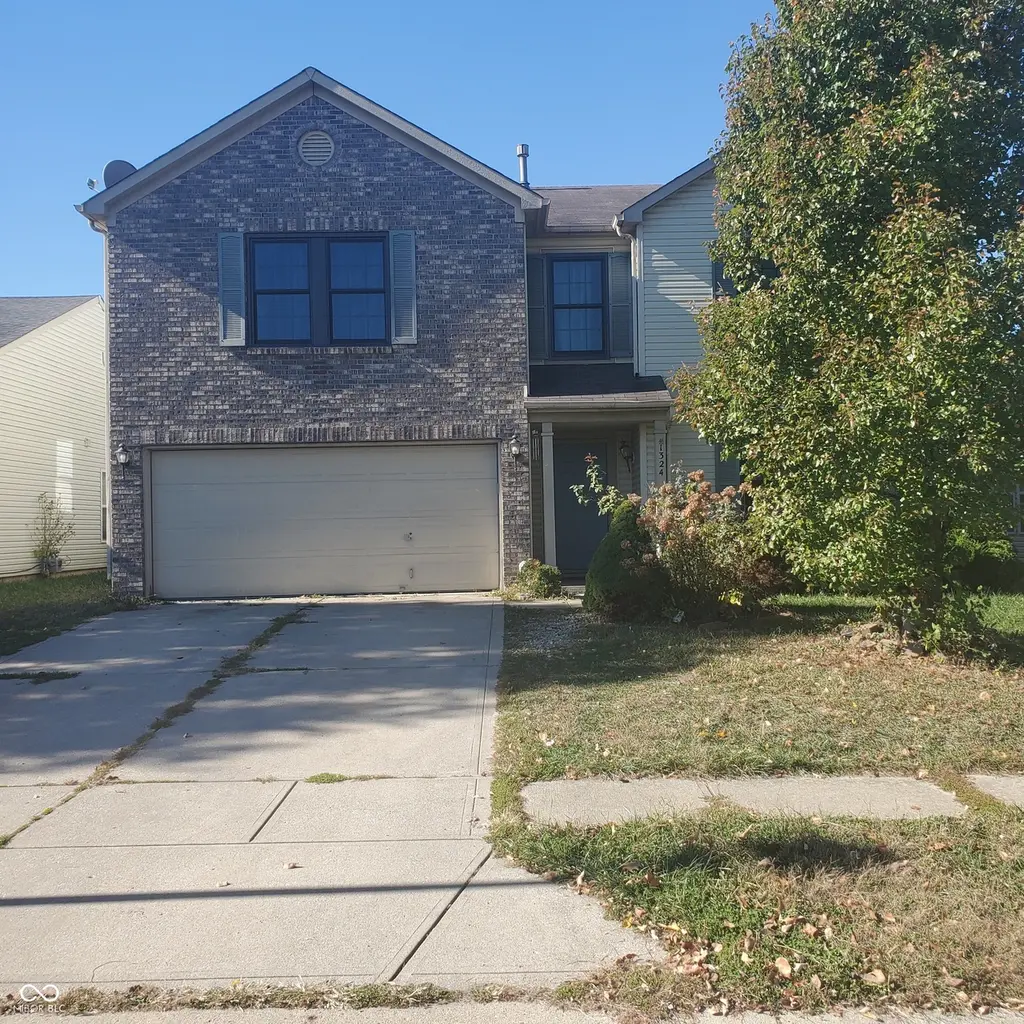
1324 Castleford Ln · Avon, IN
Flood risk 1/10 · Minimal
- FEMA flood zone
- X (unshaded)
- Chance of flooding over 30 yrs
- 0.0%
- Est. flood insurance / yr
- $507 – $1,088
Fire risk 1/10 · Minimal
- Est. fire insurance / yr
- $717 – $1,331
Heat risk 3/10 · Minor
- Hot days now (above 101°F)
- 7 days/yr
- Hot days in 30 yrs
- 19 days/yr
Wind risk 2/10 · Minimal
- Chance of severe wind over 30 yrs
- 0.0%
Air-quality risk 4/10 · Minor
- Unhealthy air days now
- 4 days/yr
- Unhealthy air days in 30 yrs
- 5 days/yr
Risk factors via First Street. Map © Google.
Why this score? — see what drove the D- grade
The composite is a weighted blend of 9 inputs, each scored 0–100. Each bar is that input's sub-score; the figure is the points it added to the 100-point composite (weight × sub-score).
- Cash flow +12.7/30.0
- ARV discount +5.1/15.0
- Schools +4.7/10.0
- Rent growth +4.4/5.0
- DSCR +3.8/10.0
- Livability +3.7/5.0
- 1% rule +3.1/10.0
- Condition / age +2.5/5.0
- Appreciation +0.0/10.0
$349,900
🖨 Deal sheet 📄 Offer letter ✓ Due diligence
Listing remarks MLS
This wonderful 4 bedroom home in one of the best school districts with room for the growing family. Home has 2.5 bathrooms, fireplace in the family room for cozy evenings. Home comes with new updated Anderson windows, hardwood floors thru out. Close to interstate and shopping areas. Garage has 2 car spaces. Home comes with 1 yr home warranty for your peacde of mind.
Key facts
- Close to interstate
- Hardwood floors
- 6,098 sq ft lot
Tags
Neighborhood map
What this means for you Summary
Snapshot
- This is a 3-bed/2.5-bath single-family listed at $350k.
Deal economics
- At list price, monthly cash flow is $-38 ($-455/yr) — negative.
- To cash-flow at today's rent, offer at most $343k (1.9% below list).
- To meet the 1% rule (rent ≥ 1% of price), the offer needs to be $283k (19.0% below list).
- Recommended offer: $283k (19.0% below list) — sets the bar for 1% rule.
- Cap rate 6.2% vs local median 3.8% in Avon — top-decile yield for the area; either an underpriced asset or a hidden risk that comps aren't pricing in. Stress-test before assuming the spread holds.
Location & tenants
- Location reads 74/100 on livability (#75 in IN, #4,686 nationally) — a middle-class / working-renter tenant base. Strengths: employment A+, cost of living A+, housing A+; Watch: amenities F, commute F.
- Avon Community School Corporation (suburban): math 51% / reading 53% proficiency, ranked #32 of 301 in IN (top 11%) — acceptable for families but not a draw, mixed tenant base, ~2y average lease; only 20% free/reduced lunch — higher-income household profile.
- Market conditions: Rents rising fast (+7.6%/yr); 64 active listings in the ZIP; 7 comparable units currently listed for rent nearby; rentals at typical pace (median 24d on market — plan ~3-4 weeks tenant-placement turnaround); solid renter incomes; 1,294 units permitted in Hendricks County in 2024 (18 in 5+ unit buildings).
- This rent runs 41% of the median local income ($83k/yr) — at the standard rent-burdened threshold; future hikes will face affordability resistance.
Forward outlook
- Local home prices are declining (-3.0%/yr); year-one equity from $2k of loan paydown is wiped out by about $10k of value loss. Plan a longer hold.
- Hendricks County population projected at +35% by 2050 — long-run rental-demand tailwind backs the buy-and-hold thesis.
Negotiation context
- It's been on market 223 days — a 12% lower offer ($308k) is reasonable based on typical stale-listing flexibility.
- 2 sale attempts since 14y ago; this cycle's ask has dropped $30k (8%) from the opening price — seller is motivated, your offer sets the floor, not the list.
- Current owner paid $100k; list at $350k implies a 250% gain — meaningful room to come down on a strong offer.
Questions for the listing agent
- What do current leases actually rent for vs. the listed asking? Can we see a recent rent roll and the last 12 months of T-12 income?
- It's been on market 223 days. Have you received any prior offers? Is the seller open to a 19% concession, seller financing, or rate buy-down credit?
- What does the HOA fee cover, when was the last increase, and are there any pending special assessments or reserve-fund shortfalls?
- Why hasn't it sold? Are there any deal-killer items the seller is aware of (foundation, flood, title, zoning, code violations)?
- Is there a deadline driving the sale (1031 exchange, divorce, estate, relocation)? That informs how much negotiation room exists.
- Schools are A-rated — typically a magnet for longer-tenancy family renters. What's the average tenant stay here, and is there a school-zone premium baked into asking?
- The area grade is low — what's the realistic commute time and amenity access for the typical tenant pool here? Any planned neighborhood developments (good or bad) we should know about?
- What's the average days-on-market for RENTAL listings here right now (not sales)? A rising rental-DOM trend means longer vacancies and softer asking-rent achievability than the comps imply.
- What's the recent tenant-quality profile in this submarket — average credit score on applications, eviction rate, late-payment / NSF rate, and stable-employment percentage? A property-management company in the area should have these aggregated.
- How much new for-sale + rental construction is in the pipeline within 1–3 miles? Heavy new supply typically softens prices + rents 12–24 months out; constrained supply supports both.
Investment metrics
- 1% rule
- 0.81% ✗
- Cap rate
- 6.16%
- Cash-on-cash
- -0.46%
- DSCR
- 0.98
- GRM
- 10.3
CMA / ARV
- ARV (median comp)
- $332,072
- List price
- $349,900
- Delta
- 5.37%
- Verdict
- FAIR
- Comps
- 20 within 1.0 mi
Show comp detail 12 sales within ~0.75 mi
| Address | Dist | Beds/Ba | Sqft | Sold | Price | $/sf | Match |
|---|---|---|---|---|---|---|---|
| 1266 Legacy Ln | 0.27mi | 3/2.5 | 2,852 (-0%) | 8mo | $339,900 | $119 | 80 |
| 898 Justine Cir W | 0.48mi | 4/2.5 (+1) | 2,857 (0%) | 7mo | $575,000 | $201 | 67 |
| 1469 Turncoat Cir | 0.48mi | 4/2.5 (+1) | 2,780 (-3%) | 7mo | $330,000 | $119 | 62 |
| 10586 Jacks Way | 0.55mi | 3/2.5 | 2,551 (-11%) | 1mo | $656,000 | $257 | 56 |
| 1399 Castleford Ln | 0.08mi | 4/2.5 (+1) | 3,248 (+14%) | 15mo | $344,000 | $106 | 56 |
| 741 Crystal Farms Dr | 0.56mi | 3/2.5 | 2,750 (-4%) | 15mo | $335,000 | $122 | 55 |
| 10309 Buckshire Ln | 0.14mi | 4/2.5 (+1) | 3,272 (+15%) | 11mo | $340,000 | $104 | 55 |
| 9817 Rhodes Ln | 0.60mi | 4/2.5 (+1) | 2,784 (-2%) | 17mo | $343,750 | $123 | 49 |
| 662 Halleck Way | 0.58mi | 4/2.5 (+1) | 2,974 (+4%) | 22mo | $369,900 | $124 | 43 |
| 913 Justine Cir W | 0.50mi | 3/2.5 | 2,483 (-13%) | 24mo | $540,000 | $217 | 35 |
| 10157 Watkins Ct | 0.49mi | 4/2.5 (+1) | 2,456 (-14%) | 20mo | $345,000 | $140 | 32 |
| 650 Davis Ct | 0.59mi | 4/2.5 (+1) | 2,472 (-13%) | 16mo | $352,500 | $143 | 32 |
Match score weights: distance 35% · size 25% · config 20% · recency 20%. Top-matched comps best support the ARV.
Projected returns pro-forma
-3.0% appreciation · 7.56% rent growth · sell at horizon
- IRR
- -12.4%
- Equity multiple
- 0.53×
- Total profit
- $-45,558
- Equity at exit
- $52,171
- IRR
- 2.2%
- Equity multiple
- 1.19×
- Total profit
- $18,365
- Equity at exit
- $30,253
Cash invested: $97,972 (down + closing). Projections, not guarantees.
Landlord ↔ Tenant lean methodology
- Overall (STATE)
- 90 Strongly Landlord-Friendly
- State Indiana
- 90 Strongly Landlord-Friendly · R+11
- County
- — inherits STATE
- City
- — inherits STATE
ZIP-level market 46234
- Home prices YoY
- -33.0%
- Rents YoY
- 7.6%
- Active inventory
- 64
- Price-to-rent
- 10.3×
Monthly cashflow live
- Estimated rent
- $2,834 high interval (Pro) →
- Mortgage (P&I)
- −$1,835
- Tax from tax record
- −$276 /mo · $3,311/yr
- Insurance
- −$146
- HOA
- −$20
- Vacancy / Maint / Mgmt
- −$595
- Net cashflow
- $-38
Break-even live
UW: 25.0% down · 7.5% · 30yr · 1.5% tax · 5.0% vac · 8.0% maint · 8.0% mgmt
Financing live
Cash to close
- Down payment
- $87,475
- Closing costs
- $10,497
- Reserves months
- —
- Total cash needed
- —
Loan-product check · same deal, 3 products live
Conventional
25% down · 7.5% · 30yr
- Down + closing
- —
- Monthly P&I
- —
- Monthly cashflow
- —
- DSCR
- —
- Eligible?
- —
Personal DTI + credit; lowest rate.
DSCR
20% down · 8.5% · 30yr
- Down + closing
- —
- Monthly P&I
- —
- Monthly cashflow
- —
- DSCR
- —
- Eligible?
- —
No personal income docs; deal must DSCR.
Hard money
10% down · 12.0% · 12mo
- Down + closing
- —
- Monthly P&I
- —
- Monthly cashflow
- —
- DSCR
- —
- Eligible?
- —
Short-term bridge; refi at stabilization.
Rent comps 7 comps
| Address | Beds | Baths | Sqft | Rent | $/sqft | DOM | Units | Dist |
|---|---|---|---|---|---|---|---|---|
| 10363 Fairmont Ln Unit 1522300P Indianapolis, IN | 3.0 | 2.0 | 2152 | $3,695 | $1.72 | 2d | 1 | 0.09mi |
| 10301 Kensington Way Indianapolis, IN | 3.0 | 3.5 | 2636 | $2,430 | $0.92 | 4d | 1 | 0.10mi |
| 1267 Constitution Dr Indianapolis, IN | 4.0 | 2.5 | 2228 | $2,455 | $1.10 | 14d | 1 | 0.58mi |
| 453 Yorktown Ln Avon, IN | 4.0 | 2.5 | 2392 | $2,415 | $1.01 | 23d | 1 | 0.78mi |
| 861 Adler Dr Avon, IN | 4.0 | 2.5 | 2669 | $3,100 | $1.16 | 23d | 1 | 0.98mi |
| 10440 Wintergreen Way Indianapolis, IN | 3.0 | 2.5 | 2416 | $2,281 | $0.94 | 43d | 1 | 1.01mi |
| 794 Carolina Way Avon, IN | 4.0 | 2.5 | 2390 | $2,470 | $1.03 | 23d | 1 | 1.40mi |
HOA detail
- Monthly dues
- $20 · $240/yr
Listing history 22 events
-
2026-06-18days on market $349,900 Active 223 DOM
-
2026-06-17days on market $349,900 Active 222 DOM
-
2026-06-16days on market $349,900 Active 221 DOM
-
2026-06-15days on market $349,900 Active 220 DOM
-
2026-06-13days on market $349,900 Active 218 DOM
-
2026-06-13days on market $349,900 Active 217 DOM
-
2026-06-09days on market $349,900 Active 214 DOM
-
2026-06-08days on market $349,900 Active 213 DOM
-
2026-06-07days on market $349,900 Active 212 DOM
-
2026-06-03days on market $349,900 Active 208 DOM
-
2026-06-02days on market $349,900 Active 207 DOM
-
2026-06-01days on market $349,900 Active 206 DOM
-
2026-05-31days on market $349,900 Active 205 DOM
-
2026-05-04price $349,900 368-char remark
Show marketing remark (368 chars)
This wonderful 4 bedroom home in one of the best school districts with room for the growing family. Home has 2.5 bathrooms, fireplace in the family room for cozy evenings. Home comes with new updated Anderson windows, hardwood floors thru out. Close to interstate and shopping areas. Garage has 2 car spaces. Home comes with 1 yr home warranty for your peacde of mind.
-
2026-04-15price $369,900 368-char remark
Show marketing remark (368 chars)
This wonderful 4 bedroom home in one of the best school districts with room for the growing family. Home has 2.5 bathrooms, fireplace in the family room for cozy evenings. Home comes with new updated Anderson windows, hardwood floors thru out. Close to interstate and shopping areas. Garage has 2 car spaces. Home comes with 1 yr home warranty for your peacde of mind.
-
2026-04-15price $364,900 368-char remark
Show marketing remark (368 chars)
This wonderful 4 bedroom home in one of the best school districts with room for the growing family. Home has 2.5 bathrooms, fireplace in the family room for cozy evenings. Home comes with new updated Anderson windows, hardwood floors thru out. Close to interstate and shopping areas. Garage has 2 car spaces. Home comes with 1 yr home warranty for your peacde of mind.
-
2026-04-15price $369,900 368-char remark
Show marketing remark (368 chars)
This wonderful 4 bedroom home in one of the best school districts with room for the growing family. Home has 2.5 bathrooms, fireplace in the family room for cozy evenings. Home comes with new updated Anderson windows, hardwood floors thru out. Close to interstate and shopping areas. Garage has 2 car spaces. Home comes with 1 yr home warranty for your peacde of mind.
-
2026-03-09price $374,900 368-char remark
Show marketing remark (368 chars)
This wonderful 4 bedroom home in one of the best school districts with room for the growing family. Home has 2.5 bathrooms, fireplace in the family room for cozy evenings. Home comes with new updated Anderson windows, hardwood floors thru out. Close to interstate and shopping areas. Garage has 2 car spaces. Home comes with 1 yr home warranty for your peacde of mind.
-
2025-11-05$379,900 Active 368-char remark
Show marketing remark (368 chars)
This wonderful 4 bedroom home in one of the best school districts with room for the growing family. Home has 2.5 bathrooms, fireplace in the family room for cozy evenings. Home comes with new updated Anderson windows, hardwood floors thru out. Close to interstate and shopping areas. Garage has 2 car spaces. Home comes with 1 yr home warranty for your peacde of mind.
-
2012-12-31historical 149-char remark
Show marketing remark (149 chars)
This two story home has 3 bedrooms, 2.5baths and a 2 car attached garage. Home also features a nice loft and a fireplace in the spacious family room.
-
2012-12-28soldstatus $100,000 149-char remark
Show marketing remark (149 chars)
This two story home has 3 bedrooms, 2.5baths and a 2 car attached garage. Home also features a nice loft and a fireplace in the spacious family room.
-
2012-04-24$100,000 149-char remark
Show marketing remark (149 chars)
This two story home has 3 bedrooms, 2.5baths and a 2 car attached garage. Home also features a nice loft and a fireplace in the spacious family room.
ⓘ Source: listings_history table (triggers on properties + properties_extension) + one-shot
backfill from property_details.listing_events for pre-trigger history.
Tax reassessment forecast IN · Partial reset (capped growth)
- Current annual tax
- $3,311 · $276/mo
- Projected year-2 tax
- $3,311 · $276/mo
- Expected delta
- $0/yr ($0/mo · 0.0%)
ⓘ Screening estimate from a state-policy table — verify with the county assessor before closing.
Climate risk First Street
- Flood 1/10 Low FEMA zone X (unshaded) · 0% chance over 30 yrs
- Wildfire 1/10 Low
- Heat 3/10 Moderate 7 d/yr ≥101°F today · 19 d/yr by 30 yrs out
- Wind 2/10 Low 0% chance of damaging wind over 30 yrs
- Air quality 4/10 Moderate 4 unhealthy d/yr today · 5 by 30 yrs out
Nearby sold comps map
Loading sold comps map…
Walkable amenities ~0.75 mi
Loading nearby amenities…
Taxation est. · year 1
- Rental income
- $34,006
- − Mortgage interest
- −$19,600
- − Property taxes
- −$3,311
- − Insurance
- −$1,750
- − Repairs & maintenance
- −$2,720
- − Management
- −$2,720
- − HOA
- −$240
- − Depreciation
- −$10,179
- Taxable loss
- −$6,514
- Est. tax savings @ 24.0%
- +$1,563
- After-tax cash flow
- $1,109/yr
For passive investors: Depreciation is non-cash, so a rental often shows a tax loss while cash-flowing — sheltering income. Rental losses are passive: they offset passive income freely, and up to $25,000/yr can offset ordinary (W-2) income if you actively participate and your MAGI is under $100k (phasing out to $0 by $150k); unused losses carry forward. On sale, claimed depreciation is recaptured at up to 25%, and gains may owe capital-gains tax (a 1031 exchange can defer both). Figures are a year-1 estimate at your 24.0% rate — not tax advice; consult a CPA.
Schools (NCES district)
- District
- Avon Community School Corporation
- NCES district ID
- 1800270
- Math proficiency
- 51% ▼ -8.00%
- Reading proficiency
- 53% ▼ -8.00%
- Median HH income
- $75,987
- Composite
- 46.93/100
- National rank
- #2362
- State rank
- #32 of 301 in IN
Livability — Avon
- Score
- 74/100
- State rank
- #75
- US rank
- #4686
Category grades
Schools grade is shown separately in the Schools card above.
Census & demographics
- County
- Marion County · 998,460 people
- City population
- 43,353
- Metro
- Indianapolis-Carmel-Anderson, IN
- Population (ZIP)
- 28,300
- Household income
- $83,190
- Rent vs Own
- Severe rent burden
- 764.0
Population outlook (Hendricks County) Hauer SSP2
- Today (2025)
- 187,418 people
- By 2030
- 201,494 · +7.5%
- By 2040
- 228,487 · +21.9%
- By 2050
- 253,068 · +35.0%
- By 2075
- 308,920 · +64.8%
- By 2100
- 336,510 · +79.6%
Race, ethnicity, and origin ACS 2023
- Neighborhood character
- Diverse neighborhood (Simpson 0.56)
- Race & ethnicity
- White 63% Black 19% Hispanic / Latino 10% Two or more races 7% Asian 4%
- Hispanic origin (detail)
- Mexican 6%
- Common ancestry
- Italian 2% Romanian 2% Iranian 2%
- Foreign-born
- 11% · Canada, China, United Kingdom
- Languages at home
- 82% English-only · Spanish 8% Other Indo-European 3% French/Haitian/Cajun 3%
Political lean MEDSL · Hendricks
- 2024 margin
- Strong R (+21.5) · D 38.4% · R 59.9% · Other 1.7%
- 2008→2024 swing
- +1.9pp toward D · 2008: -23.4pp · 2024: -21.5pp
- All cycles
- 2024: R+21.5 2020: R+23.9 2016: R+34.2 2012: R+34.9 2008: R+23.4
Not yet ingested
- Civics
- —
Market trends
- HPI YoY
- ▼ -106.23%
- Current HPI
- 215.5854
- Rent YoY
- ▲ 7.56%
- Metro
- Indianapolis-Carmel-Anderson, IN
- State GDP YoY
- ▲ 2.90%
- F500 in state
- 18
Industry mix (Fortune 500 HQ in IN)
| Industry | F500 HQs | Revenue |
|---|---|---|
| Industrial Machinery | 2 | $37B |
|
||
| Healthcare | 1 | $177B |
|
||
| Pharmaceuticals | 1 | $45B |
|
||
| Metals / Steel | 1 | $18B |
|
||
| Agriculture | 1 | $17B |
|
||
| Packaging | 1 | $12B |
|
||
Price history
+249.9% since first listed9 events — show timeline
- 2026-05-04 Price Changed $349,900 MIBOR as Distributed by MLS Grid
- 2026-04-15 Price Changed $369,900 MIBOR as Distributed by MLS Grid
- 2026-04-15 Price Changed $364,900 MIBOR as Distributed by MLS Grid
- 2026-04-15 Price Changed $369,900 MIBOR as Distributed by MLS Grid
- 2026-03-09 Price Changed $374,900 MIBOR as Distributed by MLS Grid
- 2025-11-05 Listed $379,900 MIBOR as Distributed by MLS Grid
- 2012-12-31 Listing Removed — MIBOR as Distributed by MLS Grid
- 2012-12-28 Sold (MLS) $100,000 MIBOR as Distributed by MLS Grid
- 2012-04-24 Listed $100,000 MIBOR as Distributed by MLS Grid
Property tax history
+7.7%/yrLatest (2025): $3,311 · +10.7% YoY. Source: county tax records.
Cash-flow waterfall
monthlySold comps — $/sqft
last 12 mo · ≤1 miLoading sold comps…