4 1/2 Barnard Ave · LaGrange, GA
Flood risk 1/10 · Minimal
- FEMA flood zone
- X (unshaded)
- Chance of flooding over 30 yrs
- 0.0%
- Est. flood insurance / yr
- $507 – $1,088
Fire risk 4/10 · Minor
- Est. fire insurance / yr
- $963 – $1,789
Heat risk 6/10 · Moderate
- Hot days now (above 105°F)
- 7 days/yr
- Hot days in 30 yrs
- 19 days/yr
Wind risk 6/10 · Moderate
- Chance of severe wind over 30 yrs
- 56.0%
Air-quality risk 3/10 · Minor
- Unhealthy air days now
- 4 days/yr
- Unhealthy air days in 30 yrs
- 4 days/yr
Risk factors via First Street. Map © Google.
Why this score? — see what drove the C grade
The composite is a weighted blend of 9 inputs, each scored 0–100. Each bar is that input's sub-score; the figure is the points it added to the 100-point composite (weight × sub-score).
- Cash flow +28.8/30.0
- DSCR +10.0/10.0
- 1% rule +8.0/10.0
- Rent growth +3.7/5.0
- Livability +3.0/5.0
- Schools +2.3/10.0
- Condition / age +2.2/5.0
- ARV discount +0.0/15.0
- Appreciation +0.0/10.0
$110,000
🖨 Deal sheet (PDF) 📄 Offer letter ✓ Due diligence
Listing remarks MLS
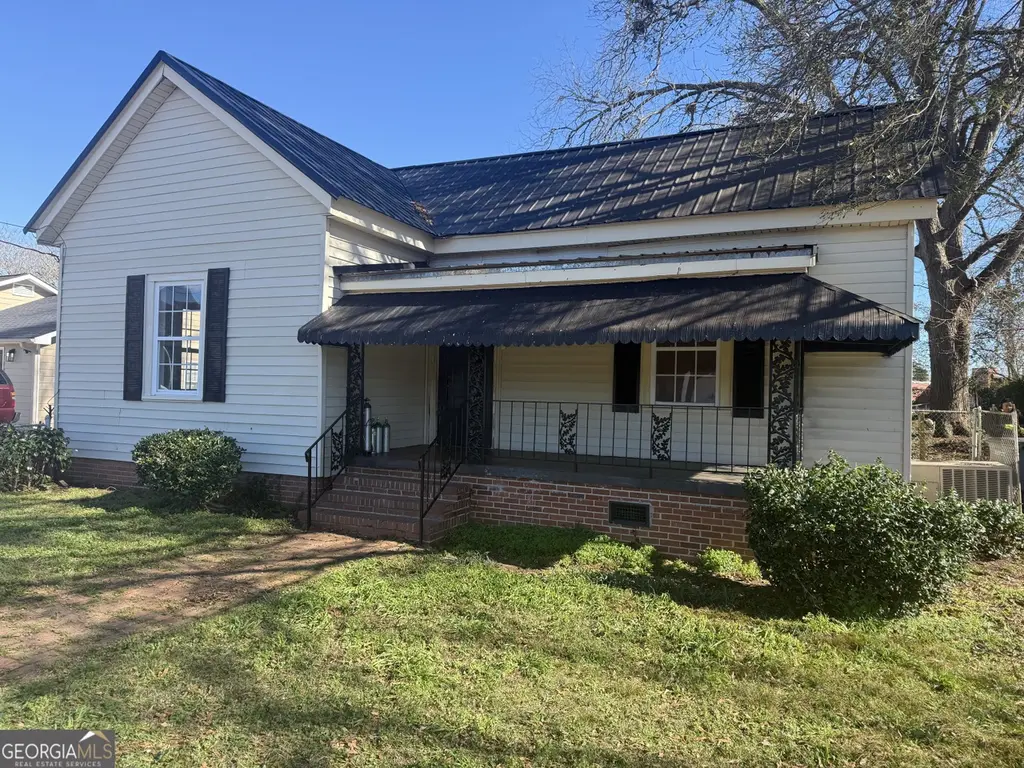
This 2 bedroom 1 bath home has large rooms fenced front and rear yards , large storage building in rear, covered front porch convenient to town and the Mall area.
Key facts
- Covered front porch
- 8,276 sq ft lot
- Built 1909
Tags
Neighborhood map
What this means for you Summary
Snapshot
- This is a 2-bed/1.0-bath single-family listed at $110k. Condition is rated fair.
Deal economics
- At list price, monthly cash flow is $369 ($4k/yr) — positive.
- The deal already cash-flows at list — no discount required.
- Meets the 1% rule at list price ($1k rent vs $110k).
- Recommended offer: $100k (9.0% below list) — sets the bar for market timing.
- Cap rate 10.3% vs local median 3.4% in LaGrange — top-decile yield for the area; either an underpriced asset or a hidden risk that comps aren't pricing in. Stress-test before assuming the spread holds.
Location & tenants
- Location reads 60/100 on livability (#393 in GA) — a middle-class / working-renter tenant base. Strengths: cost of living A+, housing A; Watch: crime F, amenities F, commute F.
- Troup County (rural): math 26% / reading 29% proficiency, ranked #109 of 174 in GA (top 63%) — low school quality limits family demand, transient renter base, plan for 1-2y turnover.
- Zoned schools: Callaway Elementary School (math 28% / reading 22%, grade F, #745 of 1,228 statewide, top 61%, 651 students, 72% FRL); Gardner-Newman Middle School (math 25% / reading 32%, grade F, #260 of 470 statewide, top 56%, 1,039 students, 94% FRL); Lagrange High School (math 25% / reading 12%, grade F, #254 of 424 statewide, top 61%, 1,301 students, 45% FRL).
- Market conditions: Rents rising fast (+5.0%/yr); 277 active listings in the ZIP; 8 comparable units currently listed for rent nearby; rentals lingering (median 47d on market — plan ~5-8 weeks vacancy on turnover, expect pricing pressure); 50% of comp listings sitting > 30 days — soft ceiling on asking rent; 474 units permitted in Troup County in 2024 (87 in 5+ unit buildings).
- This rent runs 35% of the median local income ($49k/yr) — at the standard rent-burdened threshold; future hikes will face affordability resistance.
Forward outlook
- Local home prices are declining (-3.0%/yr); year-one equity from $761 of loan paydown is wiped out by about $3k of value loss. Plan a longer hold.
- Troup County population projected at +15% by 2050 — long-run rental-demand tailwind backs the buy-and-hold thesis.
- At projected returns (-3.0% appreciation + 5.0% rent growth), your $31k cash investment doubles in ~8 years — after that, you're playing with house money.
Negotiation context
- It's been on market 110 days — a 9% lower offer ($100k) is reasonable based on typical stale-listing flexibility.
- 2 sale attempts with the ask held roughly flat each time — persistent listings suggest the price (not the market) is what's stuck; bring a comps-based counter.
Risks & watch-outs
- Watch-outs: built in 1909 — expect roof / HVAC / electrical / plumbing capex.
- Climate carrying-cost: major wind risk, 56% chance of damaging wind over 30y; extreme-heat days projected 7→19/yr by 2055 (HVAC capex compounding) — expect insurance premiums to compound above CPI over the hold.
Questions for the listing agent
- It's been on market 110 days. Have you received any prior offers? Is the seller open to a 9% concession, seller financing, or rate buy-down credit?
- Have any recent inspections been done? Can we get a copy of the seller's disclosures and any deferred-maintenance estimates?
- Built in 1909 — when were the roof, HVAC, electrical panel, plumbing, and water heater last replaced?
- Why hasn't it sold? Are there any deal-killer items the seller is aware of (foundation, flood, title, zoning, code violations)?
- Is there a deadline driving the sale (1031 exchange, divorce, estate, relocation)? That informs how much negotiation room exists.
- Schools are D-rated, which usually means shorter tenancies and higher turnover. Who's the typical renter profile here, and what's been the actual vacancy rate?
- Crime grade is F in this area — have there been break-ins, vandalism, or insurance claims at this property in the last 3 years? What carrier currently insures it and at what premium?
- What's the average days-on-market for RENTAL listings here right now (not sales)? A rising rental-DOM trend means longer vacancies and softer asking-rent achievability than the comps imply.
- What's the recent tenant-quality profile in this submarket — average credit score on applications, eviction rate, late-payment / NSF rate, and stable-employment percentage? A property-management company in the area should have these aggregated.
- How much new for-sale + rental construction is in the pipeline within 1–3 miles? Heavy new supply typically softens prices + rents 12–24 months out; constrained supply supports both.
Investment metrics
- 1% rule
- 1.30% ✓
- Cap rate
- 10.32%
- Cash-on-cash
- 14.38%
- DSCR
- 1.64
- GRM
- 6.4
CMA / ARV
- ARV (median comp)
- $90,954
- List price
- $110,000
- Delta
- 20.94%
- Verdict
- OVERPRICED
- Comps
- 20 within 1.0 mi
Show comp detail 12 sales within ~0.75 mi
| Address | Dist | Beds/Ba | Sqft | Sold | Price | $/sf | Match |
|---|---|---|---|---|---|---|---|
| 224 Rutland Cir | 0.64mi | 3/1.0 (+1) | 1,288 (-1%) | 3mo | $196,000 | $152 | 62 |
| 914 Greenville St | 0.37mi | 3/1.0 (+1) | 1,220 (-6%) | 8mo | $90,000 | $74 | 61 |
| 811 Greenville St | 0.47mi | 3/1.0 (+1) | 1,356 (+4%) | 9mo | $62,000 | $46 | 58 |
| 616 S Harlem Cir | 0.70mi | 3/1.0 (+1) | 1,216 (-6%) | 2mo | $65,000 | $53 | 50 |
| 305 Lenox Cir | 0.74mi | 3/2.0 (+1) | 1,272 (-2%) | 4mo | $174,900 | $138 | 49 |
| 621 Arthur St | 0.61mi | 2/2.0 | 1,163 (-10%) | 4mo | $175,000 | $150 | 46 |
| 101 Lenox Cir | 0.67mi | 3/2.0 (+1) | 1,190 (-8%) | 5mo | $208,000 | $175 | 41 |
| 226 Lenox Cir | 0.68mi | 3/2.0 (+1) | 1,190 (-8%) | 6mo | $214,900 | $181 | 41 |
| 203 Bonaventure Dr | 0.72mi | 3/2.0 (+1) | 1,176 (-10%) | 2mo | $169,900 | $144 | 40 |
| 113 Lenox Cir | 0.72mi | 3/2.0 (+1) | 1,190 (-8%) | 9mo | $204,000 | $171 | 36 |
| 110 Lenox Cir | 0.66mi | 3/2.0 (+1) | 1,119 (-14%) | 3mo | $210,000 | $188 | 35 |
| 105 Lenox Cir | 0.65mi | 3/2.0 (+1) | 1,119 (-14%) | 6mo | $198,000 | $177 | 32 |
Match score weights: distance 35% · size 25% · config 20% · recency 20%. Top-matched comps best support the ARV.
Projected returns pro-forma
-3.0% appreciation · 4.95% rent growth · sell at horizon
- IRR
- 7.0%
- Equity multiple
- 1.28×
- Total profit
- $8,570
- Equity at exit
- $16,401
- IRR
- 18.0%
- Equity multiple
- 2.62×
- Total profit
- $50,039
- Equity at exit
- $9,511
Cash invested: $30,800 (down + closing). Projections, not guarantees.
Landlord ↔ Tenant lean methodology
- Overall (STATE)
- 90 Strongly Landlord-Friendly
- State Georgia
- 90 Strongly Landlord-Friendly · R+3
- County
- — inherits STATE
- City
- — inherits STATE
ZIP-level market 30241
- Home prices YoY
- -3.6%
- Rents YoY
- 5.0%
- Active inventory
- 277
- Price-to-rent
- 6.4×
Monthly cashflow live
- Estimated rent
- $1,430 high interval (Pro) →
- Mortgage (P&I)
- −$577
- Tax est. 1.5%
- −$138 /mo · $1,650/yr
- Insurance
- −$46
- HOA
- −$0
- Lot rent
- −$0
- Vacancy / Maint / Mgmt
- −$300
- Net cashflow
- $369
Break-even live
Sensitivity live
| Price | -10% $445 | -5% $407 | +0% $369 | +5% $331 | +10% $293 |
|---|---|---|---|---|---|
| Rent | -10% $256 | -5% $313 | +0% $369 | +5% $426 | +10% $482 |
| Rate | -1.0pp $425 | -0.5pp $397 | base $369 | +0.5pp $341 | +1.0pp $312 |
UW: 25.0% down · 7.5% · 30yr · 1.5% tax · 5.0% vac · 8.0% maint · 8.0% mgmt
Financing live
Cash to close
- Down payment
- $27,500
- Closing costs
- $3,300
- Reserves months
- —
- Total cash needed
- —
Loan-product check · same deal, 3 products live
Conventional
25% down · 7.5% · 30yr
- Down + closing
- —
- Monthly P&I
- —
- Monthly cashflow
- —
- DSCR
- —
- Eligible?
- —
Personal DTI + credit; lowest rate.
DSCR
20% down · 8.5% · 30yr
- Down + closing
- —
- Monthly P&I
- —
- Monthly cashflow
- —
- DSCR
- —
- Eligible?
- —
No personal income docs; deal must DSCR.
Hard money
10% down · 12.0% · 12mo
- Down + closing
- —
- Monthly P&I
- —
- Monthly cashflow
- —
- DSCR
- —
- Eligible?
- —
Short-term bridge; refi at stabilization.
Rent comps 8 comps
| Address | Beds | Baths | Sqft | Rent | $/sqft | DOM | Units | Dist |
|---|---|---|---|---|---|---|---|---|
| 300 Commerce Ave LaGrange, GA | 1.0–3.0 | 1.0–2.0 | 1248 | $1,712 | $1.37 | 0d | 22 | 0.57mi |
| 1235 Hogansville Rd LaGrange, GA | 3.0 | 2.0 | 1263 | $1,555 | $1.23 | 46d | 1 | 0.65mi |
| 102 Peachtree Ct Lagrange, GA | 2.0 | 1.0 | 1120 | $1,050 | $0.94 | 46d | 1 | 0.77mi |
| 110 Oak Ln LaGrange, GA | 3.0 | 1.0 | 936 | $1,200 | $1.28 | 46d | 1 | 0.90mi |
| 150 Mill Creek Pkwy LaGrange, GA | 1.0–2.0 | 1.0–2.0 | 954 | $1,465 | $1.53 | 46d | 11 | 0.94mi |
| 1 Canopy Crest WAY LaGrange, GA | 2.0–4.0 | 2.5–3.0 | 1442 | $1,885 | $1.31 | 6d | 9 | 0.96mi |
| 151 S Davis Rd LaGrange, GA | 3.0 | 1.0–2.0 | 940 | $1,619 | $1.72 | 1d | 30 | 1.35mi |
| 115 Mitchell Ave Ofc 41 LaGrange, GA | 2.0–3.0 | 1.0–1.5 | 987 | $1,000 | $1.01 | 1d | 4 | 1.44mi |
Listing history 8 events
-
2026-06-03status $110,000 Under Contract 110 DOM
-
2026-06-02days on market $110,000 Active 110 DOM
-
2026-06-01days on market $110,000 Active 109 DOM
-
2026-05-31days on market $110,000 Active 108 DOM
-
2026-05-30days on market $110,000 Active 107 DOM
-
2026-04-18status Back On Market 162-char remark
Show marketing remark (162 chars)
This 2 bedroom 1 bath home has large rooms fenced front and rear yards , large storage building in rear, covered front porch convenient to town and the Mall area.
-
2026-03-19status Under Contract 162-char remark
Show marketing remark (162 chars)
This 2 bedroom 1 bath home has large rooms fenced front and rear yards , large storage building in rear, covered front porch convenient to town and the Mall area.
-
2026-01-13$110,000 New 162-char remark
Show marketing remark (162 chars)
This 2 bedroom 1 bath home has large rooms fenced front and rear yards , large storage building in rear, covered front porch convenient to town and the Mall area.
ⓘ Source: listings_history table (triggers on properties + properties_extension) + one-shot
backfill from property_details.listing_events for pre-trigger history.
Climate risk First Street
- Flood 1/10 Low FEMA zone X (unshaded) · 0% chance over 30 yrs
- Wildfire 4/10 Moderate
- Heat 6/10 Major 7 d/yr ≥105°F today · 19 d/yr by 30 yrs out
- Wind 6/10 Major 56% chance of damaging wind over 30 yrs
- Air quality 3/10 Moderate 4 unhealthy d/yr today · 4 by 30 yrs out
Nearby sold comps map
Loading sold comps map…
Walkable amenities ~0.75 mi
Loading nearby amenities…
Taxation est. · year 1
- Rental income
- $17,155
- − Mortgage interest
- −$6,162
- − Property taxes
- −$1,650
- − Insurance
- −$550
- − Repairs & maintenance
- −$1,372
- − Management
- −$1,372
- − Depreciation
- −$3,200
- Taxable income
- $2,849
- Est. tax owed @ 24.0%
- −$684
- After-tax cash flow
- $3,747/yr
For passive investors: Depreciation is non-cash, so a rental often shows a tax loss while cash-flowing — sheltering income. Rental losses are passive: they offset passive income freely, and up to $25,000/yr can offset ordinary (W-2) income if you actively participate and your MAGI is under $100k (phasing out to $0 by $150k); unused losses carry forward. On sale, claimed depreciation is recaptured at up to 25%, and gains may owe capital-gains tax (a 1031 exchange can defer both). Figures are a year-1 estimate at your 24.0% rate — not tax advice; consult a CPA.
Condition & rehab AI · 12 photos
This 2-bedroom home requires moderate renovations to update the kitchen and bathroom, repair the roof, and improve curb appeal. These updates will significantly increase its resale and rental value.
Repairs flagged
- Moderate kitchen cabinets — dated and in need of replacement
- Moderate kitchen appliances — outdated and in need of replacement
- Moderate bathroom shower — dated and in need of replacement
- Moderate roof — visible wear and potential leaks
Value-add opportunities
- Both update kitchen with new cabinets and appliances — modern kitchen will attract more buyers and renters
- Both update bathroom with new fixtures and shower — modern bathroom will attract more buyers and renters
- Both repair and replace roof — new roof will increase home's value and reduce maintenance costs
Renovation cost estimate screening
| Repair item | Severity | Est. cost |
|---|---|---|
| kitchen cabinets · dated and in need of replacement | Moderate | $3,000–15,000 |
| kitchen appliances · outdated and in need of replacement | Moderate | $3,000–15,000 |
| bathroom shower · dated and in need of replacement | Moderate | $3,000–15,000 |
| roof · visible wear and potential leaks | Moderate | $3,000–15,000 |
| Total estimated repair cost · 4 items | $12,000–60,000 |
Value-add ROI direction
- Both update kitchen with new cabinets and appliances — modern kitchen will attract more buyers and renters ↑
- Both update bathroom with new fixtures and shower — modern bathroom will attract more buyers and renters ↑
- Both repair and replace roof — new roof will increase home's value and reduce maintenance costs ↑
ⓘ Cost ranges are severity-bucket heuristics (US national rule-of-thumb). Get contractor quotes + a written scope before underwriting a rehab budget.
Schools (NCES district)
- District
- Troup County
- NCES district ID
- 1300001
- Math proficiency
- 26% ▼ -10.00%
- Reading proficiency
- 29% ▼ -4.00%
- Median HH income
- $41,354
- Composite
- 23.3/100
- National rank
- #7920
- State rank
- #109 of 174 in GA
Livability — LaGrange
- Score
- 60/100
- State rank
- #393
- US rank
- #19555
Category grades
Schools grade is shown separately in the Schools card above.
Census & demographics
- Census place
- LaGrange, GA
- County
- Troup County · 57,111 people
- City population
- 57,111
- Metro
- LaGrange, GA-AL
- Population (ZIP)
- 25,840
- Household income
- $49,053
- Rent vs Own
- Severe rent burden
- 1383.0
Population outlook (Troup County) Hauer SSP2
- Today (2025)
- 75,537 people
- By 2030
- 78,250 · +3.6%
- By 2040
- 83,184 · +10.1%
- By 2050
- 87,167 · +15.4%
- By 2075
- 95,643 · +26.6%
- By 2100
- 94,234 · +24.8%
Race, ethnicity, and origin ACS 2023
- Neighborhood character
- Diverse neighborhood (Simpson 0.58)
- Race & ethnicity
- Black 46% White 46% Hispanic / Latino 3% Asian 3% Two or more races 2%
- Common ancestry
- Lithuanian 1% Hispanic 1% Italian 1%
- Foreign-born
- 4% · South Korea, Canada
- Languages at home
- 93% English-only · Spanish 3% Korean 2% Other Indo-European 1%
Political lean MEDSL · Troup
- 2024 margin
- Strong R (+24.4) · D 37.6% · R 62.0%
- 2008→2024 swing
- -5.4pp toward R · 2008: -19.0pp · 2024: -24.4pp
- All cycles
- 2024: R+24.4 2020: R+21.9 2016: R+23.4 2012: R+17.8 2008: R+19.0
Not yet ingested
- Civics
- —
Market trends
- HPI YoY
- ▼ -10.51%
- Current HPI
- 277.9099
- Rent YoY
- ▲ 4.95%
- Metro
- LaGrange, GA-AL
- State GDP YoY
- ▲ 2.66%
- F500 in state
- 28
Industry mix (Fortune 500 HQ in GA)
| Industry | F500 HQs | Revenue |
|---|---|---|
| Paper / Packaging | 2 | $29B |
|
||
| Retail | 1 | $160B |
|
||
| Transportation / Logistics | 1 | $91B |
|
||
| Airlines | 1 | $62B |
|
||
| Consumer Goods | 1 | $47B |
|
||
| Utilities | 1 | $25B |
|
||
Price history
3 events — show timeline
- 2026-04-18 Relisted — GAMLS
- 2026-03-19 Pending — GAMLS
- 2026-01-13 Listed $110,000 GAMLS
Cash-flow waterfall
monthlySold comps — $/sqft
last 12 mo · ≤1 miLoading sold comps…