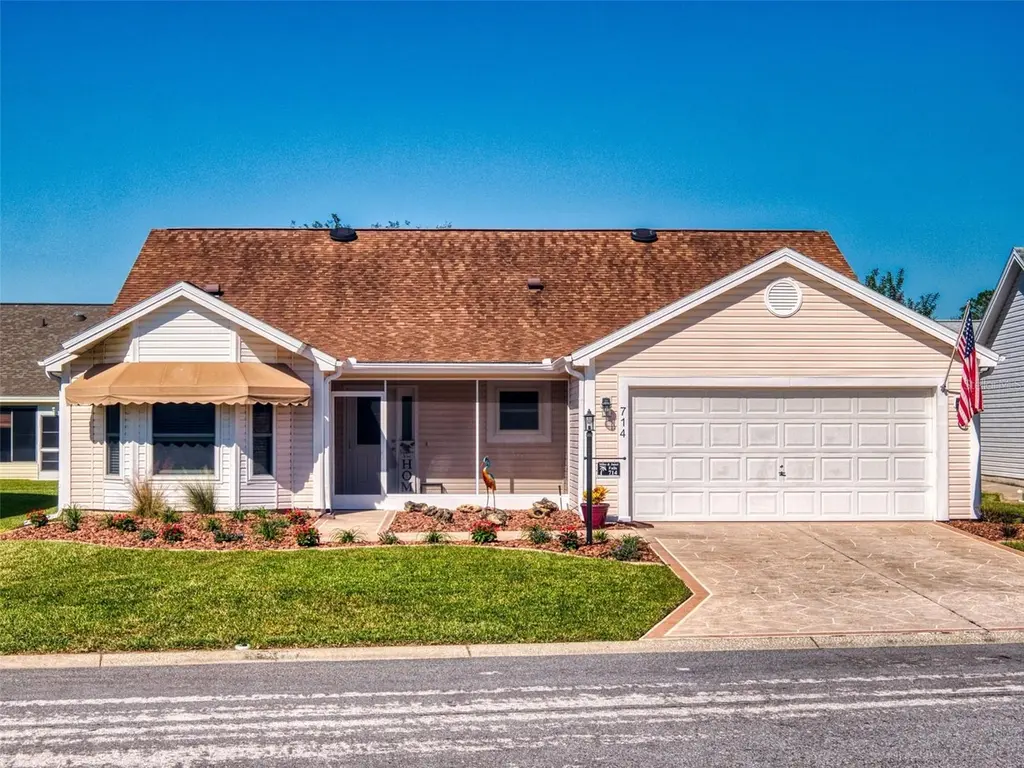
714 Del Rosario St · The Villages, FL
Flood risk 1/10 · Minimal
- FEMA flood zone
- X (unshaded)
- Chance of flooding over 30 yrs
- 0.0%
- Est. flood insurance / yr
- $507 – $1,088
Fire risk 4/10 · Minor
- Est. fire insurance / yr
- $947 – $1,759
Heat risk 9/10 · Severe
- Hot days now (above 108°F)
- 7 days/yr
- Hot days in 30 yrs
- 22 days/yr
Wind risk 9/10 · Severe
- Chance of severe wind over 30 yrs
- 99.0%
Air-quality risk 3/10 · Minor
- Unhealthy air days now
- 2 days/yr
- Unhealthy air days in 30 yrs
- 3 days/yr
Risk factors via First Street. Map © Google.
Why this score? — see what drove the D+ grade
The composite is a weighted blend of 9 inputs, each scored 0–100. Each bar is that input's sub-score; the figure is the points it added to the 100-point composite (weight × sub-score).
- ARV discount +15.0/15.0
- Cash flow +10.5/30.0
- Schools +5.2/10.0
- Rent growth +3.5/5.0
- Livability +3.5/5.0
- 1% rule +3.3/10.0
- DSCR +3.0/10.0
- Condition / age +2.5/5.0
- Appreciation +0.0/10.0
$355,000
🖨 Deal sheet 📄 Offer letter ✓ Due diligence
Listing remarks
Welcome to 714 Del Rosario St in the heart of The Villages! This beautifully updated 3-bedroom home offers an open and spacious floor plan with high ceilings, neutral colors throughout, and numerous upgrades that make it truly move-in ready. Conveniently located halfway between Spanish Springs Town Square and Lake Sumter Landing, you’ll enjoy quick access to shopping, restaurants, entertainment, and everything The Villages lifestyle has to offer, with additional dining and retail options nearby along US-441. Inside, you’ll find all new flooring, fresh interior paint, and a bright open layout perfect for everyday living and entertaining. The kitchen is equipped with all new appl
Key facts
- New flooring
- New appliances
- Full utility sink
Tags
Property features AI
Finance
- Other: CDD present; Property located on approximately 0.13 acres
- Financial info: Other annual assessment: $454; Total annual fees: $2,640 (monthly $220)
- HOA & community: HOA: The Villages (monthly fee $220); HOA fee covers pool, maintenance of grounds, recreational facilities, sewer, trash, and water; Community features include clubhouse, pool, park, playground, tennis and pickleball courts, shuffleboard, basketball court, trails, stable(s), and street lights; Pets allowed (cats and dogs); Senior community; Golf carts allowed; Association-required membership
Exterior
- Parking: Attached garage; 2-car garage; Garage door opener; On-street parking
- Security: Smoke detectors
- Utilities: Public water; Public sewer; Electricity connected; Cable available and connected; BB/HS internet available; Phone available; Sewer connected; Water connected
- Home design: Single-family residence; One story; Facing east; Residential property
- Construction: Vinyl siding; Shingle roof; Slab foundation; Built on one level
- Exterior features: Rain gutters; Irrigation equipment; Asphalt road access
Interior
- Kitchen: Dishwasher; Disposal; Freezer; Microwave; Range; Refrigerator; Eat-in kitchen
- Bedrooms: 3 bedrooms
- Flooring: Ceramic tile
- Bathrooms: 2 full bathrooms
- Heating & cooling: Central heating; Central air
- Interior features: Ceiling fans; Eat-in kitchen; High ceilings; Living room/dining room combo; Open floorplan; Thermostat; Vaulted ceilings; Walk-in closets; Window treatments; Skylights; Blinds; Double pane and insulated windows
- Laundry & utility: Washer hookup; Dryer hookup (electric); Inside laundry room; Inside utility
Neighborhood map
What this means for you Summary
Snapshot
- This is a 3-bed/2.0-bath single-family listed at $355k.
Deal economics
- At list price, monthly cash flow is $-182 ($-2k/yr) — negative.
- To cash-flow at today's rent, offer at most $323k (9.0% below list).
- To meet the 1% rule (rent ≥ 1% of price), the offer needs to be $294k (17.2% below list).
- Recommended offer: $294k (17.2% below list) — sets the bar for 1% rule.
Location & tenants
- Location reads 70/100 on livability (#431 in FL) — a middle-class / working-renter tenant base. Strengths: crime A+, housing A, employment B+; Watch: amenities F, commute F, health & safety F.
- Sumter (rural): math 61% / reading 61% proficiency, ranked #11 of 73 in FL (top 15%) — acceptable for families but not a draw, mixed tenant base, ~2y average lease.
- Zoned schools: Wildwood Elementary School (math 49% / reading 52%, grade D+, #1,055 of 2,144 statewide, top 50%, 940 students, 76% FRL); Wildwood Middle/ High School (math 29% / reading 41%, grade F, #379 of 667 statewide, top 58%, 843 students, 63% FRL) — zoned schools average 69% FRL vs 51% district-wide (19 pts higher); higher-poverty schools than district average — tighter screening recommended.
- Zoned-school proficiency averages 43% at this address vs 61% district-wide (-18 pts) — the specific schools serving this property underperform the Sumter average; the district grade overstates school quality for this exact location.
- Market conditions: Rents rising fast (+4.0%/yr); 576 active listings in the ZIP; 19 comparable units currently listed for rent nearby; rentals at typical pace (median 21d on market — plan ~3-4 weeks tenant-placement turnaround); 3,961 units permitted in Sumter County in 2024 (248 in 5+ unit buildings).
- At $2,939/mo this rent would consume 60% of the median local household income ($59k/yr) (locally 1047% of renters already pay >50% of income on rent) — very limited rent-growth headroom before tenants either downsize or default.
Forward outlook
- Local home prices are declining (-3.0%/yr); year-one equity from $2k of loan paydown is wiped out by about $11k of value loss. Plan a longer hold.
- Sumter County population projected at +45% by 2050 — long-run rental-demand tailwind backs the buy-and-hold thesis.
Negotiation context
- It's been on market 32 days — a 3% lower offer ($344k) is reasonable based on typical stale-listing flexibility.
- 2 sale attempts with the ask held roughly flat each time — persistent listings suggest the price (not the market) is what's stuck; bring a comps-based counter.
Risks & watch-outs
- Climate carrying-cost: severe wind risk, 99% chance of damaging wind over 30y; extreme-heat days projected 7→22/yr by 2055 (HVAC capex compounding) — expect insurance premiums to compound above CPI over the hold.
Questions for the listing agent
- What do current leases actually rent for vs. the listed asking? Can we see a recent rent roll and the last 12 months of T-12 income?
- It's been on market 32 days. Have you received any prior offers? Is the seller open to a 17% concession, seller financing, or rate buy-down credit?
- What does the HOA fee cover, when was the last increase, and are there any pending special assessments or reserve-fund shortfalls?
- Is there a deadline driving the sale (1031 exchange, divorce, estate, relocation)? That informs how much negotiation room exists.
- Schools are A-rated — typically a magnet for longer-tenancy family renters. What's the average tenant stay here, and is there a school-zone premium baked into asking?
- The area grade is low — what's the realistic commute time and amenity access for the typical tenant pool here? Any planned neighborhood developments (good or bad) we should know about?
- What's the average days-on-market for RENTAL listings here right now (not sales)? A rising rental-DOM trend means longer vacancies and softer asking-rent achievability than the comps imply.
- What's the recent tenant-quality profile in this submarket — average credit score on applications, eviction rate, late-payment / NSF rate, and stable-employment percentage? A property-management company in the area should have these aggregated.
- How much new for-sale + rental construction is in the pipeline within 1–3 miles? Heavy new supply typically softens prices + rents 12–24 months out; constrained supply supports both.
Investment metrics
- 1% rule
- 0.83% ✗
- Cap rate
- 5.68%
- Cash-on-cash
- -2.20%
- DSCR
- 0.90
- GRM
- 10.1
CMA / ARV
- ARV (on-the-fly)
- $427,392
- Comps found
- 12
Show comp detail 12 sales within ~0.75 mi
| Address | Dist | Beds/Ba | Sqft | Sold | Price | $/sf | Match |
|---|---|---|---|---|---|---|---|
| 602 Juanita Ct | 0.09mi | 3/2.0 | 1,776 (-7%) | 1mo | $389,000 | $219 | 83 |
| 2051 Palo Alto Ave | 0.59mi | 3/2.0 | 1,908 (0%) | 0mo | $360,000 | $189 | 72 |
| 913 Soledad Way | 0.47mi | 3/2.0 | 1,982 (+4%) | 1mo | $444,000 | $224 | 71 |
| 821 San Salvador Dr | 0.54mi | 3/2.0 | 1,948 (+2%) | 2mo | $580,000 | $298 | 70 |
| 1918 Armondo Dr | 0.53mi | 3/2.0 | 1,963 (+3%) | 1mo | $325,000 | $166 | 69 |
| 610 Espana St | 0.28mi | 3/2.5 | 2,086 (+9%) | 1mo | $555,000 | $266 | 68 |
| 1805 Santana Way | 0.53mi | 3/2.0 | 1,816 (-5%) | 1mo | $389,000 | $214 | 67 |
| 725 Palma Dr | 0.67mi | 3/2.0 | 1,861 (-2%) | 2mo | $423,000 | $227 | 63 |
| 1803 Palo Alto Ave | 0.44mi | 3/2.0 | 2,104 (+10%) | 1mo | $486,000 | $231 | 62 |
| 545 Carrera Dr | 0.30mi | 3/2.5 | 2,190 (+15%) | 1mo | $410,000 | $187 | 59 |
| 528 Carrera Dr | 0.32mi | 3/2.0 | 1,624 (-15%) | 2mo | $325,000 | $200 | 58 |
| 1952 Palo Alto Ave | 0.42mi | 2/2.0 (-1) | 2,162 (+13%) | 2mo | $485,000 | $224 | 52 |
Match score weights: distance 35% · size 25% · config 20% · recency 20%. Top-matched comps best support the ARV.
Projected returns pro-forma
-3.0% appreciation · 4.03% rent growth · sell at horizon
- IRR
- -18.7%
- Equity multiple
- 0.34×
- Total profit
- $-65,955
- Equity at exit
- $52,932
- IRR
- -9.2%
- Equity multiple
- 0.40×
- Total profit
- $-59,147
- Equity at exit
- $30,694
Cash invested: $99,400 (down + closing). Projections, not guarantees.
Landlord ↔ Tenant lean methodology
- Overall (STATE)
- 87 Strongly Landlord-Friendly
- State Florida
- 87 Strongly Landlord-Friendly · R+3
- County
- — inherits STATE
- City
- — inherits STATE
ZIP-level market 32159
- Home prices YoY
- -16.0%
- Rents YoY
- 4.0%
- Active inventory
- 576
- Price-to-rent
- 10.1×
Monthly cashflow live
- Estimated rent
- $2,939 high interval (Pro) →
- Mortgage (P&I)
- −$1,862
- Tax from tax record
- −$274 /mo · $3,287/yr
- Insurance
- −$148
- HOA
- −$220
- Vacancy / Maint / Mgmt
- −$617
- Net cashflow
- $-182
Break-even live
UW: 25.0% down · 7.5% · 30yr · 1.5% tax · 5.0% vac · 8.0% maint · 8.0% mgmt
Financing live
Cash to close
- Down payment
- $88,750
- Closing costs
- $10,650
- Reserves months
- —
- Total cash needed
- —
Loan-product check · same deal, 3 products live
Conventional
25% down · 7.5% · 30yr
- Down + closing
- —
- Monthly P&I
- —
- Monthly cashflow
- —
- DSCR
- —
- Eligible?
- —
Personal DTI + credit; lowest rate.
DSCR
20% down · 8.5% · 30yr
- Down + closing
- —
- Monthly P&I
- —
- Monthly cashflow
- —
- DSCR
- —
- Eligible?
- —
No personal income docs; deal must DSCR.
Hard money
10% down · 12.0% · 12mo
- Down + closing
- —
- Monthly P&I
- —
- Monthly cashflow
- —
- DSCR
- —
- Eligible?
- —
Short-term bridge; refi at stabilization.
Rent comps 19 comps
| Address | Beds | Baths | Sqft | Rent | $/sqft | DOM | Units | Dist |
|---|---|---|---|---|---|---|---|---|
| 1522 Yucatan Way Unit 1525265P Lady Lake, FL | 2.0 | 2.0 | 1732 | $1,829 | $1.06 | 21d | 1 | 0.21mi |
| 532 Carrera Dr Lady Lake, FL | 3.0 | 3.0 | 2312 | $3,500 | $1.51 | 21d | 1 | 0.30mi |
| 2002 Salinas Ave Lady Lake, FL | 3.0 | 2.0 | 1642 | $5,500 | $3.35 | 21d | 1 | 0.54mi |
| 1304 Santa Rosa Ct Lady Lake, FL | 2.0 | 2.0 | 1286 | $4,500 | $3.50 | 21d | 1 | 0.73mi |
| 2137 Gerardo Ave Lady Lake, FL | 3.0 | 2.0 | 1940 | $5,600 | $2.89 | 21d | 1 | 0.80mi |
| 623 Arteaga Way Unit 1525262P The Villages, FL | 3.0 | 2.0 | 1646 | $1,896 | $1.15 | 21d | 1 | 0.86mi |
| 2126 Sansores St Lady Lake, FL | 3.0 | 2.0 | 1748 | $3,700 | $2.12 | 21d | 1 | 0.93mi |
| 943 Mendoza Blvd Lady Lake, FL | 2.0 | 2.0 | 1268 | $5,800 | $4.57 | 24d | 1 | 0.94mi |
| 2006 Cardona Way Lady Lake, FL | 2.0 | 2.0 | 1428 | $3,900 | $2.73 | 21d | 1 | 1.07mi |
| 1314 Corona Ave Lady Lake, FL | 2.0 | 2.0 | 1656 | $2,500 | $1.51 | 21d | 1 | 1.09mi |
| 411 Del Mar Dr Lady Lake, FL | 3.0 | 2.0 | 1730 | $3,000 | $1.73 | 24d | 1 | 1.15mi |
| 932 Chula Ct Lady Lake, FL | 2.0 | 2.0 | 1346 | $3,000 | $2.23 | 3d | 1 | 1.21mi |
| 1205 Bower Ln Lady Lake, FL | 3.0 | 2.0 | 1866 | $2,750 | $1.47 | 24d | 1 | 1.22mi |
| 1377 Camero Dr Lady Lake, FL | 3.0 | 2.0 | 1462 | $5,500 | $3.76 | 21d | 1 | 1.33mi |
| 214 Palermo Pl Lady Lake, FL | 3.0 | 2.0 | 2452 | $3,500 | $1.43 | 24d | 1 | 1.40mi |
| 1505 Doria Ln Lady Lake, FL | 3.0 | 2.0 | 2048 | $3,500 | $1.71 | 21d | 1 | 1.40mi |
| 323 Chula Vista Ave Lady Lake, FL | 2.0 | 2.0 | 1486 | $2,700 | $1.82 | 24d | 1 | 1.40mi |
| 710 Cortez Ave Lady Lake, FL | 2.0 | 2.0 | 1564 | $2,500 | $1.60 | 24d | 1 | 1.45mi |
| 1401 W Schwartz Blvd Lady Lake, FL | 2.0 | 2.0 | 1552 | $1,999 | $1.29 | 24d | 1 | 1.46mi |
HOA detail
- Monthly dues
- $220 · $2,640/yr
Listing history 24 events
-
2026-06-19days on market $355,000 Active 32 DOM
-
2026-06-18days on market $355,000 Active 31 DOM
-
2026-06-17days on market $355,000 Active 30 DOM
-
2026-06-17price $355,000 Active 29 DOM
-
2026-06-16days on market $359,900 Active 29 DOM
-
2026-06-15days on market $359,900 Active 28 DOM
-
2026-06-14days on market $359,900 Active 26 DOM
-
2026-06-13days on market $359,900 Active 25 DOM
-
2026-06-10days on market $359,900 Active 23 DOM
-
2026-06-09days on market $359,900 Active 22 DOM
-
2026-06-08days on market $359,900 Active 21 DOM
-
2026-06-07days on market $359,900 Active 20 DOM
-
2026-06-02days on market $359,900 Active 15 DOM
-
2026-06-01days on market $359,900 Active 14 DOM
-
2026-05-31days on market $359,900 Active 13 DOM
-
2026-05-30days on market $359,900 Active 12 DOM
-
2026-05-18$359,900 Active
-
2026-03-30price $359,900
-
2026-03-19price $369,900
-
2026-01-30price $375,000
-
2025-12-04price $379,000
-
2025-11-06$385,000 Active
-
2023-11-13soldstatus $329,000
-
1997-02-24soldstatus $131,600
ⓘ Source: listings_history table (triggers on properties + properties_extension) + one-shot
backfill from property_details.listing_events for pre-trigger history.
Tax reassessment forecast FL · Resets to sale price
- Current annual tax
- $3,287 · $274/mo
- Projected year-2 tax
- $3,287 · $274/mo
- Expected delta
- $0/yr ($0/mo · 0.0%)
ⓘ Screening estimate from a state-policy table — verify with the county assessor before closing.
Climate risk First Street
- Flood 1/10 Low FEMA zone X (unshaded) · 0% chance over 30 yrs
- Wildfire 4/10 Moderate
- Heat 9/10 Extreme 7 d/yr ≥108°F today · 22 d/yr by 30 yrs out
- Wind 9/10 Extreme 99% chance of damaging wind over 30 yrs
- Air quality 3/10 Moderate 2 unhealthy d/yr today · 3 by 30 yrs out
Nearby sold comps map
Loading sold comps map…
Walkable amenities ~0.75 mi
Loading nearby amenities…
Taxation est. · year 1
- Rental income
- $35,265
- − Mortgage interest
- −$19,886
- − Property taxes
- −$3,287
- − Insurance
- −$1,775
- − Repairs & maintenance
- −$2,821
- − Management
- −$2,821
- − HOA
- −$2,640
- − Depreciation
- −$10,327
- Taxable loss
- −$8,292
- Est. tax savings @ 24.0%
- +$1,990
- After-tax cash flow
- $-192/yr
For passive investors: Depreciation is non-cash, so a rental often shows a tax loss while cash-flowing — sheltering income. Rental losses are passive: they offset passive income freely, and up to $25,000/yr can offset ordinary (W-2) income if you actively participate and your MAGI is under $100k (phasing out to $0 by $150k); unused losses carry forward. On sale, claimed depreciation is recaptured at up to 25%, and gains may owe capital-gains tax (a 1031 exchange can defer both). Figures are a year-1 estimate at your 24.0% rate — not tax advice; consult a CPA.
Schools (NCES district)
- District
- Sumter
- NCES district ID
- 1201800
- Math proficiency
- 61% ▼ -4.00%
- Reading proficiency
- 61% ▼ -2.00%
- Median HH income
- $48,240
- Composite
- 51.74/100
- National rank
- #1682
- State rank
- #11 of 73 in FL
Livability — The Villages
- Score
- 70/100
- State rank
- #431
- US rank
- #7363
Category grades
Schools grade is shown separately in the Schools card above.
Census & demographics
- Census place
- The Villages, FL
- County
- Lake County · 364,602 people
- City population
- 83,973
- Metro
- Orlando-Kissimmee-Sanford, FL
- Population (ZIP)
- 32,107
- Household income
- $58,518
- Rent vs Own
- Severe rent burden
- 1047.0
Population outlook (Sumter County) Hauer SSP2
- Today (2025)
- 161,172 people
- By 2030
- 180,083 · +11.7%
- By 2040
- 209,892 · +30.2%
- By 2050
- 234,186 · +45.3%
- By 2075
- 284,602 · +76.6%
- By 2100
- 317,039 · +96.7%
Race, ethnicity, and origin ACS 2023
- Neighborhood character
- Predominantly White (86%)
- Race & ethnicity
- White 86% Hispanic / Latino 6% Two or more races 5% Black 4% Asian 1%
- Hispanic origin (detail)
- Puerto Rican 3%
- Common ancestry
- Romanian 4% Lithuanian 3% Slovak 3%
- Foreign-born
- 5% · Canada, Jamaica
- Languages at home
- 93% English-only · Spanish 4% German/W. Germanic 1% Other Indo-European 1%
Political lean MEDSL · Sumter
- 2024 margin
- Solid R (+37.6) · D 30.9% · R 68.6%
- 2008→2024 swing
- -10.6pp toward R · 2008: -27.0pp · 2024: -37.6pp
- All cycles
- 2024: R+37.6 2020: R+36.1 2016: R+39.2 2012: R+34.9 2008: R+27.0
Not yet ingested
- Civics
- —
Market trends
- HPI YoY
- ▼ -45.24%
- Current HPI
- 237.6208
- Rent YoY
- ▲ 4.03%
- Metro
- Orlando-Kissimmee-Sanford, FL
- State GDP YoY
- ▲ 3.28%
- F500 in state
- 36
Industry mix (Fortune 500 HQ in FL)
| Industry | F500 HQs | Revenue |
|---|---|---|
| Industrial Technology | 2 | $29B |
|
||
| Insurance | 2 | $17B |
|
||
| Retail | 1 | $60B |
|
||
| Technology Distribution | 1 | $58B |
|
||
| Homebuilding | 1 | $35B |
|
||
| Technology Manufacturing | 1 | $35B |
|
||
Price history
+173.5% since first listed8 events — show timeline
- 2026-05-18 Listed $359,900 Stellar MLS as Distributed by MLS Grid
- 2026-03-30 Price Changed $359,900 Stellar MLS as Distributed by MLS Grid
- 2026-03-19 Price Changed $369,900 Stellar MLS as Distributed by MLS Grid
- 2026-01-30 Price Changed $375,000 Stellar MLS as Distributed by MLS Grid
- 2025-12-04 Price Changed $379,000 Stellar MLS as Distributed by MLS Grid
- 2025-11-06 Listed $385,000 Stellar MLS as Distributed by MLS Grid
- 2023-11-13 Sold (Public Records) $329,000 Public Records
- 1997-02-24 Sold (Public Records) $131,600 Public Records
Property tax history
+5.1%/yrLatest (2025): $3,287 · -0.7% YoY. Source: county tax records.
Cash-flow waterfall
monthlySold comps — $/sqft
last 12 mo · ≤1 miLoading sold comps…