 Multi-family
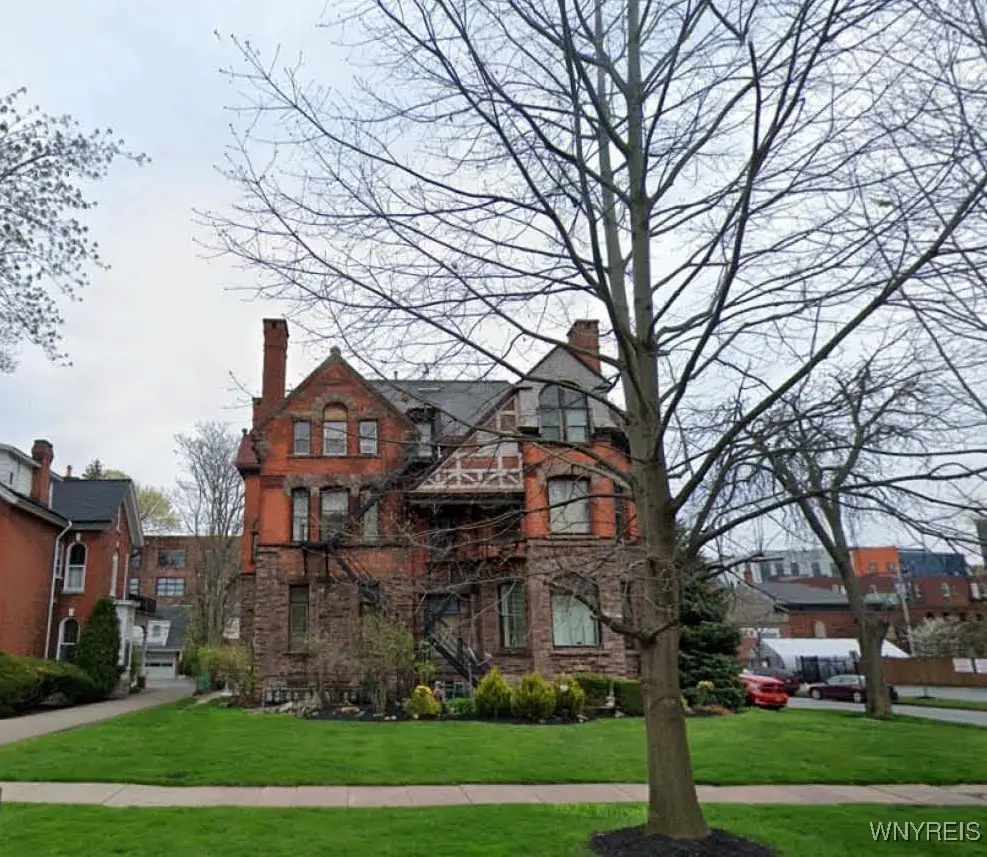
97 Linwood Ave · Buffalo, NY
Flood risk 1/10 · Minimal
- FEMA flood zone
- X (unshaded)
- Chance of flooding over 30 yrs
- 0.0%
- Est. flood insurance / yr
- $473 – $860
Fire risk 1/10 · Minimal
- Est. fire insurance / yr
- $691 – $1,283
Heat risk 3/10 · Minor
- Hot days now (above 91°F)
- 7 days/yr
- Hot days in 30 yrs
- 15 days/yr
Wind risk 1/10 · Minimal
- Chance of severe wind over 30 yrs
- —
Air-quality risk 4/10 · Minor
- Unhealthy air days now
- 4 days/yr
- Unhealthy air days in 30 yrs
- 9 days/yr
Risk factors via First Street. Map © Google.
Why this score? — see what drove the A grade
The composite is a weighted blend of 9 inputs, each scored 0–100. Each bar is that input's sub-score; the figure is the points it added to the 100-point composite (weight × sub-score).
- Cash flow +30.0/30.0
- ARV discount +15.0/15.0
- 1% rule +10.0/10.0
- DSCR +10.0/10.0
- Appreciation +5.9/10.0
- Rent growth +4.6/5.0
- Livability +3.9/5.0
- Schools +3.3/10.0
- Condition / age +2.5/5.0
$975,000
🖨 Deal sheet (PDF) 📄 Offer letter ✓ Due diligence
Multi-family units
County records classify this as Multi-Family (5+ Unit). Listing-text estimate: 1 unit. estimate disagrees with records
5+ unit building — per-unit beds/baths from public records are typically unavailable; the breakdown below (if shown) is an estimate from the listing text.
Listing remarks MLS
DESTINCTIVE LINWOOD MANSION -FEATURING 12 APARTMENTS, STUDIOS AND 1BEDROOM DESIGNS. SOME OFF-STREET PARKING AVAILABLE. 3 LEVELS, 4 UNITS ON EACH LEVEL, PLUS FINISHED BASEMENT WITH POSSIBLE 13TH “GARDEN LEVEL” UNIT. LANDLORD PAYS ELECTRIC AND WATER, TENANTS PAY HEAT. APPLIANCES INCLUDED, MOST BATHS WITH TUB AND SHOWERS AND SOME WITH JUST SHOWERS. THERE IS COIN LAUNDRY IN THE BASEMENT. UNITS ARE UNIQUES IN STYLE AND LAYOUT. CLOSE TO BUS LINE, BUFFALO CBD, BUFFALO MEDICAL CORRIDOR AND THE CANADIAN BOARDER.
Key facts
- 0.27 acre lot
- 3 parking spots
- Built 1900
Neighborhood map
What this means for you Summary
Snapshot
- This is a 9-bed/?-bath multifamily listed at $975k.
Deal economics
- At list price, monthly cash flow is $9k ($107k/yr) — positive.
- The deal already cash-flows at list — no discount required.
- Meets the 1% rule at list price ($19k rent vs $975k).
- Recommended offer: $858k (12.0% below list) — sets the bar for market timing.
- Cap rate 17.3% vs local median 8.1% in Buffalo — top-decile yield for the area; either an underpriced asset or a hidden risk that comps aren't pricing in. Stress-test before assuming the spread holds.
Location & tenants
- Location reads 77/100 on livability (#195 in NY, #3,011 nationally) — a middle-class / working-renter tenant base. Strengths: commute A+, housing A+, health & safety A+; Watch: crime F, employment D-.
- Buffalo City School District (urban): math 41% / reading 40% proficiency, ranked #535 of 590 in NY (top 91%) — families likely to look elsewhere, expect single-tenant / working-renter base with shorter leases; 75% free/reduced lunch — lower-income household profile, screen leases tightly.
- Zoned schools: International School (math 8% / reading 17%, grade F, #2,048 of 2,108 statewide, top 97%, 981 students, 92% FRL); Hutchinson Central Technical High School (math 96% / reading 32%, grade B-, #807 of 1,100 statewide, top 73%, 1,175 students, 78% FRL).
- Market conditions: Rents rising fast (+8.5%/yr); 56 active listings in the ZIP; 1,244 units permitted in Erie County in 2024 (563 in 5+ unit buildings).
- At $18,769/mo this rent would consume 450% of the median local household income ($50k/yr) (locally 959% of renters already pay >50% of income on rent) — very limited rent-growth headroom before tenants either downsize or default.
Forward outlook
- In year one you build about $25k of equity ($7k loan paydown + $18k appreciation (1.9% local appreciation)).
- At projected returns (1.9% appreciation + 8.0% rent growth), your $273k cash investment doubles in ~2 years — after that, you're playing with house money.
- By year 3, paydown + projected appreciation supports a ~$63k cash-out refi (75% LTV) — recoverable capital for the next deal without selling this one.
Negotiation context
- It's been on market 604 days — a 12% lower offer ($858k) is reasonable based on typical stale-listing flexibility.
- Current owner paid $360k; list at $975k implies a 171% gain — meaningful room to come down on a strong offer.
Risks & watch-outs
- Watch-outs: built in 1900 — expect roof / HVAC / electrical / plumbing capex.
Questions for the listing agent
- It's been on market 604 days. Have you received any prior offers? Is the seller open to a 12% concession, seller financing, or rate buy-down credit?
- Built in 1900 — when were the roof, HVAC, electrical panel, plumbing, and water heater last replaced?
- Why hasn't it sold? Are there any deal-killer items the seller is aware of (foundation, flood, title, zoning, code violations)?
- Is there a deadline driving the sale (1031 exchange, divorce, estate, relocation)? That informs how much negotiation room exists.
- Crime grade is F in this area — have there been break-ins, vandalism, or insurance claims at this property in the last 3 years? What carrier currently insures it and at what premium?
- What's the average days-on-market for RENTAL listings here right now (not sales)? A rising rental-DOM trend means longer vacancies and softer asking-rent achievability than the comps imply.
- What's the recent tenant-quality profile in this submarket — average credit score on applications, eviction rate, late-payment / NSF rate, and stable-employment percentage? A property-management company in the area should have these aggregated.
- How much new apartment / multifamily construction is in the pipeline within 1–3 miles? Heavy new supply (>2% of stock underway) typically softens rents 12–24 months out; light construction supports rent growth.
Investment metrics
- 1% rule
- 1.93% ✓
- Cap rate
- 17.28%
- Cash-on-cash
- 39.22%
- DSCR
- 2.75
- GRM
- 4.3
CMA / ARV
- ARV (median comp)
- $1,484,803
- List price
- $975,000
- Delta
- -34.33%
- Verdict
- UNDERPRICED
- Comps
- 8 within 1.0 mi
Projected returns pro-forma
1.86% appreciation · 8.0% rent growth · sell at horizon
- IRR
- 47.3%
- Equity multiple
- 3.66×
- Total profit
- $727,319
- Equity at exit
- $377,337
- IRR
- 50.4%
- Equity multiple
- 8.52×
- Total profit
- $2,052,135
- Equity at exit
- $537,872
Cash invested: $273,000 (down + closing). Projections, not guarantees.
Landlord ↔ Tenant lean methodology
- Overall (STATE)
- 15 Strongly Tenant-Friendly
- State New York
- 15 Strongly Tenant-Friendly · D+10
- County
- — inherits STATE
- City
- — inherits STATE
ZIP-level market 14209
- Home prices YoY
- 0.4%
- Rents YoY
- 8.5%
- Active inventory
- 56
- Price-to-rent
- 51.9×
Monthly cashflow live
- Estimated rent
- $18,769 high interval (Pro) →
- Mortgage (P&I)
- −$5,113
- Tax from tax record
- −$385 /mo · $4,624/yr
- Insurance
- −$406
- HOA
- −$0
- Lot rent
- −$0
- Vacancy / Maint / Mgmt
- −$3,941
- Net cashflow
- $8,923
Break-even live
Sensitivity live
| Price | -10% $9,475 | -5% $9,199 | +0% $8,923 | +5% $8,647 | +10% $8,371 |
|---|---|---|---|---|---|
| Rent | -10% $7,440 | -5% $8,182 | +0% $8,923 | +5% $9,664 | +10% $10,406 |
| Rate | -1.0pp $9,414 | -0.5pp $9,171 | base $8,923 | +0.5pp $8,670 | +1.0pp $8,413 |
12-unit breakdown (identical units grouped — click to expand)
| Units | Beds | Baths | Est. rent |
|---|---|---|---|
| 12× units | 1 | 1 | $18,768 |
| #1 | 1 | 1 | $1,564 |
| #2 | 1 | 1 | $1,564 |
| #3 | 1 | 1 | $1,564 |
| #4 | 1 | 1 | $1,564 |
| #5 | 1 | 1 | $1,564 |
| #6 | 1 | 1 | $1,564 |
| #7 | 1 | 1 | $1,564 |
| #8 | 1 | 1 | $1,564 |
| #9 | 1 | 1 | $1,564 |
| #10 | 1 | 1 | $1,564 |
| #11 | 1 | 1 | $1,564 |
| #12 | 1 | 1 | $1,564 |
| Total (12 units) | $18,769 | ||
UW: 25.0% down · 7.5% · 30yr · 1.5% tax · 5.0% vac · 8.0% maint · 8.0% mgmt
Financing live
Cash to close
- Down payment
- $243,750
- Closing costs
- $29,250
- Reserves months
- —
- Total cash needed
- —
Loan-product check · same deal, 3 products live
Conventional
25% down · 7.5% · 30yr
- Down + closing
- —
- Monthly P&I
- —
- Monthly cashflow
- —
- DSCR
- —
- Eligible?
- —
Personal DTI + credit; lowest rate.
DSCR
20% down · 8.5% · 30yr
- Down + closing
- —
- Monthly P&I
- —
- Monthly cashflow
- —
- DSCR
- —
- Eligible?
- —
No personal income docs; deal must DSCR.
Hard money
10% down · 12.0% · 12mo
- Down + closing
- —
- Monthly P&I
- —
- Monthly cashflow
- —
- DSCR
- —
- Eligible?
- —
Short-term bridge; refi at stabilization.
Listing history 22 events
-
2026-06-22days on market $975,000 Active 604 DOM
-
2026-06-21days on market $975,000 Active 603 DOM
-
2026-06-18days on market $975,000 Active 600 DOM
-
2026-06-17days on market $975,000 Active 599 DOM
-
2026-06-16days on market $975,000 Active 598 DOM
-
2026-06-15days on market $975,000 Active 597 DOM
-
2026-06-13days on market $975,000 Active 595 DOM
-
2026-06-13days on market $975,000 Active 594 DOM
-
2026-06-10days on market $975,000 Active 592 DOM
-
2026-06-09days on market $975,000 Active 591 DOM
-
2026-06-08days on market $975,000 Active 590 DOM
-
2026-06-07days on market $975,000 Active 589 DOM
-
2026-06-03days on market $975,000 Active 585 DOM
-
2026-06-02days on market $975,000 Active 584 DOM
-
2026-06-01days on market $975,000 Active 583 DOM
-
2026-05-31days on market $975,000 Active 582 DOM
-
2025-12-31price $975,000 520-char remark
Show marketing remark (520 chars)
DESTINCTIVE LINWOOD MANSION -FEATURING 12 APARTMENTS, STUDIOS AND 1BEDROOM DESIGNS. SOME OFF-STREET PARKING AVAILABLE. 3 LEVELS, 4 UNITS ON EACH LEVEL, PLUS FINISHED BASEMENT WITH POSSIBLE 13TH “GARDEN LEVEL” UNIT. LANDLORD PAYS ELECTRIC AND WATER, TENANTS PAY HEAT. APPLIANCES INCLUDED, MOST BATHS WITH TUB AND SHOWERS AND SOME WITH JUST SHOWERS. THERE IS COIN LAUNDRY IN THE BASEMENT. UNITS ARE UNIQUES IN STYLE AND LAYOUT. CLOSE TO BUS LINE, BUFFALO CBD, BUFFALO MEDICAL CORRIDOR AND THE CANADIAN BOARDER.
-
2025-03-31price $999,900 520-char remark
Show marketing remark (520 chars)
DESTINCTIVE LINWOOD MANSION -FEATURING 12 APARTMENTS, STUDIOS AND 1BEDROOM DESIGNS. SOME OFF-STREET PARKING AVAILABLE. 3 LEVELS, 4 UNITS ON EACH LEVEL, PLUS FINISHED BASEMENT WITH POSSIBLE 13TH “GARDEN LEVEL” UNIT. LANDLORD PAYS ELECTRIC AND WATER, TENANTS PAY HEAT. APPLIANCES INCLUDED, MOST BATHS WITH TUB AND SHOWERS AND SOME WITH JUST SHOWERS. THERE IS COIN LAUNDRY IN THE BASEMENT. UNITS ARE UNIQUES IN STYLE AND LAYOUT. CLOSE TO BUS LINE, BUFFALO CBD, BUFFALO MEDICAL CORRIDOR AND THE CANADIAN BOARDER.
-
2025-01-20price $1,025,000 520-char remark
Show marketing remark (520 chars)
DESTINCTIVE LINWOOD MANSION -FEATURING 12 APARTMENTS, STUDIOS AND 1BEDROOM DESIGNS. SOME OFF-STREET PARKING AVAILABLE. 3 LEVELS, 4 UNITS ON EACH LEVEL, PLUS FINISHED BASEMENT WITH POSSIBLE 13TH “GARDEN LEVEL” UNIT. LANDLORD PAYS ELECTRIC AND WATER, TENANTS PAY HEAT. APPLIANCES INCLUDED, MOST BATHS WITH TUB AND SHOWERS AND SOME WITH JUST SHOWERS. THERE IS COIN LAUNDRY IN THE BASEMENT. UNITS ARE UNIQUES IN STYLE AND LAYOUT. CLOSE TO BUS LINE, BUFFALO CBD, BUFFALO MEDICAL CORRIDOR AND THE CANADIAN BOARDER.
-
2024-10-26$1,100,000 Active 520-char remark
Show marketing remark (520 chars)
DESTINCTIVE LINWOOD MANSION -FEATURING 12 APARTMENTS, STUDIOS AND 1BEDROOM DESIGNS. SOME OFF-STREET PARKING AVAILABLE. 3 LEVELS, 4 UNITS ON EACH LEVEL, PLUS FINISHED BASEMENT WITH POSSIBLE 13TH “GARDEN LEVEL” UNIT. LANDLORD PAYS ELECTRIC AND WATER, TENANTS PAY HEAT. APPLIANCES INCLUDED, MOST BATHS WITH TUB AND SHOWERS AND SOME WITH JUST SHOWERS. THERE IS COIN LAUNDRY IN THE BASEMENT. UNITS ARE UNIQUES IN STYLE AND LAYOUT. CLOSE TO BUS LINE, BUFFALO CBD, BUFFALO MEDICAL CORRIDOR AND THE CANADIAN BOARDER.
-
2004-08-26soldstatus $360,000
-
1997-10-28soldstatus $120,000
ⓘ Source: listings_history table (triggers on properties + properties_extension) + one-shot
backfill from property_details.listing_events for pre-trigger history.
Tax reassessment forecast NY · Partial reset (capped growth)
- Current annual tax
- $4,624 · $385/mo
- Projected year-2 tax
- $10,551 · $879/mo
- Expected delta
- +$5,927/yr (+$494/mo · 128.2%)
ⓘ Screening estimate from a state-policy table — verify with the county assessor before closing.
Climate risk First Street
- Flood 1/10 Low FEMA zone X (unshaded) · 0% chance over 30 yrs
- Wildfire 1/10 Low
- Heat 3/10 Moderate 7 d/yr ≥91°F today · 15 d/yr by 30 yrs out
- Wind 1/10 Low
- Air quality 4/10 Moderate 4 unhealthy d/yr today · 9 by 30 yrs out
Nearby sold comps map
Loading sold comps map…
Walkable amenities ~0.75 mi
Loading nearby amenities…
Taxation est. · year 1
- Rental income
- $225,228
- − Mortgage interest
- −$54,615
- − Property taxes
- −$4,624
- − Insurance
- −$4,875
- − Repairs & maintenance
- −$18,018
- − Management
- −$18,018
- − Depreciation
- −$28,364
- Taxable income
- $96,714
- Est. tax owed @ 24.0%
- −$23,211
- After-tax cash flow
- $83,864/yr
For passive investors: Depreciation is non-cash, so a rental often shows a tax loss while cash-flowing — sheltering income. Rental losses are passive: they offset passive income freely, and up to $25,000/yr can offset ordinary (W-2) income if you actively participate and your MAGI is under $100k (phasing out to $0 by $150k); unused losses carry forward. On sale, claimed depreciation is recaptured at up to 25%, and gains may owe capital-gains tax (a 1031 exchange can defer both). Figures are a year-1 estimate at your 24.0% rate — not tax advice; consult a CPA.
Schools (NCES district)
- District
- Buffalo City School District
- NCES district ID
- 3605850
- Math proficiency
- 41% ▲ 11.00%
- Reading proficiency
- 40% ▲ 7.00%
- Median HH income
- $31,665
- Composite
- 33.17/100
- National rank
- #5544
- State rank
- #535 of 590 in NY
Livability — Buffalo
- Score
- 77/100
- State rank
- #195
- US rank
- #3011
Category grades
Schools grade is shown separately in the Schools card above.
Census & demographics
- Census place
- Buffalo, NY
- County
- Erie County · 714,559 people
- City population
- 440,021
- Metro
- Buffalo-Cheektowaga, NY
- Population (ZIP)
- 8,313
- Household income
- $50,046
- Rent vs Own
- Severe rent burden
- 959.0
Population outlook (Erie County) Hauer SSP2
- Today (2025)
- 933,037 people
- By 2030
- 935,181 · +0.2%
- By 2040
- 928,531 · -0.5%
- By 2050
- 905,725 · -2.9%
- By 2075
- 834,037 · -10.6%
- By 2100
- 708,033 · -24.1%
Race, ethnicity, and origin ACS 2023
- Neighborhood character
- Diverse neighborhood (Simpson 0.62)
- Race & ethnicity
- White 53% Black 30% Hispanic / Latino 11% Two or more races 5% Asian 3%
- Hispanic origin (detail)
- Puerto Rican 6% Dominican 1%
- Common ancestry
- Romanian 6% Lithuanian 2% Scotch-Irish 2%
- Foreign-born
- 9% · Canada, Dominican Republic, China
- Languages at home
- 88% English-only · Spanish 5% Other Indo-European 2% French/Haitian/Cajun 2%
Political lean MEDSL · Erie
- 2024 margin
- Lean D (+9.7) · D 54.8% · R 45.2%
- 2008→2024 swing
- -7.9pp toward R · 2008: 17.5pp · 2024: 9.7pp
- All cycles
- 2024: D+9.7 2020: D+14.7 2016: D+4.8 2012: D+15.6 2008: D+17.5
Not yet ingested
- Civics
- —
Market trends
- HPI YoY
- ▲ 1.86%
- Current HPI
- 443.9414
- Rent YoY
- ▲ 8.53%
- Metro
- Buffalo-Cheektowaga, NY
- State GDP YoY
- ▲ 2.60%
- F500 in state
- 92
Industry mix (Fortune 500 HQ in NY)
| Industry | F500 HQs | Revenue |
|---|---|---|
| Financial Services | 10 | $950B |
|
||
| Consumer Goods | 9 | $162B |
|
||
| Insurance | 4 | $225B |
|
||
| Telecommunications | 2 | $144B |
|
||
| Pharmaceuticals | 2 | $112B |
|
||
| Media / Entertainment | 2 | $69B |
|
||
Price history
+712.5% since first listed6 events — show timeline
- 2025-12-31 Price Changed $975,000 WNYREIS
- 2025-03-31 Price Changed $999,900 WNYREIS
- 2025-01-20 Price Changed $1,025,000 WNYREIS
- 2024-10-26 Listed $1,100,000 WNYREIS
- 2004-08-26 Sold (Public Records) $360,000 Public Records
- 1997-10-28 Sold (Public Records) $120,000 Public Records
Property tax history
+7.7%/yrLatest (2025): $4,624 · +0.0% YoY. Source: county tax records.
Cash-flow waterfall
monthlySold comps — $/sqft
last 12 mo · ≤1 miLoading sold comps…