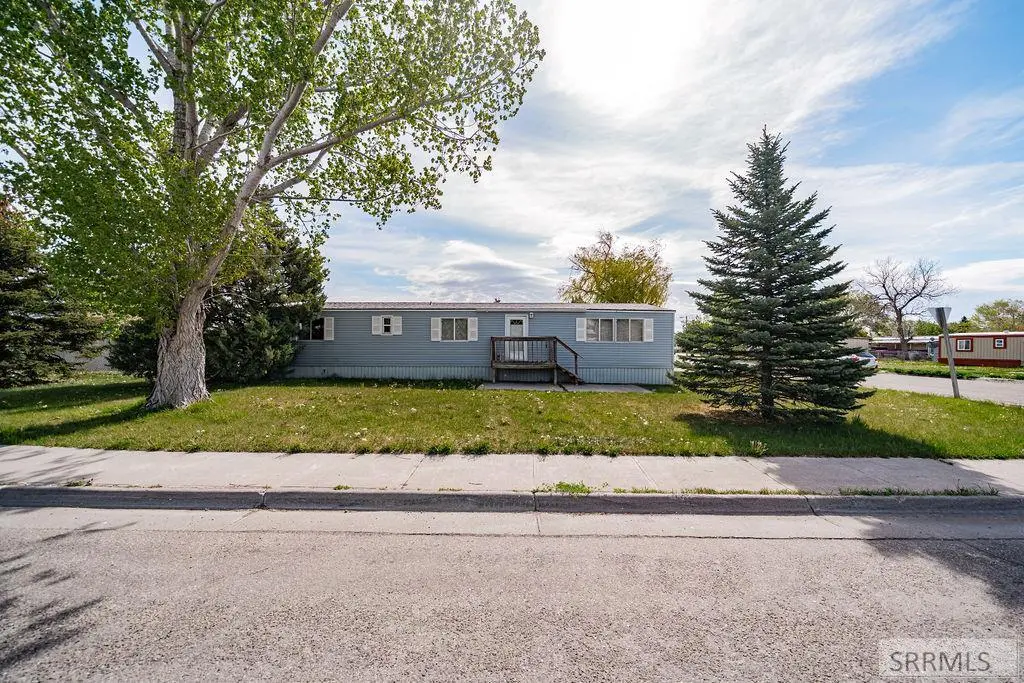
935 Eden Dr · Ammon, ID
Flood risk 1/10 · Minimal
- FEMA flood zone
- X
- Chance of flooding over 30 yrs
- 0.0%
- Est. flood insurance / yr
- $507 – $1,088
Fire risk 1/10 · Minimal
- Est. fire insurance / yr
- $584 – $1,086
Heat risk 3/10 · Minor
- Hot days now (above 91°F)
- 7 days/yr
- Hot days in 30 yrs
- 17 days/yr
Wind risk 1/10 · Minimal
- Chance of severe wind over 30 yrs
- —
Air-quality risk 4/10 · Minor
- Unhealthy air days now
- 5 days/yr
- Unhealthy air days in 30 yrs
- 6 days/yr
Risk factors via First Street. Map © Google.
Why this score? — see what drove the B grade
The composite is a weighted blend of 9 inputs, each scored 0–100. Each bar is that input's sub-score; the figure is the points it added to the 100-point composite (weight × sub-score).
- Cash flow +30.0/30.0
- 1% rule +10.0/10.0
- DSCR +10.0/10.0
- ARV discount +7.5/15.0
- Schools +4.2/10.0
- Livability +4.0/5.0
- Rent growth +2.6/5.0
- Condition / age +2.5/5.0
- Appreciation +0.0/10.0
$80,000
🖨 Deal sheet (PDF) 📄 Offer letter ✓ Due diligence
Listing remarks
Step into this spacious, clean and well-maintained home. The living room is light and bright. There is a large kitchen just of the family room. In unit laundry just off the bedrooms make chores a breeze. This home has two large bedrooms and full bath in addition to a primary suite with a 3/4 private bath for a total of three bedrooms. Situated on a corner lot with a fully fenced yard, off street parking and equipped with 3 sheds for added convenience. Low lot rent keeps expenses manageable. Take a look today.
Key facts
- Off street parking
- Large kitchen
- 3 sheds
Tags
Property features AI
Exterior
- Parking: Concrete parking
- Utilities: Public water; Public sewer
- Home design: Manufactured home (residential); Single-story
- Construction: Metal siding
- Exterior features: Chain-link fenced yard; Corner lot; Shed(s) on property
Interior
- Kitchen: Refrigerator included
- Bedrooms: One-level home (all rooms on main level)
- Flooring: Carpet flooring
- Bathrooms: 2 full bathrooms
- Heating & cooling: Central air conditioning; Electric forced-air heating
- Interior features: Laminate countertops; Crawl space
Neighborhood map
What this means for you Summary
Snapshot
- This is a 3-bed/2.0-bath manufactured listed at $80k.
Deal economics
- At list price, monthly cash flow is $503 ($6k/yr) — positive.
- The deal already cash-flows at list — no discount required.
- Meets the 1% rule at list price ($1k rent vs $80k).
Location & tenants
- Location reads 81/100 on livability (#12 in ID, #1,423 nationally) — a professional / high-income tenant draw. Strengths: housing A+, health & safety A+, crime A; Watch: amenities F, commute F.
- Bonneville Joint District (suburban): math 41% / reading 57% proficiency, ranked #30 of 92 in ID (top 33%) — families likely to look elsewhere, expect single-tenant / working-renter base with shorter leases.
- Zoned schools: Iona Elementary School (math 44% / reading 54%, grade D, #169 of 357 statewide, top 48%, 664 students, 24% FRL); Black Canyon Middle School (880 students, 30% FRL); Thunder Ridge High School (math 38% / reading 58%, grade D, #53 of 169 statewide, top 32%, 1,708 students, 23% FRL).
- Market conditions: Rents flat; 402 active listings in the ZIP; 2 comparable units currently listed for rent nearby; solid renter incomes; 2,253 units permitted in Bonneville County in 2024 (1,051 in 5+ unit buildings).
Forward outlook
- Local home prices are declining (-3.0%/yr); year-one equity from $553 of loan paydown is wiped out by about $2k of value loss. Plan a longer hold.
- Bonneville County population projected at +18% by 2050 — long-run rental-demand tailwind backs the buy-and-hold thesis.
- At projected returns (-3.0% appreciation + 0.5% rent growth), your $22k cash investment doubles in ~5 years — after that, you're playing with house money.
Negotiation context
- Only 6 days on market — expect competitive offers; lowballing is unlikely to land.
- Current owner paid $12k; list at $80k implies a 564% gain — meaningful room to come down on a strong offer.
Questions for the listing agent
- Built in 1979 — when were the roof, HVAC, electrical panel, plumbing, and water heater last replaced?
- Is there a deadline driving the sale (1031 exchange, divorce, estate, relocation)? That informs how much negotiation room exists.
- What's the average days-on-market for RENTAL listings here right now (not sales)? A rising rental-DOM trend means longer vacancies and softer asking-rent achievability than the comps imply.
- What's the recent tenant-quality profile in this submarket — average credit score on applications, eviction rate, late-payment / NSF rate, and stable-employment percentage? A property-management company in the area should have these aggregated.
- How much new for-sale + rental construction is in the pipeline within 1–3 miles? Heavy new supply typically softens prices + rents 12–24 months out; constrained supply supports both.
Investment metrics
- 1% rule
- 1.57% ✓
- Cap rate
- 13.84%
- Cash-on-cash
- 26.97%
- DSCR
- 2.20
- GRM
- 5.3
CMA / ARV
No comps found within radius.
Projected returns pro-forma
-3.0% appreciation · 0.51% rent growth · sell at horizon
- IRR
- 18.2%
- Equity multiple
- 1.71×
- Total profit
- $16,014
- Equity at exit
- $11,928
- IRR
- 24.9%
- Equity multiple
- 2.93×
- Total profit
- $43,186
- Equity at exit
- $6,917
Cash invested: $22,400 (down + closing). Projections, not guarantees.
Landlord ↔ Tenant lean methodology
- Overall (STATE)
- 91 Strongly Landlord-Friendly
- State Idaho
- 91 Strongly Landlord-Friendly · R+18
- County
- — inherits STATE
- City
- — inherits STATE
ZIP-level market 83401
- Home prices YoY
- -30.6%
- Rents YoY
- 0.5%
- Active inventory
- 402
- Price-to-rent
- 5.3×
Monthly cashflow live
- Estimated rent
- $1,252 medium interval (Pro) →
- Mortgage (P&I)
- −$420
- Tax from tax record
- −$33 /mo · $397/yr
- Insurance
- −$33
- HOA
- −$0
- Lot rent leased land?
- −$0
- Vacancy / Maint / Mgmt
- −$263
- Net cashflow
- $503
Break-even live
Sensitivity live
| Price | -10% $549 | -5% $526 | +0% $503 | +5% $481 | +10% $458 |
|---|---|---|---|---|---|
| Rent | -10% $404 | -5% $454 | +0% $503 | +5% $553 | +10% $602 |
| Rate | -1.0pp $544 | -0.5pp $524 | base $503 | +0.5pp $483 | +1.0pp $462 |
UW: 25.0% down · 7.5% · 30yr · 1.5% tax · 5.0% vac · 8.0% maint · 8.0% mgmt
Financing live
Cash to close
- Down payment
- $20,000
- Closing costs
- $2,400
- Reserves months
- —
- Total cash needed
- —
Loan-product check · same deal, 3 products live
Conventional
25% down · 7.5% · 30yr
- Down + closing
- —
- Monthly P&I
- —
- Monthly cashflow
- —
- DSCR
- —
- Eligible?
- —
Personal DTI + credit; lowest rate.
DSCR
20% down · 8.5% · 30yr
- Down + closing
- —
- Monthly P&I
- —
- Monthly cashflow
- —
- DSCR
- —
- Eligible?
- —
No personal income docs; deal must DSCR.
Hard money
10% down · 12.0% · 12mo
- Down + closing
- —
- Monthly P&I
- —
- Monthly cashflow
- —
- DSCR
- —
- Eligible?
- —
Short-term bridge; refi at stabilization.
Rent comps 2 comps
| Address | Beds | Baths | Sqft | Rent | $/sqft | DOM | Units | Dist |
|---|---|---|---|---|---|---|---|---|
| 1602 N Stevens Dr Unit C Idaho Falls, ID | 2.0 | 3.0 | 1192 | $1,695 | $1.42 | 16d | 1 | 0.44mi |
| 243 Bridger Dr Ammon, ID | 2.0 | 2.0 | 1149 | $1,350 | $1.17 | 23d | 1 | 0.63mi |
Listing history 3 events
-
2026-05-14status Pending
-
2026-05-08$80,000 Active
-
1997-04-01soldstatus $12,053
ⓘ Source: listings_history table (triggers on properties + properties_extension) + one-shot
backfill from property_details.listing_events for pre-trigger history.
Tax reassessment forecast ID · Resets to sale price
- Current annual tax
- $397 · $33/mo
- Projected year-2 tax
- $552 · $46/mo
- Expected delta
- +$155/yr (+$13/mo · 38.9%)
ⓘ Screening estimate from a state-policy table — verify with the county assessor before closing.
Climate risk First Street
- Flood 1/10 Low FEMA zone X · 0% chance over 30 yrs
- Wildfire 1/10 Low
- Heat 3/10 Moderate 7 d/yr ≥91°F today · 17 d/yr by 30 yrs out
- Wind 1/10 Low
- Air quality 4/10 Moderate 5 unhealthy d/yr today · 6 by 30 yrs out
Nearby sold comps map
Loading sold comps map…
Walkable amenities ~0.75 mi
Loading nearby amenities…
Taxation est. · year 1
- Rental income
- $15,028
- − Mortgage interest
- −$4,481
- − Property taxes
- −$397
- − Insurance
- −$400
- − Repairs & maintenance
- −$1,202
- − Management
- −$1,202
- − Depreciation
- −$2,327
- Taxable income
- $5,018
- Est. tax owed @ 24.0%
- −$1,204
- After-tax cash flow
- $4,836/yr
For passive investors: Depreciation is non-cash, so a rental often shows a tax loss while cash-flowing — sheltering income. Rental losses are passive: they offset passive income freely, and up to $25,000/yr can offset ordinary (W-2) income if you actively participate and your MAGI is under $100k (phasing out to $0 by $150k); unused losses carry forward. On sale, claimed depreciation is recaptured at up to 25%, and gains may owe capital-gains tax (a 1031 exchange can defer both). Figures are a year-1 estimate at your 24.0% rate — not tax advice; consult a CPA.
Schools (NCES district)
- District
- Bonneville Joint District
- NCES district ID
- 1600930
- Math proficiency
- 41% ▼ -2.00%
- Reading proficiency
- 57% ▲ 1.00%
- Median HH income
- $55,775
- Composite
- 42.45/100
- National rank
- #3219
- State rank
- #30 of 92 in ID
Livability — Ammon
- Score
- 81/100
- State rank
- #12
- US rank
- #1423
Category grades
Schools grade is shown separately in the Schools card above.
Census & demographics
- County
- Bonneville County · 125,162 people
- City population
- 19,696
- Metro
- Idaho Falls, ID
- Population (ZIP)
- 47,972
- Household income
- $78,497
- Rent vs Own
- Severe rent burden
- 422.0
Population outlook (Bonneville County) Hauer SSP2
- Today (2025)
- 120,170 people
- By 2030
- 124,993 · +4.0%
- By 2040
- 134,091 · +11.6%
- By 2050
- 142,122 · +18.3%
- By 2075
- 157,767 · +31.3%
- By 2100
- 160,316 · +33.4%
Race, ethnicity, and origin ACS 2023
- Neighborhood character
- Predominantly White (80%)
- Race & ethnicity
- White 80% Hispanic / Latino 15% Two or more races 8%
- Hispanic origin (detail)
- Mexican 11% Puerto Rican 1%
- Common ancestry
- Italian 4% Slovak 3% Portuguese 2%
- Foreign-born
- 4% · Canada
- Languages at home
- 90% English-only · Spanish 9%
Political lean MEDSL · Bonneville
- 2024 margin
- Solid R (+45.4) · D 25.6% · R 71.0% · Other 3.4%
- 2008→2024 swing
- -2.4pp toward R · 2008: -43.0pp · 2024: -45.4pp
- All cycles
- 2024: R+45.4 2020: R+43.6 2016: R+40.2 2012: R+51.8 2008: R+43.0
Not yet ingested
- Civics
- —
Market trends
- HPI YoY
- ▼ -164.87%
- Current HPI
- 374.2807
- Rent YoY
- ▲ 0.51%
- Metro
- Idaho Falls, ID
- State GDP YoY
- ▲ 4.51%
- F500 in state
- 6
Industry mix (Fortune 500 HQ in ID)
| Industry | F500 HQs | Revenue |
|---|---|---|
| Retail | 1 | $79B |
|
||
| Technology | 1 | $25B |
|
||
| Food / Agriculture | 1 | $6B |
|
||
Price history
+563.7% since first listed3 events — show timeline
- 2026-05-14 Pending — SRMLS
- 2026-05-08 Listed $80,000 SRMLS
- 1997-04-01 Sold (Public Records) $12,053 Public Records
Property tax history
+6.3%/yrLatest (2025): $397 · +21.2% YoY. Source: county tax records.
Cash-flow waterfall
monthlySold comps — $/sqft
last 12 mo · ≤1 miLoading sold comps…