 Triplex
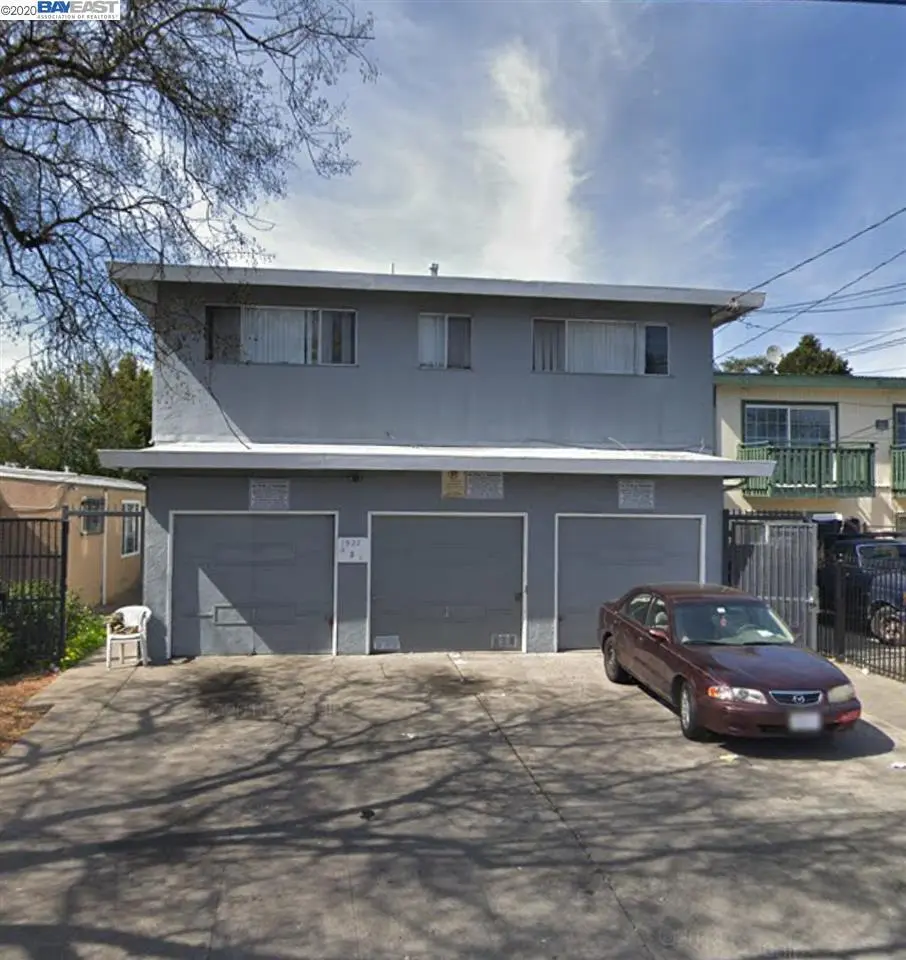
1927 82nd Ave · Oakland, CA
Flood risk 1/10 · Minimal
- FEMA flood zone
- X (shaded)
- Chance of flooding over 30 yrs
- 0.0%
- Est. flood insurance / yr
- $507 – $1,088
Fire risk 1/10 · Minimal
- Est. fire insurance / yr
- $659 – $1,223
Heat risk 4/10 · Minor
- Hot days now (above 84°F)
- 7 days/yr
- Hot days in 30 yrs
- 15 days/yr
Wind risk 1/10 · Minimal
- Chance of severe wind over 30 yrs
- —
Air-quality risk 8/10 · Major
- Unhealthy air days now
- 14 days/yr
- Unhealthy air days in 30 yrs
- 14 days/yr
Risk factors via First Street. Map © Google.
Why this score? — see what drove the C grade
The composite is a weighted blend of 9 inputs, each scored 0–100. Each bar is that input's sub-score; the figure is the points it added to the 100-point composite (weight × sub-score).
- Cash flow +25.4/30.0
- DSCR +8.4/10.0
- 1% rule +7.2/10.0
- ARV discount +4.9/15.0
- Rent growth +4.1/5.0
- Livability +3.6/5.0
- Schools +3.0/10.0
- Condition / age +2.5/5.0
- Appreciation +0.0/10.0
$675,000
🖨 Deal sheet 📄 Offer letter ✓ Due diligence
Multi-family units
County records classify this as Multi-Family (2-4 Unit). Listing-text estimate: 3 units. confirmed
Listing remarks
8% CAP. Three units, three long-term tenants, $6,343 in monthly rents and a 7.58% cap rate that's nearly impossible to find in today's Bay Area market. This well-maintained triplex in East Oakland's Arroyo Viejo neighborhood delivers $76,110 in gross annual income with a documented NOI of $52,684. The unit mix one 3BR/2BA and two 2BR/1BA features updated kitchens and baths, individual garage parking for each unit, and a gated entry. Minutes to Fruitvale and Coliseum BART, I-880, and I-580. Sewer lateral compliant and cash flowing from day one.
Key facts
- Updated baths
- Minutes to bart
- Updated kitchens
Tags
Property features AI
Finance
- Financial info: Income property with three leased units
- HOA & community: No association fee
Exterior
- Parking: Three parking spaces (see remarks for details)
- Home design: Triplex (residential income); Built in 1961
- Construction: Year built 1961
- Exterior features: Lot approximately 0.1148 acre (about 5,001 sq ft); No special lot features listed
Interior
- Bedrooms: Six total bedrooms; Unit 1: Two bedrooms; Unit 2: Two bedrooms; Unit 3: Two bedrooms
- Bathrooms: Three full bathrooms; Unit 1: One bathroom; Unit 2: One bathroom; Unit 3: Two bathrooms
- Interior features: Residential income property configured as a triplex; Three units total, none furnished; Three units currently leased
Neighborhood map
What this means for you Summary
Snapshot
- This is a 3 × 3.0-bed/2.0-bath units multifamily listed at $675k.
Deal economics
- At list price, monthly cash flow is $2k ($19k/yr) — positive. Per door: $519/mo.
- The deal already cash-flows at list — no discount required.
- Meets the 1% rule at list price ($8k rent vs $675k).
- Recommended offer: $665k (1.5% below list) — sets the bar for market timing.
- Cap rate 9.1% vs local median 2.4% in Oakland — top-decile yield for the area; either an underpriced asset or a hidden risk that comps aren't pricing in. Stress-test before assuming the spread holds.
Location & tenants
- Location reads 71/100 on livability (#224 in CA) — a middle-class / working-renter tenant base. Strengths: amenities A+, commute A+, employment A+; Watch: schools C-, crime F, cost of living F.
- Oakland Unified (urban): math 27% / reading 33% proficiency, ranked #1,007 of 1,400 in CA (top 72%) — families likely to look elsewhere, expect single-tenant / working-renter base with shorter leases; 68% free/reduced lunch — lower-income household profile, screen leases tightly.
- Market conditions: Rents rising fast (+6.5%/yr); 83 active listings in the ZIP; 1,742 units permitted in Alameda County in 2024 (856 in 5+ unit buildings).
- At $8,261/mo this rent would consume 190% of the median local household income ($52k/yr) (locally 2404% of renters already pay >50% of income on rent) — very limited rent-growth headroom before tenants either downsize or default.
Forward outlook
- Local home prices are declining (-3.0%/yr); year-one equity from $5k of loan paydown is wiped out by about $20k of value loss. Plan a longer hold.
- Alameda County population projected at +34% by 2050 — long-run rental-demand tailwind backs the buy-and-hold thesis.
- At projected returns (-3.0% appreciation + 6.5% rent growth), your $189k cash investment doubles in ~8 years — after that, you're playing with house money.
Negotiation context
- It's been on market 21 days — a 2% lower offer ($665k) is reasonable based on typical stale-listing flexibility.
- 2 sale attempts with the ask held roughly flat each time — persistent listings suggest the price (not the market) is what's stuck; bring a comps-based counter.
Questions for the listing agent
- Can we see the unit-by-unit rent roll, current vacancy, and any below-market leases? What's the average tenancy length?
- What capital expenditures (roof, boiler, parking lot, exteriors) have been made in the last 5 years, and what's planned in the next 2?
- Built in 1961 — when were the roof, HVAC, electrical panel, plumbing, and water heater last replaced?
- Is there a deadline driving the sale (1031 exchange, divorce, estate, relocation)? That informs how much negotiation room exists.
- Crime grade is F in this area — have there been break-ins, vandalism, or insurance claims at this property in the last 3 years? What carrier currently insures it and at what premium?
- What's the average days-on-market for RENTAL listings here right now (not sales)? A rising rental-DOM trend means longer vacancies and softer asking-rent achievability than the comps imply.
- What's the recent tenant-quality profile in this submarket — average credit score on applications, eviction rate, late-payment / NSF rate, and stable-employment percentage? A property-management company in the area should have these aggregated.
- How much new apartment / multifamily construction is in the pipeline within 1–3 miles? Heavy new supply (>2% of stock underway) typically softens rents 12–24 months out; light construction supports rent growth.
Investment metrics
- 1% rule
- 1.22% ✓
- Cap rate
- 9.06%
- Cash-on-cash
- 9.89%
- DSCR
- 1.44
- GRM
- 6.8
CMA / ARV
- ARV (median comp)
- $637,927
- List price
- $675,000
- Delta
- 5.81%
- Verdict
- FAIR
- Comps
- 20 within 1.0 mi
Show comp detail 7 sales within ~0.75 mi
| Address | Dist | Beds/Ba | Sqft | Sold | Price | $/sf | Match |
|---|---|---|---|---|---|---|---|
| 1749 84th Ave | 0.15mi | 8/4.0 (+1) | 3,456 (+2%) | 8mo | $870,000 | $252 | 78 |
| 1920 69th Ave | 0.71mi | 6/4.0 (-1) | 3,276 (-3%) | 4mo | $728,125 | $222 | 53 |
| 9318 Olive St | 0.69mi | 8/4.0 (+1) | 3,506 (+4%) | 6mo | $682,000 | $195 | 52 |
| 2020 81st Ave | 0.10mi | 8/5.0 (+1) | 3,868 (+14%) | 15mo | $1,130,000 | $292 | 50 |
| 2336 92nd Ave | 0.67mi | 8/4.0 (+1) | 3,346 (-1%) | 15mo | $750,000 | $224 | 49 |
| 2324 92nd Ave | 0.66mi | 8/4.0 (+1) | 3,346 (-1%) | 18mo | $855,000 | $256 | 47 |
| 8836 Dowling St | 0.54mi | 8/4.0 (+1) | 2,900 (-14%) | 19mo | $885,000 | $305 | 30 |
Match score weights: distance 35% · size 25% · config 20% · recency 20%. Top-matched comps best support the ARV.
Projected returns pro-forma
-3.0% appreciation · 6.45% rent growth · sell at horizon
- IRR
- 2.6%
- Equity multiple
- 1.10×
- Total profit
- $19,768
- Equity at exit
- $100,645
- IRR
- 15.4%
- Equity multiple
- 2.46×
- Total profit
- $276,875
- Equity at exit
- $58,362
Cash invested: $189,000 (down + closing). Projections, not guarantees.
Landlord ↔ Tenant lean methodology
- Overall (CITY)
- 0 Strongly Tenant-Friendly
- State California
- 18 Strongly Tenant-Friendly · D+13
- County
- — inherits STATE
- City Oakland
- 0 Strongly Tenant-Friendly · D+62
ZIP-level market 94621
- Rents YoY
- 6.5%
- Active inventory
- 83
- Price-to-rent
- 20.4×
Monthly cashflow live
- Estimated rent
- $8,261 high interval (Pro) →
- Mortgage (P&I)
- −$3,540
- Tax from tax record
- −$1,148 /mo · $13,778/yr
- Insurance
- −$281
- HOA
- −$0
- Vacancy / Maint / Mgmt
- −$1,735
- Net cashflow
- $1,557
Break-even live
3-unit breakdown (identical units grouped — click to expand)
| Units | Beds | Baths | Est. rent |
|---|---|---|---|
| 3× units | 3.0 | 2 | $8,262 |
| #1 | 3.0 | 2 | $2,754 |
| #2 | 3.0 | 2 | $2,754 |
| #3 | 3.0 | 2 | $2,754 |
| Total (3 units) | $8,261 | ||
UW: 25.0% down · 7.5% · 30yr · 1.5% tax · 5.0% vac · 8.0% maint · 8.0% mgmt
Financing live
Cash to close
- Down payment
- $168,750
- Closing costs
- $20,250
- Reserves months
- —
- Total cash needed
- —
Loan-product check · same deal, 3 products live
Conventional
25% down · 7.5% · 30yr
- Down + closing
- —
- Monthly P&I
- —
- Monthly cashflow
- —
- DSCR
- —
- Eligible?
- —
Personal DTI + credit; lowest rate.
DSCR
20% down · 8.5% · 30yr
- Down + closing
- —
- Monthly P&I
- —
- Monthly cashflow
- —
- DSCR
- —
- Eligible?
- —
No personal income docs; deal must DSCR.
Hard money
10% down · 12.0% · 12mo
- Down + closing
- —
- Monthly P&I
- —
- Monthly cashflow
- —
- DSCR
- —
- Eligible?
- —
Short-term bridge; refi at stabilization.
Listing history 49 events
-
2026-05-19price $675,000 552-char remark
-
2026-05-18status Active 552-char remark
-
2026-05-13price $640,000 552-char remark
-
2026-05-03$695,000 Active 552-char remark
-
2026-02-23historical
-
2026-01-27Active
-
2026-01-17historical
-
2026-01-10price
-
2025-12-20price
-
2025-12-10price
-
2025-11-24Active
-
2025-10-23historical
-
2025-10-02price
-
2025-10-01price
-
2025-09-03price
-
2025-08-28price
-
2025-08-21status Active
-
2025-08-21price
-
2025-08-01historical
-
2025-07-31price
-
2025-07-28price
-
2025-07-21status Active
-
2025-07-20historical Active Under Contract
-
2025-07-07Active
-
2025-06-25historical
-
2025-06-11price
-
2025-04-16price
-
2025-04-15Active
-
2020-03-13soldstatus $750,000 Sold
-
2020-03-13soldstatus $750,000
-
2020-02-22status Pending
-
2020-02-11$724,000 New
-
2012-05-07soldstatus $290,000 Sold
-
2012-05-07soldstatus $290,000 Sold
-
2012-05-07soldstatus $290,000
-
2012-03-28historical Contingent
-
2012-03-28historical Contingent
-
2012-03-03status Back On Market
-
2012-03-03status Back On Market
-
2012-01-27status Pending - Show for Backups
-
2012-01-27status Pending - Show for Backups
-
2012-01-20$299,000 New
-
2012-01-20$299,000 New
-
2011-04-27soldstatus $255,000 Sold
-
2011-04-27soldstatus $255,000
-
2011-03-25status Pending - Show for Backups
-
2011-03-07$325,000 New
-
2010-10-28soldstatus $175,000
-
1983-12-06soldstatus $125,000
ⓘ Source: listings_history table (triggers on properties + properties_extension) + one-shot
backfill from property_details.listing_events for pre-trigger history.
Tax reassessment forecast CA · Resets to sale price
- Current annual tax
- $13,778 · $1,148/mo
- Projected year-2 tax
- $13,778 · $1,148/mo
- Expected delta
- $0/yr ($0/mo · 0.0%)
ⓘ Screening estimate from a state-policy table — verify with the county assessor before closing.
Climate risk First Street
- Flood 1/10 Low FEMA zone X (shaded) · 0% chance over 30 yrs
- Wildfire 1/10 Low
- Heat 4/10 Moderate 7 d/yr ≥84°F today · 15 d/yr by 30 yrs out
- Wind 1/10 Low
- Air quality 8/10 Severe 14 unhealthy d/yr today · 14 by 30 yrs out
Nearby sold comps map
Loading sold comps map…
Walkable amenities ~0.75 mi
Loading nearby amenities…
Taxation est. · year 1
- Rental income
- $99,132
- − Mortgage interest
- −$37,810
- − Property taxes
- −$13,778
- − Insurance
- −$3,375
- − Repairs & maintenance
- −$7,931
- − Management
- −$7,931
- − Depreciation
- −$19,636
- Taxable income
- $8,671
- Est. tax owed @ 24.0%
- −$2,081
- After-tax cash flow
- $16,603/yr
For passive investors: Depreciation is non-cash, so a rental often shows a tax loss while cash-flowing — sheltering income. Rental losses are passive: they offset passive income freely, and up to $25,000/yr can offset ordinary (W-2) income if you actively participate and your MAGI is under $100k (phasing out to $0 by $150k); unused losses carry forward. On sale, claimed depreciation is recaptured at up to 25%, and gains may owe capital-gains tax (a 1031 exchange can defer both). Figures are a year-1 estimate at your 24.0% rate — not tax advice; consult a CPA.
Schools (NCES district)
- District
- Oakland Unified
- NCES district ID
- 0628050
- Math proficiency
- 27% ▬ 0.00%
- Reading proficiency
- 33% ▬ 0.00%
- Median HH income
- $55,194
- Composite
- 29.52/100
- National rank
- #11769
- State rank
- #1007 of 1400 in CA
Livability — Oakland
- Score
- 71/100
- State rank
- #224
- US rank
- #7245
Category grades
Schools grade is shown separately in the Schools card above.
Census & demographics
- Census place
- Oakland, CA
- County
- Alameda County · 1,614,355 people
- City population
- 385,993
- Metro
- San Francisco-Oakland-Berkeley, CA
- Population (ZIP)
- 33,840
- Household income
- $52,049
- Rent vs Own
- Severe rent burden
- 2404.0
Population outlook (Alameda County) Hauer SSP2
- Today (2025)
- 1,928,884 people
- By 2030
- 2,069,146 · +7.3%
- By 2040
- 2,338,405 · +21.2%
- By 2050
- 2,586,608 · +34.1%
- By 2075
- 3,061,911 · +58.7%
- By 2100
- 3,234,133 · +67.7%
Race, ethnicity, and origin ACS 2023
- Neighborhood character
- Majority Hispanic (63%)
- Race & ethnicity
- Hispanic / Latino 63% Black 24% Two or more races 14% White 6% Asian 4% Native American 2%
- Hispanic origin (detail)
- Mexican 41%
- Common ancestry
- Italian 1%
- Foreign-born
- 35% · Canada, China, Vietnam
- Languages at home
- 40% English-only · Spanish 53% Arabic 2% Other Asian/Pacific 2%
Political lean MEDSL · Alameda
- 2024 margin
- Solid D (+53.6) · D 74.6% · R 21.0% · Other 4.4%
- 2008→2024 swing
- -5.9pp toward R · 2008: 59.5pp · 2024: 53.6pp
- All cycles
- 2024: D+53.6 2020: D+62.5 2016: D+64.4 2012: D+59.8 2008: D+59.5
Not yet ingested
- Civics
- —
Market trends
- HPI YoY
- ▼ -346.43%
- Current HPI
- 523.2253
- Rent YoY
- ▲ 6.45%
- Metro
- San Francisco-Oakland-Berkeley, CA
- State GDP YoY
- ▲ 3.21%
- F500 in state
- 116
Industry mix (Fortune 500 HQ in CA)
| Industry | F500 HQs | Revenue |
|---|---|---|
| Technology | 27 | $1,492B |
|
||
| Financial Services | 3 | $174B |
|
||
| Retail | 3 | $44B |
|
||
| Insurance | 3 | $26B |
|
||
| Media / Entertainment | 2 | $115B |
|
||
| Pharmaceuticals / Biotech | 2 | $62B |
|
||
Price history
+440.0% since first listed9 events — show timeline
- 2026-05-19 Price Changed $675,000 San Francisco MLS
- 2026-05-18 Relisted — San Francisco MLS
- 2026-05-13 Price Changed $640,000 San Francisco MLS
- 2026-05-03 Listed $695,000 San Francisco MLS
- 2020-03-13 Sold (Public Records) $750,000 Public Records
- 2012-05-07 Sold (Public Records) $290,000 Public Records
- 2011-04-27 Sold (Public Records) $255,000 Public Records
- 2010-10-28 Sold (Public Records) $175,000 Public Records
- 1983-12-06 Sold (Public Records) $125,000 Public Records
Property tax history
+7.8%/yrLatest (2025): $13,778 · +4.1% YoY. Source: county tax records.
Cash-flow waterfall
monthlySold comps — $/sqft
last 12 mo · ≤1 miLoading sold comps…