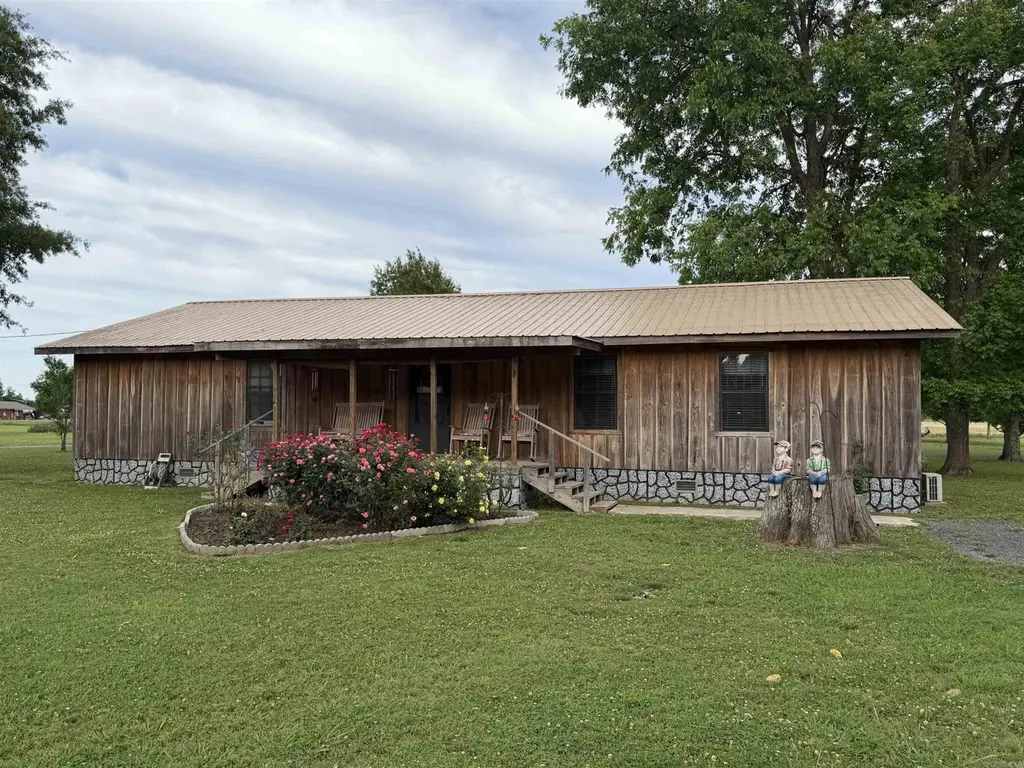
498 Wood St · Watson, AR
Flood risk No data
- FEMA flood zone
- —
- Chance of flooding over 30 yrs
- —
- Est. flood insurance / yr
- —
Fire risk No data
- Est. fire insurance / yr
- —
Heat risk No data
- Hot days now (above threshold)
- —
- Hot days in 30 yrs
- —
Wind risk No data
- Chance of severe wind over 30 yrs
- —
Air-quality risk No data
- Unhealthy air days now
- —
- Unhealthy air days in 30 yrs
- —
Risk factors via First Street. Map © Google.
Why this score? — see what drove the D+ grade
The composite is a weighted blend of 9 inputs, each scored 0–100. Each bar is that input's sub-score; the figure is the points it added to the 100-point composite (weight × sub-score).
- Cash flow +15.3/30.0
- ARV discount +7.5/15.0
- Appreciation +5.0/10.0
- DSCR +4.7/10.0
- 1% rule +4.2/10.0
- Livability +3.0/5.0
- Rent growth +2.5/5.0
- Condition / age +2.5/5.0
- Schools +1.9/10.0
$150,000
🖨 Deal sheet 📄 Offer letter ✓ Due diligence
Listing remarks
Situated on 3.6 acres, this unique property offers space, flexibility, and endless possibilities. Originally a 16x60 single-wide mobile home, it has been expanded into a spacious home featuring 4 bedrooms, 3.5 bathrooms, and approximately 2,112 heated square feet. The home also includes a separate dining room, large walk-in closet, and a walk-in safe room built within the home. Additional features include a gas ventless log fireplace, gas emergency heat unit, 25x24 carport, 22x12 screened-in porch, and a wood storage building. A standout feature of the property is the 40x50 metal shop with a 20x50 enclosed area and a 20x50 overhang. The enclosed portion is finished with beautiful cypress lu
Key facts
- 3.6 acres
- Separate dining room
- Walk-in closet
Tags
Property features AI
Finance
- Other: Approximately 3.6 acres
- Financial info: Financing available: VA, FHA, Conventional
- HOA & community: No-fee area amenities
Exterior
- Parking: Carport for 2 cars
- Utilities: Public water; Septic system
- Home design: Cypress exterior
- Construction: Crawl space foundation; Composition roof
- Exterior features: On a level lot; Shop; Paved road access; Inside city limits; No subdivision (Metes & Bounds)
Interior
- Kitchen: Free-standing stove; Dishwasher
- Flooring: Carpet; Wood
- Bathrooms: Three full bathrooms; One half bathroom
- Heating & cooling: Central electric heat; Central electric cooling; Window air conditioning units; Gas space heater
- Interior features: Gas log fireplace; Great room; Sun room; Workshop/Craft room
Neighborhood map
What this means for you Summary
Snapshot
- This is a 4-bed/3.5-bath manufactured listed at $150k.
Deal economics
- At list price, monthly cash flow is $54 ($654/yr) — positive.
- The deal already cash-flows at list — no discount required.
- To meet the 1% rule (rent ≥ 1% of price), the offer needs to be $138k (7.9% below list).
- Recommended offer: $138k (7.9% below list) — sets the bar for 1% rule.
Location & tenants
- Location reads 59/100 on livability (#284 in AR) — a working-class tenant base; expect higher turnover. Strengths: cost of living A+, housing A+, health & safety A+; Watch: schools F, crime F, amenities F.
- Mcgehee School District (town): math 24% / reading 23% proficiency, ranked #200 of 238 in AR (top 84%) — low school quality limits family demand, transient renter base, plan for 1-2y turnover; 66% free/reduced lunch — lower-income household profile, screen leases tightly.
- Market conditions: 1 active listings in the ZIP; 4 units permitted in Desha County in 2024 (0 in 5+ unit buildings).
Forward outlook
- In year one you build about $6k of equity ($1k loan paydown + $4k appreciation (3.0% local appreciation)).
- Desha County population projected at -31% by 2050 — secular population decline; favor cash flow + early exit over multi-decade hold.
- At projected returns (3.0% appreciation + 3.0% rent growth), your $42k cash investment doubles in ~6 years — after that, you're playing with house money.
- By year 7, paydown + projected appreciation supports a ~$35k cash-out refi (75% LTV) — recoverable capital for the next deal without selling this one.
Negotiation context
- It's been on market 41 days — a 3% lower offer ($146k) is reasonable based on typical stale-listing flexibility.
- Current owner paid $9k; list at $150k implies a 1567% gain — meaningful room to come down on a strong offer.
Questions for the listing agent
- It's been on market 41 days. Have you received any prior offers? Is the seller open to a 8% concession, seller financing, or rate buy-down credit?
- Is there a deadline driving the sale (1031 exchange, divorce, estate, relocation)? That informs how much negotiation room exists.
- Schools are F-rated, which usually means shorter tenancies and higher turnover. Who's the typical renter profile here, and what's been the actual vacancy rate?
- Crime grade is F in this area — have there been break-ins, vandalism, or insurance claims at this property in the last 3 years? What carrier currently insures it and at what premium?
- The area grade is low — what's the realistic commute time and amenity access for the typical tenant pool here? Any planned neighborhood developments (good or bad) we should know about?
- What's the average days-on-market for RENTAL listings here right now (not sales)? A rising rental-DOM trend means longer vacancies and softer asking-rent achievability than the comps imply.
- What's the recent tenant-quality profile in this submarket — average credit score on applications, eviction rate, late-payment / NSF rate, and stable-employment percentage? A property-management company in the area should have these aggregated.
- How much new for-sale + rental construction is in the pipeline within 1–3 miles? Heavy new supply typically softens prices + rents 12–24 months out; constrained supply supports both.
Investment metrics
- 1% rule
- 0.92% ✗
- Cap rate
- 6.73%
- Cash-on-cash
- 1.56%
- DSCR
- 1.07
- GRM
- 9.1
CMA / ARV
- ARV (median comp)
- $62,886
- List price
- $150,000
- Delta
- 138.53%
- Verdict
- OVERPRICED
- Comps
- 1 within 2.0 mi
Projected returns pro-forma
3.0% appreciation · 3.0% rent growth · sell at horizon
- IRR
- 9.0%
- Equity multiple
- 1.51×
- Total profit
- $21,560
- Equity at exit
- $67,446
- IRR
- 11.5%
- Equity multiple
- 2.71×
- Total profit
- $71,941
- Equity at exit
- $103,943
Cash invested: $42,000 (down + closing). Projections, not guarantees.
Landlord ↔ Tenant lean methodology
- Overall (STATE)
- 92 Strongly Landlord-Friendly
- State Arkansas
- 92 Strongly Landlord-Friendly · R+14
- County
- — inherits STATE
- City
- — inherits STATE
ZIP-level market 71674
- Active inventory
- 1
- Price-to-rent
- 9.1×
Monthly cashflow live
- Estimated rent
- $1,381 medium interval (Pro) →
- Mortgage (P&I)
- −$787
- Tax est. 1.5%
- −$188 /mo · $2,250/yr
- Insurance
- −$62
- HOA
- −$0
- Vacancy / Maint / Mgmt
- −$290
- Net cashflow
- $54
Break-even live
UW: 25.0% down · 7.5% · 30yr · 1.5% tax · 5.0% vac · 8.0% maint · 8.0% mgmt
Financing live
Cash to close
- Down payment
- $37,500
- Closing costs
- $4,500
- Reserves months
- —
- Total cash needed
- —
Loan-product check · same deal, 3 products live
Conventional
25% down · 7.5% · 30yr
- Down + closing
- —
- Monthly P&I
- —
- Monthly cashflow
- —
- DSCR
- —
- Eligible?
- —
Personal DTI + credit; lowest rate.
DSCR
20% down · 8.5% · 30yr
- Down + closing
- —
- Monthly P&I
- —
- Monthly cashflow
- —
- DSCR
- —
- Eligible?
- —
No personal income docs; deal must DSCR.
Hard money
10% down · 12.0% · 12mo
- Down + closing
- —
- Monthly P&I
- —
- Monthly cashflow
- —
- DSCR
- —
- Eligible?
- —
Short-term bridge; refi at stabilization.
Listing history 19 events
-
2026-06-19days on market $150,000 Active 41 DOM
-
2026-06-18days on market $150,000 Active 40 DOM
-
2026-06-17days on market $150,000 Active 39 DOM
-
2026-06-16days on market $150,000 Active 38 DOM
-
2026-06-15days on market $150,000 Active 37 DOM
-
2026-06-14days on market $150,000 Active 35 DOM
-
2026-06-12days on market $150,000 Active 34 DOM
-
2026-06-09days on market $150,000 Active 31 DOM
-
2026-06-08days on market $150,000 Active 30 DOM
-
2026-06-07days on market $150,000 Active 29 DOM
-
2026-06-07days on market $150,000 Active 28 DOM
-
2026-06-04days on market $150,000 Active 25 DOM
-
2026-06-02days on market $150,000 Active 24 DOM
-
2026-06-01days on market $150,000 Active 23 DOM
-
2026-05-31days on market $150,000 Active 22 DOM
-
2026-05-31days on market $150,000 Active 21 DOM
-
2026-05-09$150,000 New Listing 904-char remark
-
2005-05-04soldstatus $9,000
-
2002-11-01soldstatus $105,000
ⓘ Source: listings_history table (triggers on properties + properties_extension) + one-shot
backfill from property_details.listing_events for pre-trigger history.
Nearby sold comps map
Loading sold comps map…
Walkable amenities ~0.75 mi
Loading nearby amenities…
Taxation est. · year 1
- Rental income
- $16,573
- − Mortgage interest
- −$8,402
- − Property taxes
- −$2,250
- − Insurance
- −$750
- − Repairs & maintenance
- −$1,326
- − Management
- −$1,326
- − Depreciation
- −$4,364
- Taxable loss
- −$1,844
- Est. tax savings @ 24.0%
- +$443
- After-tax cash flow
- $1,096/yr
For passive investors: Depreciation is non-cash, so a rental often shows a tax loss while cash-flowing — sheltering income. Rental losses are passive: they offset passive income freely, and up to $25,000/yr can offset ordinary (W-2) income if you actively participate and your MAGI is under $100k (phasing out to $0 by $150k); unused losses carry forward. On sale, claimed depreciation is recaptured at up to 25%, and gains may owe capital-gains tax (a 1031 exchange can defer both). Figures are a year-1 estimate at your 24.0% rate — not tax advice; consult a CPA.
Schools (NCES district)
- District
- Mcgehee School District
- NCES district ID
- 0509630
- Math proficiency
- 24% ▼ -9.00%
- Reading proficiency
- 23% ▼ -8.00%
- Median HH income
- $29,604
- Composite
- 18.88/100
- National rank
- #8858
- State rank
- #200 of 238 in AR
Livability — Watson
- Score
- 59/100
- State rank
- #284
- US rank
- #19796
Category grades
Schools grade is shown separately in the Schools card above.
Census & demographics
- Census place
- Watson, AR
- Population (ZIP)
- 545
Population outlook (Desha County) Hauer SSP2
- Today (2025)
- 10,289 people
- By 2030
- 9,472 · -7.9%
- By 2040
- 8,102 · -21.3%
- By 2050
- 7,128 · -30.7%
- By 2075
- 6,222 · -39.5%
- By 2100
- 6,583 · -36.0%
Race, ethnicity, and origin ACS 2023
- Neighborhood character
- Predominantly White (95%)
- Race & ethnicity
- White 95% Black 5%
- Common ancestry
- Iranian 3%
Political lean MEDSL · Desha
- 2024 margin
- Toss-up / Even · D 46.7% · R 51.5% · Other 1.8%
- 2008→2024 swing
- -17.0pp toward R · 2008: 12.2pp · 2024: -4.8pp
- All cycles
- 2024: R+4.8 2020: D+2.3 2016: D+7.4 2012: D+12.9 2008: D+12.2
Not yet ingested
- Civics
- —
Market trends
- HPI YoY
- —
- Current HPI
- —
- Rent YoY
- —
- Metro
- —
- State GDP YoY
- ▲ 3.80%
- F500 in state
- 10
Industry mix (Fortune 500 HQ in AR)
| Industry | F500 HQs | Revenue |
|---|---|---|
| Retail | 1 | $681B |
|
||
| Food / Agriculture | 1 | $53B |
|
||
| Retail / Energy | 1 | $22B |
|
||
| Transportation / Logistics | 1 | $12B |
|
||
| Energy | 1 | $4B |
|
||
Price history
+42.9% since first listed3 events — show timeline
- 2026-05-09 Listed $150,000 CARMLS
- 2005-05-04 Sold (Public Records) $9,000 Public Records
- 2002-11-01 Sold (Public Records) $105,000 Public Records
Property tax history
+2.8%/yrLatest (2025): $67 · +0.0% YoY. Source: county tax records.
Cash-flow waterfall
monthlySold comps — $/sqft
last 12 mo · ≤1 miLoading sold comps…