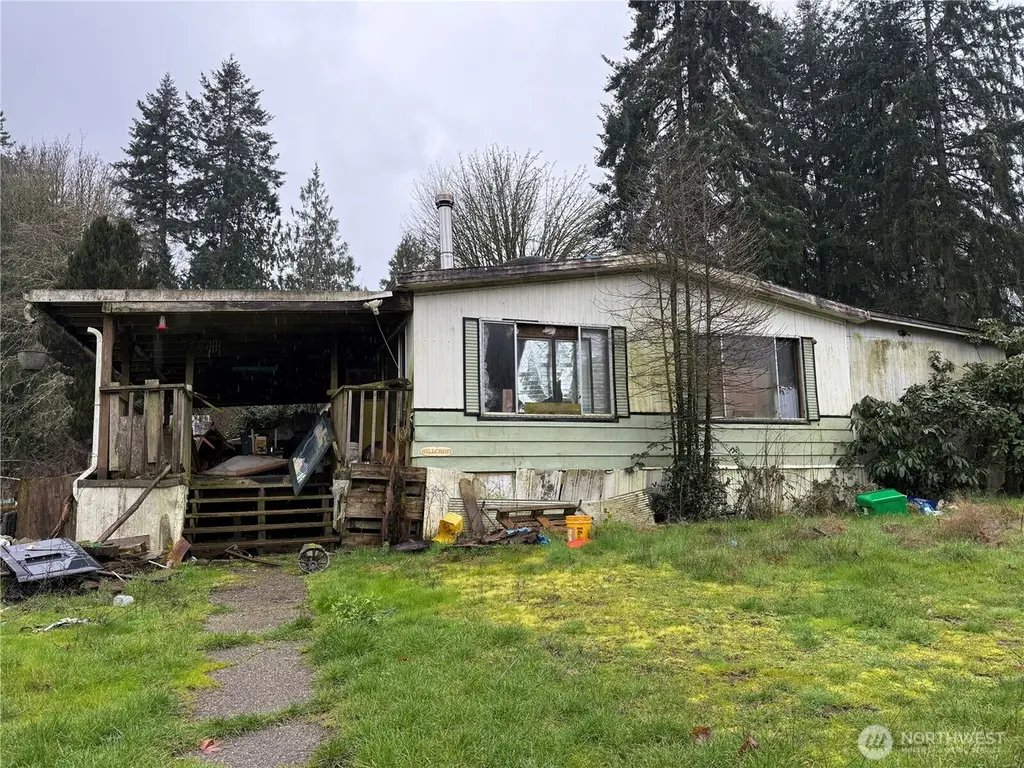
517 NW Past Dr · Poulsbo, WA
Flood risk 1/10 · Minimal
- FEMA flood zone
- X (unshaded)
- Chance of flooding over 30 yrs
- 0.0%
- Est. flood insurance / yr
- $507 – $1,088
Fire risk 3/10 · Minor
- Est. fire insurance / yr
- $604 – $1,122
Heat risk 3/10 · Minor
- Hot days now (above 85°F)
- 7 days/yr
- Hot days in 30 yrs
- 15 days/yr
Wind risk 1/10 · Minimal
- Chance of severe wind over 30 yrs
- —
Air-quality risk 6/10 · Moderate
- Unhealthy air days now
- 7 days/yr
- Unhealthy air days in 30 yrs
- 8 days/yr
Risk factors via First Street. Map © Google.
Why this score? — see what drove the C grade
The composite is a weighted blend of 9 inputs, each scored 0–100. Each bar is that input's sub-score; the figure is the points it added to the 100-point composite (weight × sub-score).
- Cash flow +22.5/30.0
- ARV discount +7.5/15.0
- DSCR +7.2/10.0
- Schools +5.4/10.0
- 1% rule +5.3/10.0
- Livability +4.2/5.0
- Rent growth +2.7/5.0
- Condition / age +2.5/5.0
- Appreciation +0.0/10.0
$265,000
🖨 Deal sheet (PDF) 📄 Offer letter ✓ Due diligence
Listing remarks
Situated on a 1.12-acre parcel with strong long-term investment potential. Sold AS-IS with no repairs to be made by the seller. Property currently has no power. For saftey please DO NOT ENTER THE BUILDING. Existing septic system is non-conforming, making this primarily a land-value opportunity best suited for cash buyers. Ideal for redevelopment, future investment hold, or a rehab project. Cash sale only — no seller financing, contingencies, or extended feasibility periods. Drive-by and exterior walk-arounds only. Great opportunity for investors, rehabbers, and cash buyers looking for their next project. Buyer to verify all information to their own satisfaction.
Key facts
- 1.12 acre lot
- Built 1976
- Listed 12 days
Property features AI
Finance
- Other: Zoned 1 dwelling unit per 5 acres; Lot size approximately 1.12 acres
- Financial info: Cash purchase preferred
Exterior
- Parking: Driveway parking
- Security: Partially fenced (security feature)
- Utilities: Electric service (PSE); Shared well water; Septic tank sewer
- Home design: Manufactured double-wide home; Single-story; Entry level on main floor; Facing direction not specified
- Construction: Double-wide manufactured home (Skyline); Standard frame construction; Metal/vinyl exterior; Composition roof; Tie-down foundation; Effective year built 1976
- Exterior features: Deck; Partially fenced lot; Dirt road access; Value in land
Interior
- Bedrooms: 3 bedrooms (all on main level); 2 additional possible bedrooms
- Flooring: Carpet flooring
- Bathrooms: 1 full bathroom (main level) with one tub and one shower
- Heating & cooling: No central heating; No cooling
- Interior features: Partially fenced
Neighborhood map
What this means for you Summary
Snapshot
- This is a 3-bed/1.0-bath manufactured listed at $265k.
Deal economics
- At list price, monthly cash flow is $446 ($5k/yr) — positive.
- The deal already cash-flows at list — no discount required.
- Meets the 1% rule at list price ($3k rent vs $265k).
- Cap rate 8.3% vs local median 2.7% in Poulsbo — top-decile yield for the area; either an underpriced asset or a hidden risk that comps aren't pricing in. Stress-test before assuming the spread holds.
Location & tenants
- Location reads 85/100 on livability (#30 in WA, #508 nationally) — a professional / high-income tenant draw. Strengths: amenities A+, commute A+, employment A+; Watch: cost of living F.
- North Kitsap School District (suburban): math 53% / reading 65% proficiency, ranked #54 of 291 in WA (top 19%) — acceptable for families but not a draw, mixed tenant base, ~2y average lease.
- Zoned schools: Vinland Elementary (523 students, 34% FRL); Poulsbo Middle School (685 students, 30% FRL); North Kitsap High School (1,063 students, 29% FRL).
- Market conditions: Rents flat; 270 active listings in the ZIP; 3 comparable units currently listed for rent nearby; rentals at typical pace (median 15d on market — plan ~3-4 weeks tenant-placement turnaround); high-income renter base; 1,294 units permitted in Kitsap County in 2024 (302 in 5+ unit buildings).
Forward outlook
- Local home prices are declining (-3.0%/yr); year-one equity from $2k of loan paydown is wiped out by about $8k of value loss. Plan a longer hold.
- Kitsap County population projected at +8% by 2050 — modest demand growth; plan on rents tracking national, not racing it.
Negotiation context
- Only 12 days on market — expect competitive offers; lowballing is unlikely to land.
Questions for the listing agent
- Built in 1976 — when were the roof, HVAC, electrical panel, plumbing, and water heater last replaced?
- Is there a deadline driving the sale (1031 exchange, divorce, estate, relocation)? That informs how much negotiation room exists.
- Schools are B-rated — typically a magnet for longer-tenancy family renters. What's the average tenant stay here, and is there a school-zone premium baked into asking?
- What's the average days-on-market for RENTAL listings here right now (not sales)? A rising rental-DOM trend means longer vacancies and softer asking-rent achievability than the comps imply.
- What's the recent tenant-quality profile in this submarket — average credit score on applications, eviction rate, late-payment / NSF rate, and stable-employment percentage? A property-management company in the area should have these aggregated.
- How much new for-sale + rental construction is in the pipeline within 1–3 miles? Heavy new supply typically softens prices + rents 12–24 months out; constrained supply supports both.
Investment metrics
- 1% rule
- 1.03% ✓
- Cap rate
- 8.31%
- Cash-on-cash
- 7.22%
- DSCR
- 1.32
- GRM
- 8.1
CMA / ARV
No comps found within radius.
Projected returns pro-forma
-3.0% appreciation · 0.71% rent growth · sell at horizon
- IRR
- -7.7%
- Equity multiple
- 0.72×
- Total profit
- $-20,691
- Equity at exit
- $39,512
- IRR
- -1.2%
- Equity multiple
- 0.92×
- Total profit
- $-5,613
- Equity at exit
- $22,912
Cash invested: $74,200 (down + closing). Projections, not guarantees.
Landlord ↔ Tenant lean methodology
- Overall (STATE)
- 28 Tenant-Leaning
- State Washington
- 28 Tenant-Leaning · D+8
- County
- — inherits STATE
- City
- — inherits STATE
ZIP-level market 98370
- Rents YoY
- 0.7%
- Active inventory
- 270
- Price-to-rent
- 8.1×
Monthly cashflow live
- Estimated rent
- $2,723 medium interval (Pro) →
- Mortgage (P&I)
- −$1,390
- Tax from tax record
- −$205 /mo · $2,462/yr
- Insurance
- −$110
- HOA
- −$0
- Vacancy / Maint / Mgmt
- −$572
- Net cashflow
- $446
Break-even live
Sensitivity live
| Price | -10% $596 | -5% $521 | +0% $446 | +5% $371 | +10% $296 |
|---|---|---|---|---|---|
| Rent | -10% $231 | -5% $339 | +0% $446 | +5% $554 | +10% $661 |
| Rate | -1.0pp $580 | -0.5pp $514 | base $446 | +0.5pp $378 | +1.0pp $308 |
UW: 25.0% down · 7.5% · 30yr · 1.5% tax · 5.0% vac · 8.0% maint · 8.0% mgmt
Financing live
Cash to close
- Down payment
- $66,250
- Closing costs
- $7,950
- Reserves months
- —
- Total cash needed
- —
Loan-product check · same deal, 3 products live
Conventional
25% down · 7.5% · 30yr
- Down + closing
- —
- Monthly P&I
- —
- Monthly cashflow
- —
- DSCR
- —
- Eligible?
- —
Personal DTI + credit; lowest rate.
DSCR
20% down · 8.5% · 30yr
- Down + closing
- —
- Monthly P&I
- —
- Monthly cashflow
- —
- DSCR
- —
- Eligible?
- —
No personal income docs; deal must DSCR.
Hard money
10% down · 12.0% · 12mo
- Down + closing
- —
- Monthly P&I
- —
- Monthly cashflow
- —
- DSCR
- —
- Eligible?
- —
Short-term bridge; refi at stabilization.
Rent comps 3 comps
| Address | Beds | Baths | Sqft | Rent | $/sqft | DOM | Units | Dist |
|---|---|---|---|---|---|---|---|---|
| 26277 Edgewater Pl NW Poulsbo, WA | 2.0 | 1.0 | 1112 | $2,250 | $2.02 | 22d | 1 | 1.26mi |
| 700 NW Advance Dr Poulsbo, WA | 1.0–3.0 | 1.0–2.5 | 1155 | $2,807 | $2.43 | 15d | 7 | 1.37mi |
| 22295 Dauntless Dr NW Poulsbo, WA | 2.0–3.0 | 2.0 | 1233 | $2,650 | $2.15 | 15d | 2 | 1.42mi |
Listing history 6 events
-
2026-06-07statusdays on market $265,000 Pending 12 DOM
-
2026-06-02days on market $265,000 Active 11 DOM
-
2026-06-01days on market $265,000 Active 10 DOM
-
2026-05-31days on market $265,000 Active 9 DOM
-
2026-05-30days on market $265,000 Active 8 DOM
-
2026-05-22$265,000 Active
ⓘ Source: listings_history table (triggers on properties + properties_extension) + one-shot
backfill from property_details.listing_events for pre-trigger history.
Tax reassessment forecast WA · Resets to sale price
- Current annual tax
- $2,462 · $205/mo
- Projected year-2 tax
- $2,597 · $216/mo
- Expected delta
- +$135/yr (+$11/mo · 5.5%)
ⓘ Screening estimate from a state-policy table — verify with the county assessor before closing.
Climate risk First Street
- Flood 1/10 Low FEMA zone X (unshaded) · 0% chance over 30 yrs
- Wildfire 3/10 Moderate
- Heat 3/10 Moderate 7 d/yr ≥85°F today · 15 d/yr by 30 yrs out
- Wind 1/10 Low
- Air quality 6/10 Major 7 unhealthy d/yr today · 8 by 30 yrs out
Nearby sold comps map
Loading sold comps map…
Walkable amenities ~0.75 mi
Loading nearby amenities…
Taxation est. · year 1
- Rental income
- $32,681
- − Mortgage interest
- −$14,844
- − Property taxes
- −$2,462
- − Insurance
- −$1,325
- − Repairs & maintenance
- −$2,614
- − Management
- −$2,614
- − Depreciation
- −$7,709
- Taxable income
- $1,112
- Est. tax owed @ 24.0%
- −$267
- After-tax cash flow
- $5,088/yr
For passive investors: Depreciation is non-cash, so a rental often shows a tax loss while cash-flowing — sheltering income. Rental losses are passive: they offset passive income freely, and up to $25,000/yr can offset ordinary (W-2) income if you actively participate and your MAGI is under $100k (phasing out to $0 by $150k); unused losses carry forward. On sale, claimed depreciation is recaptured at up to 25%, and gains may owe capital-gains tax (a 1031 exchange can defer both). Figures are a year-1 estimate at your 24.0% rate — not tax advice; consult a CPA.
Schools (NCES district)
- District
- North Kitsap School District
- NCES district ID
- 5305760
- Math proficiency
- 53% ▼ -1.00%
- Reading proficiency
- 65% ▲ 1.00%
- Median HH income
- $68,919
- Composite
- 53.68/100
- National rank
- #3092
- State rank
- #54 of 291 in WA
Livability — Poulsbo
- Score
- 85/100
- State rank
- #30
- US rank
- #508
Category grades
Schools grade is shown separately in the Schools card above.
Census & demographics
- County
- Kitsap County · 243,099 people
- City population
- 33,655
- Metro
- Bremerton-Silverdale-Port Orchard, WA
- Population (ZIP)
- 33,655
- Household income
- $116,756
- Rent vs Own
- Severe rent burden
- 904.0
Population outlook (Kitsap County) Hauer SSP2
- Today (2025)
- 277,525 people
- By 2030
- 285,040 · +2.7%
- By 2040
- 294,957 · +6.3%
- By 2050
- 300,622 · +8.3%
- By 2075
- 315,580 · +13.7%
- By 2100
- 304,340 · +9.7%
Race, ethnicity, and origin ACS 2023
- Neighborhood character
- Predominantly White (79%)
- Race & ethnicity
- White 79% Two or more races 11% Hispanic / Latino 9% Asian 3% Black 1%
- Hispanic origin (detail)
- Mexican 5%
- Common ancestry
- Portuguese 7% Italian 4% Slovak 3%
- Foreign-born
- 6% · Canada, South Korea
- Languages at home
- 93% English-only · Spanish 4% Other Indo-European 1% Other Asian/Pacific 1%
Political lean MEDSL · Kitsap
- 2024 margin
- Strong D (+20.9) · D 58.8% · R 37.9% · Other 3.3%
- 2008→2024 swing
- +8.6pp toward D · 2008: 12.3pp · 2024: 20.9pp
- All cycles
- 2024: D+20.9 2020: D+18.1 2016: D+11.6 2012: D+11.1 2008: D+12.3
Not yet ingested
- Civics
- —
Market trends
- HPI YoY
- ▼ -342.47%
- Current HPI
- 347.3427
- Rent YoY
- ▲ 0.71%
- Metro
- Bremerton-Silverdale-Port Orchard, WA
- State GDP YoY
- ▲ 4.65%
- F500 in state
- 22
Industry mix (Fortune 500 HQ in WA)
| Industry | F500 HQs | Revenue |
|---|---|---|
| Retail | 2 | $269B |
|
||
| Technology / Retail | 1 | $638B |
|
||
| Technology | 1 | $245B |
|
||
| Telecommunications | 1 | $38B |
|
||
| Food / Beverage | 1 | $36B |
|
||
| Automotive / Trucks | 1 | $34B |
|
||
Price history
1 event — show timeline
- 2026-05-22 Listed $265,000 NWMLS as Distributed by MLS Grid
Property tax history
+3.0%/yrLatest (2026): $2,462 · +2.2% YoY. Source: county tax records.
Cash-flow waterfall
monthlySold comps — $/sqft
last 12 mo · ≤1 miLoading sold comps…