 Duplex
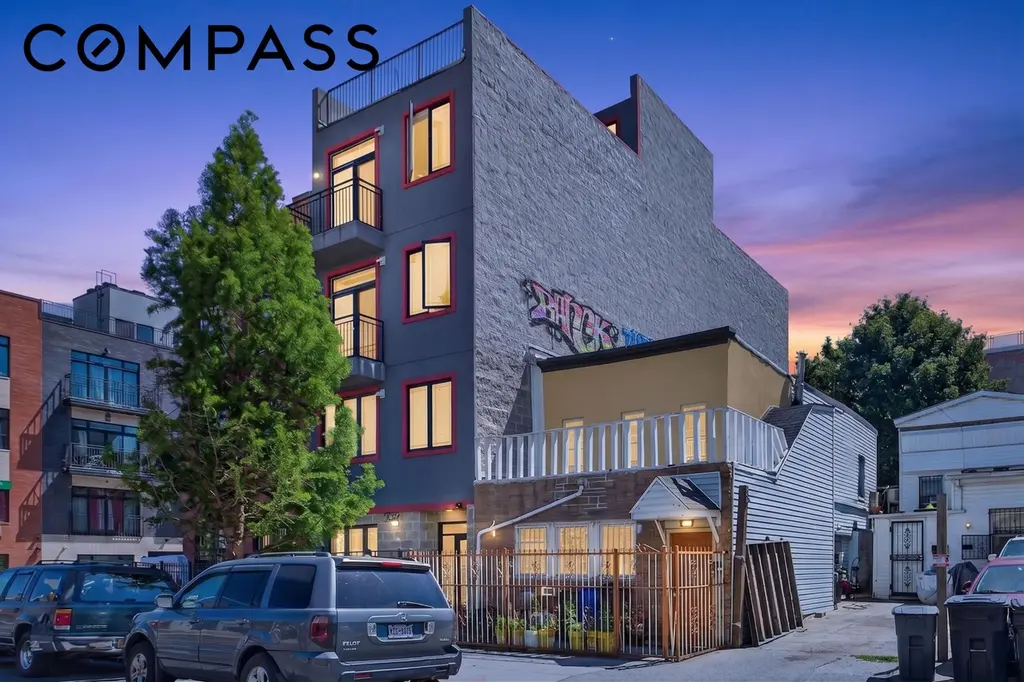
239 Buffalo Ave · New York, NY
Flood risk 1/10 · Minimal
- FEMA flood zone
- X (unshaded)
- Chance of flooding over 30 yrs
- 0.0%
- Est. flood insurance / yr
- $507 – $1,088
Fire risk 1/10 · Minimal
- Est. fire insurance / yr
- $691 – $1,283
Heat risk 7/10 · Major
- Hot days now (above 99°F)
- 7 days/yr
- Hot days in 30 yrs
- 15 days/yr
Wind risk 6/10 · Moderate
- Chance of severe wind over 30 yrs
- 64.0%
Air-quality risk 5/10 · Moderate
- Unhealthy air days now
- 6 days/yr
- Unhealthy air days in 30 yrs
- 8 days/yr
Risk factors via First Street. Map © Google.
Why this score? — see what drove the C grade
The composite is a weighted blend of 9 inputs, each scored 0–100. Each bar is that input's sub-score; the figure is the points it added to the 100-point composite (weight × sub-score).
- Cash flow +17.3/30.0
- Appreciation +10.0/10.0
- ARV discount +7.5/15.0
- DSCR +5.4/10.0
- Schools +5.0/10.0
- Rent growth +4.0/5.0
- Livability +3.8/5.0
- 1% rule +3.3/10.0
- Condition / age +2.5/5.0
$799,000
🖨 Deal sheet 📄 Offer letter ✓ Due diligence
Multi-family units
County records classify this as Multi-Family (2-4 Unit). Listing-text estimate: 2 units. confirmed
Listing remarks MLS
Fully renovated two-family house. This house features a three over two bedrooms with brand new boiler, hardwood floor, new kitchen appliances and counter tops. This house is conveniently located in a trendy up and coming area in Crown Heights Brooklyn. Walk just a few blocks to Eastern Pkwy for most public transportation and all. Why pay rent when you can own this property and collect rent in a booming area?. The owner price this property right for a quick sale. Agents bring your buyers showing is very easy.
Key facts
- Multiple floors
- Low taxes
- Cafes
Tags
Property features AI
Finance
- Other: Pets are not allowed
- Financial info: Annual tax amount: $1,884
- HOA & community: HOA/association fees billed monthly
Exterior
- Parking: Parking details not provided
- Security: Details not provided
- Utilities: Utilities details not provided
- Home design: 2-story property; Entry level: 1
- Construction: Construction details not provided
- Exterior features: Private outdoor space (over 60 sq ft); Private yard
Interior
- Kitchen: Kitchen details not provided
- Bedrooms: Details not provided
- Flooring: Details not provided
- Bathrooms: 2 full bathrooms
- Heating & cooling: Details not provided
- Interior features: Unfurnished; Total of 8 rooms; Two separate residential units in the building
- Laundry & utility: Laundry: see remarks
Neighborhood map
What this means for you Summary
Snapshot
- This is a 2 × 2-bed/1.0-bath units multifamily listed at $799k.
Deal economics
- At list price, monthly cash flow is $587 ($7k/yr) — positive. Per door: $294/mo.
- The deal already cash-flows at list — no discount required.
- To meet the 1% rule (rent ≥ 1% of price), the offer needs to be $666k (16.6% below list).
- Recommended offer: $666k (16.6% below list) — sets the bar for 1% rule.
- Cap rate 7.2% vs local median 2.6% in New York — top-decile yield for the area; either an underpriced asset or a hidden risk that comps aren't pricing in. Stress-test before assuming the spread holds.
Location & tenants
- Location reads 75/100 on livability (#268 in NY, #4,188 nationally) — a middle-class / working-renter tenant base. Strengths: amenities A+, commute A+, health & safety A; Watch: crime F, cost of living F.
- Market conditions: Rents rising fast (+6.0%/yr); 73 active listings in the ZIP; 13 comparable units currently listed for rent nearby; rentals at typical pace (median 21d on market — plan ~3-4 weeks tenant-placement turnaround); 10,063 units permitted in Kings County in 2024 (9,789 in 5+ unit buildings).
- At $6,665/mo this rent would consume 123% of the median local household income ($65k/yr) (locally 6603% of renters already pay >50% of income on rent) — very limited rent-growth headroom before tenants either downsize or default.
Forward outlook
- In year one you build about $85k of equity ($6k loan paydown + $80k appreciation (10.0% local appreciation)).
- Kings County population projected at +13% by 2050 — modest demand growth; plan on rents tracking national, not racing it.
- At projected returns (10.0% appreciation + 6.0% rent growth), your $224k cash investment doubles in ~3 years — after that, you're playing with house money.
- By year 2, paydown + projected appreciation supports a ~$137k cash-out refi (75% LTV) — recoverable capital for the next deal without selling this one.
Negotiation context
- Only 14 days on market — expect competitive offers; lowballing is unlikely to land.
- 2 sale attempts since 11y ago with the ask held roughly flat each time — persistent listings suggest the price (not the market) is what's stuck; bring a comps-based counter.
- Current owner paid $464k; list at $799k implies a 72% gain — meaningful room to come down on a strong offer.
Risks & watch-outs
- Watch-outs: built in 1910 — expect roof / HVAC / electrical / plumbing capex.
- Climate carrying-cost: major wind risk, 64% chance of damaging wind over 30y; extreme-heat days projected 7→15/yr by 2055 (HVAC capex compounding) — expect insurance premiums to compound above CPI over the hold.
Questions for the listing agent
- Can we see the unit-by-unit rent roll, current vacancy, and any below-market leases? What's the average tenancy length?
- What capital expenditures (roof, boiler, parking lot, exteriors) have been made in the last 5 years, and what's planned in the next 2?
- Built in 1910 — when were the roof, HVAC, electrical panel, plumbing, and water heater last replaced?
- Is there a deadline driving the sale (1031 exchange, divorce, estate, relocation)? That informs how much negotiation room exists.
- Schools are B-rated — typically a magnet for longer-tenancy family renters. What's the average tenant stay here, and is there a school-zone premium baked into asking?
- Crime grade is F in this area — have there been break-ins, vandalism, or insurance claims at this property in the last 3 years? What carrier currently insures it and at what premium?
- What's the average days-on-market for RENTAL listings here right now (not sales)? A rising rental-DOM trend means longer vacancies and softer asking-rent achievability than the comps imply.
- What's the recent tenant-quality profile in this submarket — average credit score on applications, eviction rate, late-payment / NSF rate, and stable-employment percentage? A property-management company in the area should have these aggregated.
- How much new apartment / multifamily construction is in the pipeline within 1–3 miles? Heavy new supply (>2% of stock underway) typically softens rents 12–24 months out; light construction supports rent growth.
Investment metrics
- 1% rule
- 0.83% ✗
- Cap rate
- 7.18%
- Cash-on-cash
- 3.15%
- DSCR
- 1.14
- GRM
- 10.0
CMA / ARV
No comps found within radius.
Projected returns pro-forma
10.0% appreciation · 5.95% rent growth · sell at horizon
- IRR
- 27.5%
- Equity multiple
- 3.20×
- Total profit
- $492,513
- Equity at exit
- $719,803
- IRR
- 24.7%
- Equity multiple
- 7.56×
- Total profit
- $1,466,675
- Equity at exit
- $1,552,281
Cash invested: $223,720 (down + closing). Projections, not guarantees.
Landlord ↔ Tenant lean methodology
- Overall (CITY)
- 0 Strongly Tenant-Friendly
- State New York
- 15 Strongly Tenant-Friendly · D+10
- County
- — inherits STATE
- City New York
- 0 Strongly Tenant-Friendly · D+34
ZIP-level market 11213
- Home prices YoY
- 4.3%
- Rents YoY
- 6.0%
- Active inventory
- 73
- Price-to-rent
- 20.0×
Monthly cashflow live
- Estimated rent
- $6,665 high interval (Pro) →
- Mortgage (P&I)
- −$4,190
- Tax from tax record
- −$155 /mo · $1,861/yr
- Insurance
- −$333
- HOA
- −$0
- Vacancy / Maint / Mgmt
- −$1,400
- Net cashflow
- $587
Break-even live
2-unit breakdown (identical units grouped — click to expand)
| Units | Beds | Baths | Est. rent |
|---|---|---|---|
| 2× units | 2 | 1 | $6,664 |
| #1 | 2 | 1 | $3,332 |
| #2 | 2 | 1 | $3,332 |
| Total (2 units) | $6,665 | ||
UW: 25.0% down · 7.5% · 30yr · 1.5% tax · 5.0% vac · 8.0% maint · 8.0% mgmt
Financing live
Cash to close
- Down payment
- $199,750
- Closing costs
- $23,970
- Reserves months
- —
- Total cash needed
- —
Loan-product check · same deal, 3 products live
Conventional
25% down · 7.5% · 30yr
- Down + closing
- —
- Monthly P&I
- —
- Monthly cashflow
- —
- DSCR
- —
- Eligible?
- —
Personal DTI + credit; lowest rate.
DSCR
20% down · 8.5% · 30yr
- Down + closing
- —
- Monthly P&I
- —
- Monthly cashflow
- —
- DSCR
- —
- Eligible?
- —
No personal income docs; deal must DSCR.
Hard money
10% down · 12.0% · 12mo
- Down + closing
- —
- Monthly P&I
- —
- Monthly cashflow
- —
- DSCR
- —
- Eligible?
- —
Short-term bridge; refi at stabilization.
Rent comps 13 comps
| Address | Beds | Baths | Sqft | Rent | $/sqft | DOM | Units | Dist |
|---|---|---|---|---|---|---|---|---|
| 819 Saratoga Ave Brooklyn, NY | 3.0 | 1.5 | 1300 | $3,350 | $2.58 | 24d | 1 | 0.89mi |
| 1066 Putnam Ave Brooklyn, NY | 4.0 | 2.0 | 647 | $1,110 | $1.71 | 5d | 1 | 1.17mi |
| 22 Granite St Brooklyn, NY | 4.0 | 2.0 | 586 | $1,150 | $1.96 | 4d | 1 | 1.19mi |
| 951 Madison St Brooklyn, NY | 5.0 | 1.0 | 650 | $1,280 | $1.97 | 5d | 1 | 1.25mi |
| 951 Madison St Brooklyn, NY | 4.0 | 1.0 | 1000 | $1,260 | $1.26 | 24d | 1 | 1.25mi |
| 448 Empire Blvd Brooklyn, NY | 4.0 | 2.0 | 592 | $1,170 | $1.97 | 5d | 1 | 1.27mi |
| 705 Saint Marks Ave Brooklyn, NY | 4.0 | 2.0 | 650 | $1,100 | $1.69 | 20d | 1 | 1.32mi |
| 105 Weirfield St Brooklyn, NY | 5.0 | 2.0 | 660 | $1,190 | $1.80 | 5d | 1 | 1.37mi |
| 533 Nostrand Ave Brooklyn, NY | 4.0 | 1.0 | 690 | $1,300 | $1.88 | 20d | 1 | 1.40mi |
| 762 Park Pl Unit 3B Brooklyn, NY | 3.0 | 2.0 | 1114 | $5,400 | $4.85 | 24d | 1 | 1.45mi |
| 1083 Thomas S Boyland St Unit 2 Brooklyn, NY | 4.0 | 1.0 | 1100 | $3,600 | $3.27 | 24d | 1 | 1.45mi |
| 148 Cornelia St Brooklyn, NY | 4.0 | 1.0 | 652 | $1,190 | $1.82 | 20d | 1 | 1.49mi |
| 104 Rogers Ave Brooklyn, NY | 4.0 | 2.0 | 550 | $1,250 | $2.27 | 20d | 1 | 1.49mi |
Listing history 9 events
-
2026-06-18days on market $799,000 Active 14 DOM
-
2026-06-17days on market $799,000 Active 13 DOM
-
2026-06-16days on market $799,000 Active 12 DOM
-
2026-06-15days on market $799,000 Active 11 DOM
-
2026-06-13days on market $799,000 Active 9 DOM
-
2026-06-09days on market $799,000 Active 5 DOM
-
2026-06-08days on market $799,000 Active 4 DOM
-
2026-06-07remarks 438-char remark
-
2026-06-07$799,000 Active 3 DOM
ⓘ Source: listings_history table (triggers on properties + properties_extension) + one-shot
backfill from property_details.listing_events for pre-trigger history.
Tax reassessment forecast NY · Partial reset (capped growth)
- Current annual tax
- $1,861 · $155/mo
- Projected year-2 tax
- $7,682 · $640/mo
- Expected delta
- +$5,821/yr (+$485/mo · 312.9%)
ⓘ Screening estimate from a state-policy table — verify with the county assessor before closing.
Climate risk First Street
- Flood 1/10 Low FEMA zone X (unshaded) · 0% chance over 30 yrs
- Wildfire 1/10 Low
- Heat 7/10 Severe 7 d/yr ≥99°F today · 15 d/yr by 30 yrs out
- Wind 6/10 Major 64% chance of damaging wind over 30 yrs
- Air quality 5/10 Major 6 unhealthy d/yr today · 8 by 30 yrs out
Nearby sold comps map
Loading sold comps map…
Walkable amenities ~0.75 mi
Loading nearby amenities…
Taxation est. · year 1
- Rental income
- $79,980
- − Mortgage interest
- −$44,756
- − Property taxes
- −$1,861
- − Insurance
- −$3,995
- − Repairs & maintenance
- −$6,398
- − Management
- −$6,398
- − Depreciation
- −$23,244
- Taxable loss
- −$6,672
- Est. tax savings @ 24.0%
- +$1,601
- After-tax cash flow
- $8,650/yr
For passive investors: Depreciation is non-cash, so a rental often shows a tax loss while cash-flowing — sheltering income. Rental losses are passive: they offset passive income freely, and up to $25,000/yr can offset ordinary (W-2) income if you actively participate and your MAGI is under $100k (phasing out to $0 by $150k); unused losses carry forward. On sale, claimed depreciation is recaptured at up to 25%, and gains may owe capital-gains tax (a 1031 exchange can defer both). Figures are a year-1 estimate at your 24.0% rate — not tax advice; consult a CPA.
Schools (NCES district)
No district data.
Livability — New York
- Score
- 75/100
- State rank
- #268
- US rank
- #4188
Category grades
Schools grade is shown separately in the Schools card above.
Census & demographics
- Census place
- New York, NY
- County
- Kings County · 2,614,986 people
- City population
- 7,731,280
- Metro
- New York-Newark-Jersey City, NY-NJ-PA
- Population (ZIP)
- 68,846
- Household income
- $65,127
- Rent vs Own
- Severe rent burden
- 6603.0
Population outlook (Kings County) Hauer SSP2
- Today (2025)
- 2,847,441 people
- By 2030
- 2,937,006 · +3.1%
- By 2040
- 3,095,491 · +8.7%
- By 2050
- 3,228,968 · +13.4%
- By 2075
- 3,321,723 · +16.7%
- By 2100
- 3,111,387 · +9.3%
Race, ethnicity, and origin ACS 2023
- Neighborhood character
- Diverse neighborhood (Simpson 0.61)
- Race & ethnicity
- Black 56% White 23% Hispanic / Latino 13% Two or more races 8% Asian 2%
- Hispanic origin (detail)
- Mexican 1% Puerto Rican 3% Dominican 4%
- Common ancestry
- Hispanic 5% Scotch-Irish 2% Romanian 1%
- Foreign-born
- 32% · Canada, Mexico, China
- Languages at home
- 76% English-only · Spanish 9% French/Haitian/Cajun 6% German/W. Germanic 2%
Political lean MEDSL · Kings
- 2024 margin
- Solid D (+44.0) · D 72.0% · R 28.0%
- 2008→2024 swing
- -15.5pp toward R · 2008: 59.4pp · 2024: 44.0pp
- All cycles
- 2024: D+44.0 2020: D+54.8 2016: D+61.8 2012: D+63.9 2008: D+59.4
Not yet ingested
- Civics
- —
Market trends
- HPI YoY
- ▲ 23.71%
- Current HPI
- 577.3841
- Rent YoY
- ▲ 5.95%
- Metro
- New York-Newark-Jersey City, NY-NJ-PA
- State GDP YoY
- ▲ 2.60%
- F500 in state
- 92
Industry mix (Fortune 500 HQ in NY)
| Industry | F500 HQs | Revenue |
|---|---|---|
| Financial Services | 10 | $950B |
|
||
| Consumer Goods | 9 | $162B |
|
||
| Insurance | 4 | $225B |
|
||
| Telecommunications | 2 | $144B |
|
||
| Pharmaceuticals | 2 | $112B |
|
||
| Media / Entertainment | 2 | $69B |
|
||
Price history
+1498.0% since first listed10 events — show timeline
- 2026-06-02 Listed $799,000 RLS at REBNY
- 2020-04-15 Sold (MLS) $464,000 BNYMLS
- 2015-09-24 Delisted — BNYMLS
- 2015-07-16 Pending — BNYMLS
- 2015-04-29 Price Changed $475,000 BNYMLS
- 2015-04-03 Listed $479,000 BNYMLS
- 2014-05-21 Sold (Public Records) $155,000 Public Records
- 1999-08-27 Sold (Public Records) $147,000 Public Records
- 1997-10-22 Sold (Public Records) $18,000 Public Records
- 1988-05-31 Sold (Public Records) $50,000 Public Records
Property tax history
+6.8%/yrLatest (2025): $1,861 · -1.0% YoY. Source: county tax records.
Cash-flow waterfall
monthlySold comps — $/sqft
last 12 mo · ≤1 miLoading sold comps…