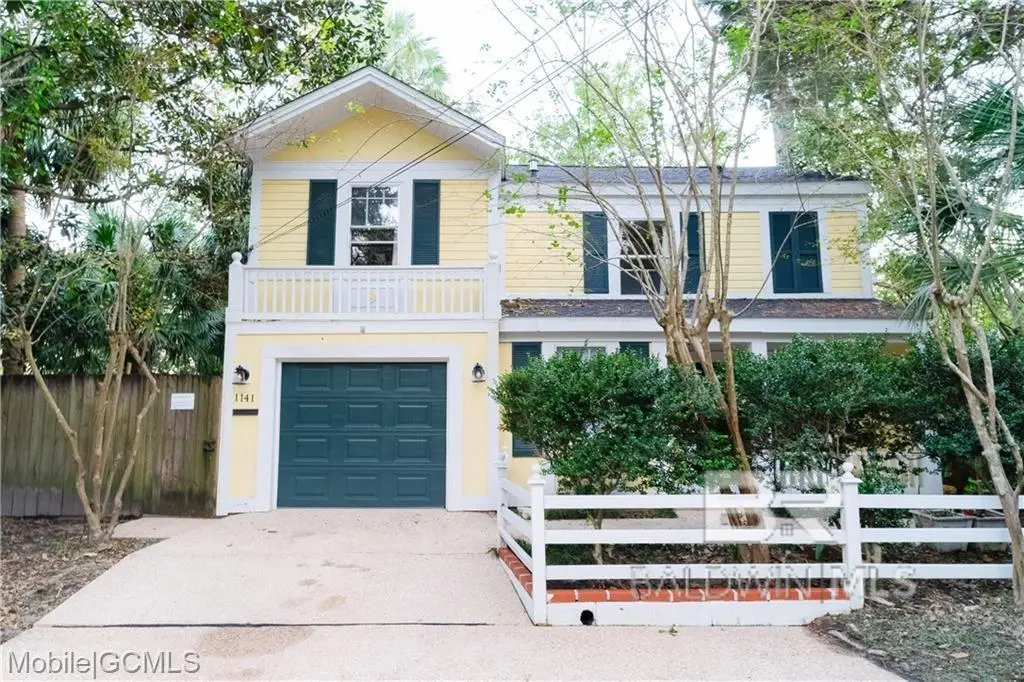
1141 Montauk Ave · Mobile, AL
Flood risk 1/10 · Minimal
- FEMA flood zone
- X (unshaded)
- Chance of flooding over 30 yrs
- 0.0%
- Est. flood insurance / yr
- $507 – $1,088
Fire risk 1/10 · Minimal
- Est. fire insurance / yr
- $916 – $1,700
Heat risk 9/10 · Severe
- Hot days now (above 105°F)
- 7 days/yr
- Hot days in 30 yrs
- 21 days/yr
Wind risk 9/10 · Severe
- Chance of severe wind over 30 yrs
- 99.0%
Air-quality risk 2/10 · Minimal
- Unhealthy air days now
- 1 days/yr
- Unhealthy air days in 30 yrs
- 1 days/yr
Risk factors via First Street. Map © Google.
Why this score? — see what drove the D grade
The composite is a weighted blend of 9 inputs, each scored 0–100. Each bar is that input's sub-score; the figure is the points it added to the 100-point composite (weight × sub-score).
- Cash flow +12.6/30.0
- ARV discount +9.0/15.0
- DSCR +3.8/10.0
- Livability +3.8/5.0
- Rent growth +3.4/5.0
- 1% rule +2.8/10.0
- Condition / age +2.5/5.0
- Schools +2.3/10.0
- Appreciation +0.0/10.0
$245,000
🖨 Deal sheet (PDF) 📄 Offer letter ✓ Due diligence
Listing remarks MLS
Charming Midtown Carriage House in Historic Old Dauphin WayNestled in the heart of Midtown’s sought-after Old Dauphin Way Historic District, just moments from the beautiful Oakleigh Garden District, this 3-bedroom, 2-bath carriage house offers the perfect blend of historic charm and modern convenience. Enjoy walkable access to local restaurants, parks, shopping, and vibrant downtown Mobile. The main level welcomes you with an open-concept living and kitchen area, a full bath, and a dedicated laundry room complete with washer and dryer. A versatile bonus room provides flexible options for a dining space, den, office, or even a fourth bedroom, and opens to a private fenced courtyard—ideal for relaxing or entertaining. Upstairs, the spacious primary suite features a dressing area and double closets, while two additional light-filled bedrooms and a second full bath provide comfortable accommodations for family or guests. Additional highlights include a one-car attached garage, a 2019 roof, and a 2020 HVAC system for added peace of mind. Currently operating as a successful Airbnb and offered fully furnished, this property presents a turnkey investment opportunity or a move-in-ready Midtown retreat. Experience comfortable living in one of Mobile’s most desirable historic neighborhoods. Buyer to verify all information during due diligence. Buyer to verify all information during due diligence.
Key facts
- Versatile bonus room
- Garage
- Built 2008
Tags
Neighborhood map
What this means for you Summary
Snapshot
- This is a 3-bed/2.0-bath single-family listed at $245k.
Deal economics
- At list price, monthly cash flow is $-29 ($-353/yr) — negative.
- To cash-flow at today's rent, offer at most $240k (2.1% below list).
- To meet the 1% rule (rent ≥ 1% of price), the offer needs to be $192k (21.5% below list).
- Recommended offer: $192k (21.5% below list) — sets the bar for 1% rule.
- Cap rate 6.1% vs local median 4.9% in Mobile — meaningfully above typical; check what's discounted (condition, days-on-market, listing class) to confirm the premium yield is real.
Location & tenants
- Location reads 75/100 on livability (#20 in AL, #4,262 nationally) — a middle-class / working-renter tenant base. Strengths: commute A+, cost of living A+, housing A+; Watch: crime F, employment D-.
- Mobile County (urban): math 15% / reading 39% proficiency, ranked #81 of 129 in AL (top 63%) — low school quality limits family demand, transient renter base, plan for 1-2y turnover; 67% free/reduced lunch — lower-income household profile, screen leases tightly.
- Zoned schools: Leinkauf Elementary School (math 8% / reading 26%, grade F, #499 of 627 statewide, top 80%, 538 students, 91% FRL); Calloway Smith Middle School (math 0% / reading 18%, grade F, #235 of 257 statewide, top 93%, 396 students, 96% FRL); Murphy High School (math 10% / reading 19%, grade F, #220 of 305 statewide, top 77%, 1,254 students, 66% FRL) — zoned schools average 84% FRL vs 67% district-wide (17 pts higher); higher-poverty schools than district average — tighter screening recommended.
- Zoned-school proficiency averages 14% at this address vs 27% district-wide (-13 pts) — the specific schools serving this property underperform the Mobile County average; the district grade overstates school quality for this exact location.
- Market conditions: Rents rising (+3.8%/yr); 93 active listings in the ZIP; 21 comparable units currently listed for rent nearby; rentals lingering (median 46d on market — plan ~5-8 weeks vacancy on turnover, expect pricing pressure); 52% of comp listings sitting > 30 days — soft ceiling on asking rent; 1,678 units permitted in Mobile County in 2024 (264 in 5+ unit buildings).
- This rent runs 35% of the median local income ($66k/yr) — at the standard rent-burdened threshold; future hikes will face affordability resistance.
Forward outlook
- Local home prices are declining (-3.0%/yr); year-one equity from $2k of loan paydown is wiped out by about $7k of value loss. Plan a longer hold.
- Mobile County population projected to shrink 8% by 2050 — rents likely to lag national; underwrite the cash flow, not the appreciation.
Negotiation context
- It's been on market 114 days — a 9% lower offer ($223k) is reasonable based on typical stale-listing flexibility.
- 3 sale attempts with the ask held roughly flat each time — persistent listings suggest the price (not the market) is what's stuck; bring a comps-based counter.
Risks & watch-outs
- Climate carrying-cost: severe wind risk, 99% chance of damaging wind over 30y; extreme-heat days projected 7→21/yr by 2055 (HVAC capex compounding) — expect insurance premiums to compound above CPI over the hold.
Questions for the listing agent
- What do current leases actually rent for vs. the listed asking? Can we see a recent rent roll and the last 12 months of T-12 income?
- It's been on market 114 days. Have you received any prior offers? Is the seller open to a 22% concession, seller financing, or rate buy-down credit?
- Why hasn't it sold? Are there any deal-killer items the seller is aware of (foundation, flood, title, zoning, code violations)?
- Is there a deadline driving the sale (1031 exchange, divorce, estate, relocation)? That informs how much negotiation room exists.
- Schools are D-rated, which usually means shorter tenancies and higher turnover. Who's the typical renter profile here, and what's been the actual vacancy rate?
- Crime grade is F in this area — have there been break-ins, vandalism, or insurance claims at this property in the last 3 years? What carrier currently insures it and at what premium?
- The area grade is low — what's the realistic commute time and amenity access for the typical tenant pool here? Any planned neighborhood developments (good or bad) we should know about?
- What's the average days-on-market for RENTAL listings here right now (not sales)? A rising rental-DOM trend means longer vacancies and softer asking-rent achievability than the comps imply.
- What's the recent tenant-quality profile in this submarket — average credit score on applications, eviction rate, late-payment / NSF rate, and stable-employment percentage? A property-management company in the area should have these aggregated.
- How much new for-sale + rental construction is in the pipeline within 1–3 miles? Heavy new supply typically softens prices + rents 12–24 months out; constrained supply supports both.
Investment metrics
- 1% rule
- 0.78% ✗
- Cap rate
- 6.15%
- Cash-on-cash
- -0.51%
- DSCR
- 0.98
- GRM
- 10.6
CMA / ARV
- ARV (median comp)
- $253,174
- List price
- $245,000
- Delta
- -3.23%
- Verdict
- FAIR
- Comps
- 20 within 1.0 mi
Show comp detail 12 sales within ~0.75 mi
| Address | Dist | Beds/Ba | Sqft | Sold | Price | $/sf | Match |
|---|---|---|---|---|---|---|---|
| 1154 Old Shell Rd | 0.36mi | 3/1.0 | 1,473 (+4%) | 1mo | $235,000 | $160 | 71 |
| 1015 Old Shell Rd | 0.43mi | 2/2.0 (-1) | 1,435 (+2%) | 2mo | $250,000 | $174 | 71 |
| 309 Chatham St | 0.47mi | 2/1.0 (-1) | 1,393 (-1%) | 0mo | $260,000 | $187 | 67 |
| 12 Hallett St S | 0.26mi | 2/2.0 (-1) | 1,262 (-11%) | 1mo | $218,000 | $173 | 64 |
| 121 Macy Pl | 0.71mi | 3/2.0 | 1,375 (-3%) | 3mo | $280,000 | $204 | 60 |
| 118 Providence St | 0.67mi | 2/2.0 (-1) | 1,386 (-2%) | 4mo | $269,000 | $194 | 58 |
| 1501 Brown St | 0.52mi | 2/1.5 (-1) | 1,353 (-4%) | 7mo | $218,000 | $161 | 56 |
| 1561 Bruister St | 0.67mi | 2/2.0 (-1) | 1,504 (+6%) | 3mo | $330,000 | $219 | 50 |
| 122 Bush Ave | 0.50mi | 3/1.0 | 1,587 (+12%) | 8mo | $177,000 | $112 | 46 |
| 29 Monterey St S | 0.75mi | 3/1.0 | 1,516 (+7%) | 5mo | $139,900 | $92 | 44 |
| 409 Wisconsin Ave | 0.72mi | 3/1.0 | 1,288 (-9%) | 6mo | $82,500 | $64 | 42 |
| 958 Elmira St | 0.63mi | 3/1.0 | 1,600 (+13%) | 6mo | $64,000 | $40 | 39 |
Match score weights: distance 35% · size 25% · config 20% · recency 20%. Top-matched comps best support the ARV.
Projected returns pro-forma
-3.0% appreciation · 3.78% rent growth · sell at horizon
- IRR
- -16.4%
- Equity multiple
- 0.42×
- Total profit
- $-40,111
- Equity at exit
- $36,530
- IRR
- -6.9%
- Equity multiple
- 0.54×
- Total profit
- $-31,239
- Equity at exit
- $21,183
Cash invested: $68,600 (down + closing). Projections, not guarantees.
Landlord ↔ Tenant lean methodology
- Overall (STATE)
- 90 Strongly Landlord-Friendly
- State Alabama
- 90 Strongly Landlord-Friendly · R+15
- County
- — inherits STATE
- City
- — inherits STATE
ZIP-level market 36604
- Rents YoY
- 3.8%
- Active inventory
- 93
- Price-to-rent
- 10.6×
Monthly cashflow live
- Estimated rent
- $1,923 high interval (Pro) →
- Mortgage (P&I)
- −$1,285
- Tax from tax record
- −$162 /mo · $1,941/yr
- Insurance
- −$102
- HOA
- −$0
- Vacancy / Maint / Mgmt
- −$404
- Net cashflow
- $-29
Break-even live
Sensitivity live
| Price | -10% $109 | -5% $40 | +0% $-29 | +5% $-99 | +10% $-168 |
|---|---|---|---|---|---|
| Rent | -10% $-181 | -5% $-105 | +0% $-29 | +5% $47 | +10% $123 |
| Rate | -1.0pp $94 | -0.5pp $33 | base $-29 | +0.5pp $-93 | +1.0pp $-157 |
UW: 25.0% down · 7.5% · 30yr · 1.5% tax · 5.0% vac · 8.0% maint · 8.0% mgmt
Financing live
Cash to close
- Down payment
- $61,250
- Closing costs
- $7,350
- Reserves months
- —
- Total cash needed
- —
Loan-product check · same deal, 3 products live
Conventional
25% down · 7.5% · 30yr
- Down + closing
- —
- Monthly P&I
- —
- Monthly cashflow
- —
- DSCR
- —
- Eligible?
- —
Personal DTI + credit; lowest rate.
DSCR
20% down · 8.5% · 30yr
- Down + closing
- —
- Monthly P&I
- —
- Monthly cashflow
- —
- DSCR
- —
- Eligible?
- —
No personal income docs; deal must DSCR.
Hard money
10% down · 12.0% · 12mo
- Down + closing
- —
- Monthly P&I
- —
- Monthly cashflow
- —
- DSCR
- —
- Eligible?
- —
Short-term bridge; refi at stabilization.
Rent comps 21 comps
| Address | Beds | Baths | Sqft | Rent | $/sqft | DOM | Units | Dist |
|---|---|---|---|---|---|---|---|---|
| 1141 Montauk Ave Unit 1043864P Mobile, AL | 3.0 | 2.0 | 1420 | $2,741 | $1.93 | 15d | 1 | 0.03mi |
| 57 N Ann St Unit 1043453P Mobile, AL | 2.0 | 2.0 | 1065 | $2,015 | $1.89 | 23d | 1 | 0.33mi |
| 961 Old Shell Rd Unit A Mobile, AL | 3.0 | 2.5 | 1600 | $1,295 | $0.81 | 45d | 1 | 0.49mi |
| 84 S Lafayette St Unit 1043577P Mobile, AL | 3.0 | 2.0 | 1496 | $3,116 | $2.08 | 15d | 1 | 0.51mi |
| 1417 Monroe St Mobile, AL | 2.0 | 1.0 | 1064 | $1,350 | $1.27 | 45d | 1 | 0.54mi |
| 111 S Catherine St Mobile, AL | 2.0 | 1.0 | 891 | $899 | $1.01 | 45d | 1 | 0.56mi |
| 1013 Elmira St Unit A Mobile, AL | 2.0 | 1.0 | 1000 | $995 | $0.99 | 23d | 1 | 0.58mi |
| 957 Savannah St Mobile, AL | 2.0 | 1.5 | 1054 | $1,400 | $1.33 | 23d | 1 | 0.59mi |
| 1566 Dauphin St Unit Back Carriage House Mobile, AL | 3.0 | 1.0 | 1300 | $1,200 | $0.92 | 45d | 1 | 0.68mi |
| 107 Macy Pl Mobile, AL | 3.0 | 2.0 | 1800 | $2,250 | $1.25 | 45d | 1 | 0.70mi |
| 1704 McGill Ave Unit B Mobile, AL | 3.0 | 2.5 | 1500 | $1,750 | $1.17 | 45d | 1 | 0.86mi |
| 1660 Laurel St Mobile, AL | 3.0 | 2.0 | 1768 | $2,200 | $1.24 | 15d | 1 | 0.88mi |
| 711 Marine St Mobile, AL | 2.0 | 1.0 | 1100 | $1,150 | $1.05 | 45d | 1 | 0.97mi |
| 600 S Washington Ave Mobile, AL | 1.0–2.0 | 1.0 | 820 | $1,058 | $1.29 | 45d | 2 | 0.99mi |
| 412 Dauphin St Mobile, AL | 2.0 | 1.0–2.5 | 1553 | $2,350 | $1.51 | 15d | 2 | 1.07mi |
| 500 Palmetto St Mobile, AL | 3.0 | 2.0 | 1786 | $1,450 | $0.81 | 45d | 1 | 1.11mi |
| 129 Shell Road Pl Unit 1043713P Mobile, AL | 4.0 | 2.0 | 1496 | $3,389 | $2.27 | 23d | 1 | 1.18mi |
| 122 Demouy Ave Unit 1/2 Mobile, AL | 2.0 | 1.0 | 1300 | $1,530 | $1.18 | 45d | 1 | 1.21mi |
| 1204 Seneca St Mobile, AL | 3.0 | 2.0 | 1425 | $1,345 | $0.94 | 15d | 1 | 1.33mi |
| 305 Indian Creek Dr E Unit 1043809P Mobile, AL | 3.0 | 2.5 | 1496 | $3,985 | $2.66 | 15d | 1 | 1.34mi |
| 811 Gorgas St Mobile, AL | 4.0 | 1.0 | 1300 | $1,310 | $1.01 | 45d | 1 | 1.43mi |
Listing history 26 events
-
2026-06-21days on market $245,000 Active 114 DOM
-
2026-06-18days on market $245,000 Active 111 DOM
-
2026-06-17days on market $245,000 Active 110 DOM
-
2026-06-16days on market $245,000 Active 109 DOM
-
2026-06-15days on market $245,000 Active 108 DOM
-
2026-06-14days on market $245,000 Active 106 DOM
-
2026-06-13days on market $245,000 Active 105 DOM
-
2026-06-10days on market $245,000 Active 103 DOM
-
2026-06-09days on market $245,000 Active 102 DOM
-
2026-06-08days on market $245,000 Active 101 DOM
-
2026-06-07days on market $245,000 Active 100 DOM
-
2026-06-05days on market $245,000 Active 97 DOM
-
2026-06-03days on market $245,000 Active 96 DOM
-
2026-06-02days on market $245,000 Active 95 DOM
-
2026-06-01days on market $245,000 Active 94 DOM
-
2026-05-31days on market $245,000 Active 93 DOM
-
2026-05-30days on market $245,000 Active 92 DOM
-
2026-04-09price $245,000 1426-char remark
Show marketing remark (1426 chars)
Charming Midtown Carriage House in Historic Old Dauphin WayNestled in the heart of Midtown’s sought-after Old Dauphin Way Historic District, just moments from the beautiful Oakleigh Garden District, this 3-bedroom, 2-bath carriage house offers the perfect blend of historic charm and modern convenience. Enjoy walkable access to local restaurants, parks, shopping, and vibrant downtown Mobile. The main level welcomes you with an open-concept living and kitchen area, a full bath, and a dedicated laundry room complete with washer and dryer. A versatile bonus room provides flexible options for a dining space, den, office, or even a fourth bedroom, and opens to a private fenced courtyard—ideal for relaxing or entertaining. Upstairs, the spacious primary suite features a dressing area and double closets, while two additional light-filled bedrooms and a second full bath provide comfortable accommodations for family or guests. Additional highlights include a one-car attached garage, a 2019 roof, and a 2020 HVAC system for added peace of mind. Currently operating as a successful Airbnb and offered fully furnished, this property presents a turnkey investment opportunity or a move-in-ready Midtown retreat. Experience comfortable living in one of Mobile’s most desirable historic neighborhoods. Buyer to verify all information during due diligence. Buyer to verify all information during due diligence.
-
2026-02-27$249,000 Active 1426-char remark
Show marketing remark (1426 chars)
Charming Midtown Carriage House in Historic Old Dauphin WayNestled in the heart of Midtown’s sought-after Old Dauphin Way Historic District, just moments from the beautiful Oakleigh Garden District, this 3-bedroom, 2-bath carriage house offers the perfect blend of historic charm and modern convenience. Enjoy walkable access to local restaurants, parks, shopping, and vibrant downtown Mobile. The main level welcomes you with an open-concept living and kitchen area, a full bath, and a dedicated laundry room complete with washer and dryer. A versatile bonus room provides flexible options for a dining space, den, office, or even a fourth bedroom, and opens to a private fenced courtyard—ideal for relaxing or entertaining. Upstairs, the spacious primary suite features a dressing area and double closets, while two additional light-filled bedrooms and a second full bath provide comfortable accommodations for family or guests. Additional highlights include a one-car attached garage, a 2019 roof, and a 2020 HVAC system for added peace of mind. Currently operating as a successful Airbnb and offered fully furnished, this property presents a turnkey investment opportunity or a move-in-ready Midtown retreat. Experience comfortable living in one of Mobile’s most desirable historic neighborhoods. Buyer to verify all information during due diligence. Buyer to verify all information during due diligence.
-
2025-03-27$275,000 Active
-
2025-01-22$279,000 Active
-
2024-01-29soldstatus $240,000
-
2020-12-17soldstatus $140,000
-
2020-12-08soldstatus $143,170
-
2018-09-24soldstatus $120,000
-
2005-06-24soldstatus $123,000
ⓘ Source: listings_history table (triggers on properties + properties_extension) + one-shot
backfill from property_details.listing_events for pre-trigger history.
Tax reassessment forecast AL · Resets to sale price
- Current annual tax
- $1,941 · $162/mo
- Projected year-2 tax
- $1,941 · $162/mo
- Expected delta
- $0/yr ($0/mo · -0.0%)
ⓘ Screening estimate from a state-policy table — verify with the county assessor before closing.
Climate risk First Street
- Flood 1/10 Low FEMA zone X (unshaded) · 0% chance over 30 yrs
- Wildfire 1/10 Low
- Heat 9/10 Extreme 7 d/yr ≥105°F today · 21 d/yr by 30 yrs out
- Wind 9/10 Extreme 99% chance of damaging wind over 30 yrs
- Air quality 2/10 Low 1 unhealthy d/yr today · 1 by 30 yrs out
Nearby sold comps map
Loading sold comps map…
Walkable amenities ~0.75 mi
Loading nearby amenities…
Taxation est. · year 1
- Rental income
- $23,077
- − Mortgage interest
- −$13,724
- − Property taxes
- −$1,941
- − Insurance
- −$1,225
- − Repairs & maintenance
- −$1,846
- − Management
- −$1,846
- − Depreciation
- −$7,127
- Taxable loss
- −$4,632
- Est. tax savings @ 24.0%
- +$1,112
- After-tax cash flow
- $759/yr
For passive investors: Depreciation is non-cash, so a rental often shows a tax loss while cash-flowing — sheltering income. Rental losses are passive: they offset passive income freely, and up to $25,000/yr can offset ordinary (W-2) income if you actively participate and your MAGI is under $100k (phasing out to $0 by $150k); unused losses carry forward. On sale, claimed depreciation is recaptured at up to 25%, and gains may owe capital-gains tax (a 1031 exchange can defer both). Figures are a year-1 estimate at your 24.0% rate — not tax advice; consult a CPA.
Schools (NCES district)
- District
- Mobile County
- NCES district ID
- 0102370
- Math proficiency
- 15% ▼ -28.00%
- Reading proficiency
- 39% ▬ 0.00%
- Median HH income
- $42,455
- Composite
- 22.9/100
- National rank
- #8002
- State rank
- #81 of 129 in AL
Livability — Mobile
- Score
- 75/100
- State rank
- #20
- US rank
- #4262
Category grades
Schools grade is shown separately in the Schools card above.
Census & demographics
- Census place
- Mobile, AL
- County
- Mobile County · 246,577 people
- City population
- 205,729
- Metro
- Mobile, AL
- Population (ZIP)
- 8,836
- Household income
- $66,357
- Rent vs Own
- Severe rent burden
- 452.0
Population outlook (Mobile County) Hauer SSP2
- Today (2025)
- 415,303 people
- By 2030
- 411,755 · -0.9%
- By 2040
- 399,670 · -3.8%
- By 2050
- 382,616 · -7.9%
- By 2075
- 337,353 · -18.8%
- By 2100
- 283,391 · -31.8%
Race, ethnicity, and origin ACS 2023
- Neighborhood character
- Diverse neighborhood (Simpson 0.56)
- Race & ethnicity
- White 51% Black 42% Two or more races 3% Hispanic / Latino 2%
- Common ancestry
- Lithuanian 4% Serbian 2% Slovak 2%
- Foreign-born
- 2% · Canada, China
- Languages at home
- 97% English-only · Spanish 2%
Political lean MEDSL · Mobile
- 2024 margin
- R (+16.4) · D 41.3% · R 57.7%
- 2008→2024 swing
- -7.7pp toward R · 2008: -8.7pp · 2024: -16.4pp
- All cycles
- 2024: R+16.4 2020: R+11.9 2016: R+13.9 2012: R+9.3 2008: R+8.7
Not yet ingested
- Civics
- —
Market trends
- HPI YoY
- ▼ -143.27%
- Current HPI
- 205.7241
- Rent YoY
- ▲ 3.78%
- Metro
- Mobile, AL
- State GDP YoY
- ▲ 2.94%
- F500 in state
- 4
Industry mix (Fortune 500 HQ in AL)
| Industry | F500 HQs | Revenue |
|---|---|---|
| Financial Services | 1 | $8B |
|
||
| Healthcare | 1 | $5B |
|
||
Price history
+99.2% since first listed9 events — show timeline
- 2026-04-09 Price Changed $245,000 BCAR
- 2026-02-27 Listed $249,000 BCAR
- 2025-03-27 Listed $275,000 BCAR
- 2025-01-22 Listed $279,000 BCAR
- 2024-01-29 Sold (Public Records) $240,000 Public Records
- 2020-12-17 Sold (Public Records) $140,000 Public Records
- 2020-12-08 Sold (MLS) $143,170 GCMLS AL
- 2018-09-24 Sold (Public Records) $120,000 Public Records
- 2005-06-24 Sold (Public Records) $123,000 Public Records
Property tax history
+4.5%/yrLatest (2025): $1,941 · +8.8% YoY. Source: county tax records.
Cash-flow waterfall
monthlySold comps — $/sqft
last 12 mo · ≤1 miLoading sold comps…