711 E Hill St · Spur, TX
Flood risk 1/10 · Minimal
- FEMA flood zone
- —
- Chance of flooding over 30 yrs
- 0.0%
- Est. flood insurance / yr
- —
Fire risk 8/10 · Major
- Est. fire insurance / yr
- $1,222 – $2,270
Heat risk 6/10 · Moderate
- Hot days now (above 104°F)
- 7 days/yr
- Hot days in 30 yrs
- 21 days/yr
Wind risk 3/10 · Minor
- Chance of severe wind over 30 yrs
- 5.0%
Air-quality risk 1/10 · Minimal
- Unhealthy air days now
- 0 days/yr
- Unhealthy air days in 30 yrs
- 0 days/yr
Risk factors via First Street. Map © Google.
Why this score? — see what drove the B grade
The composite is a weighted blend of 9 inputs, each scored 0–100. Each bar is that input's sub-score; the figure is the points it added to the 100-point composite (weight × sub-score).
- Cash flow +30.0/30.0
- 1% rule +10.0/10.0
- DSCR +10.0/10.0
- ARV discount +7.5/15.0
- Appreciation +6.7/10.0
- Schools +3.4/10.0
- Livability +3.0/5.0
- Rent growth +2.5/5.0
- Condition / age +1.0/5.0
$29,999
🖨 Deal sheet 📄 Offer letter ✓ Due diligence
Listing remarks MLS
FIXER UPPER! Charming home in Spur, TX! Situated on a spacious lot and right of Highway 70! Proximity to local stores, grocery and eateries! Being sold AS IS but has a lot of potential. WE MAKE IT EASY TO OWN. This is a great opportunity! Don't wait, call us today to get more information of the owner's easy terms and smooth process that may be able to put the deed in your name and make this your dream property.
Key facts
- Spacious lot
- Proximity to grocery
- 0.66 acre lot
Tags
Neighborhood map
What this means for you Summary
Snapshot
- This is a 2-bed/1.0-bath single-family listed at $30k. Condition is rated poor.
Deal economics
- At list price, monthly cash flow is $443 ($5k/yr) — positive.
- The deal already cash-flows at list — no discount required.
- Meets the 1% rule at list price ($823 rent vs $30k).
- Recommended offer: $26k (12.0% below list) — sets the bar for market timing.
Location & tenants
- Location reads 59/100 on livability (#1,138 in TX) — a working-class tenant base; expect higher turnover. Strengths: cost of living A+, housing A-; Watch: health & safety C-, schools F, crime F.
- Spur ISD (rural): math 35% / reading 40% proficiency, ranked #841 of 1,141 in TX (top 74%) — families likely to look elsewhere, expect single-tenant / working-renter base with shorter leases.
- Market conditions: 14 active listings in the ZIP.
Forward outlook
- In year one you build about $1k of equity ($207 loan paydown + $1k appreciation (3.4% local appreciation)).
- Dickens County population projected at -34% by 2050 — secular population decline; favor cash flow + early exit over multi-decade hold.
- At projected returns (3.4% appreciation + 3.0% rent growth), your $8k cash investment doubles in ~2 years — after that, you're playing with house money.
Negotiation context
- It's been on market 409 days — a 12% lower offer ($26k) is reasonable based on typical stale-listing flexibility.
Risks & watch-outs
- Watch-outs: built in 1940 — expect roof / HVAC / electrical / plumbing capex.
- Climate carrying-cost: severe wildfire risk; extreme-heat days projected 7→21/yr by 2055 (HVAC capex compounding) — expect insurance premiums to compound above CPI over the hold.
Questions for the listing agent
- It's been on market 409 days. Have you received any prior offers? Is the seller open to a 12% concession, seller financing, or rate buy-down credit?
- Have any recent inspections been done? Can we get a copy of the seller's disclosures and any deferred-maintenance estimates?
- Built in 1940 — when were the roof, HVAC, electrical panel, plumbing, and water heater last replaced?
- Why hasn't it sold? Are there any deal-killer items the seller is aware of (foundation, flood, title, zoning, code violations)?
- Is there a deadline driving the sale (1031 exchange, divorce, estate, relocation)? That informs how much negotiation room exists.
- Schools are F-rated, which usually means shorter tenancies and higher turnover. Who's the typical renter profile here, and what's been the actual vacancy rate?
- Crime grade is F in this area — have there been break-ins, vandalism, or insurance claims at this property in the last 3 years? What carrier currently insures it and at what premium?
- What's the average days-on-market for RENTAL listings here right now (not sales)? A rising rental-DOM trend means longer vacancies and softer asking-rent achievability than the comps imply.
- What's the recent tenant-quality profile in this submarket — average credit score on applications, eviction rate, late-payment / NSF rate, and stable-employment percentage? A property-management company in the area should have these aggregated.
- How much new for-sale + rental construction is in the pipeline within 1–3 miles? Heavy new supply typically softens prices + rents 12–24 months out; constrained supply supports both.
Investment metrics
- 1% rule
- 2.74% ✓
- Cap rate
- 24.02%
- Cash-on-cash
- 63.32%
- DSCR
- 3.82
- GRM
- 3.0
CMA / ARV
No comps found within radius.
Projected returns pro-forma
3.44% appreciation · 3.0% rent growth · sell at horizon
- IRR
- 68.5%
- Equity multiple
- 4.88×
- Total profit
- $32,551
- Equity at exit
- $14,229
- IRR
- 67.7%
- Equity multiple
- 9.99×
- Total profit
- $75,492
- Equity at exit
- $22,523
Cash invested: $8,400 (down + closing). Projections, not guarantees.
Landlord ↔ Tenant lean methodology
- Overall (STATE)
- 87 Strongly Landlord-Friendly
- State Texas
- 87 Strongly Landlord-Friendly · R+5
- County
- — inherits STATE
- City
- — inherits STATE
ZIP-level market 79370
- Home prices YoY
- 4.1%
- Active inventory
- 14
- Price-to-rent
- 3.0×
Monthly cashflow live
- Estimated rent
- $823 medium interval (Pro) →
- Mortgage (P&I)
- −$157
- Tax est. 1.5%
- −$37 /mo · $450/yr
- Insurance
- −$12
- HOA
- −$0
- Vacancy / Maint / Mgmt
- −$173
- Net cashflow
- $443
Break-even live
UW: 25.0% down · 7.5% · 30yr · 1.5% tax · 5.0% vac · 8.0% maint · 8.0% mgmt
Financing live
Cash to close
- Down payment
- $7,500
- Closing costs
- $900
- Reserves months
- —
- Total cash needed
- —
Loan-product check · same deal, 3 products live
Conventional
25% down · 7.5% · 30yr
- Down + closing
- —
- Monthly P&I
- —
- Monthly cashflow
- —
- DSCR
- —
- Eligible?
- —
Personal DTI + credit; lowest rate.
DSCR
20% down · 8.5% · 30yr
- Down + closing
- —
- Monthly P&I
- —
- Monthly cashflow
- —
- DSCR
- —
- Eligible?
- —
No personal income docs; deal must DSCR.
Hard money
10% down · 12.0% · 12mo
- Down + closing
- —
- Monthly P&I
- —
- Monthly cashflow
- —
- DSCR
- —
- Eligible?
- —
Short-term bridge; refi at stabilization.
Listing history 16 events
-
2026-06-18days on market $29,999 Active 409 DOM
-
2026-06-17days on market $29,999 Active 408 DOM
-
2026-06-16days on market $29,999 Active 407 DOM
-
2026-06-15days on market $29,999 Active 406 DOM
-
2026-06-15days on market $29,999 Active 405 DOM
-
2026-06-13days on market $29,999 Active 404 DOM
-
2026-06-12days on market $29,999 Active 403 DOM
-
2026-06-09days on market $29,999 Active 400 DOM
-
2026-06-08days on market $29,999 Active 399 DOM
-
2026-06-08days on market $29,999 Active 398 DOM
-
2026-06-07days on market $29,999 Active 397 DOM
-
2026-06-03days on market $29,999 Active 394 DOM
-
2026-06-02days on market $29,999 Active 393 DOM
-
2026-06-01days on market $29,999 Active 392 DOM
-
2026-05-31days on market $29,999 Active 391 DOM
-
2025-05-05$29,999 Active 414-char remark
Show marketing remark (414 chars)
FIXER UPPER! Charming home in Spur, TX! Situated on a spacious lot and right of Highway 70! Proximity to local stores, grocery and eateries! Being sold AS IS but has a lot of potential. WE MAKE IT EASY TO OWN. This is a great opportunity! Don't wait, call us today to get more information of the owner's easy terms and smooth process that may be able to put the deed in your name and make this your dream property.
ⓘ Source: listings_history table (triggers on properties + properties_extension) + one-shot
backfill from property_details.listing_events for pre-trigger history.
Climate risk First Street
- Flood 1/10 Low 0% chance over 30 yrs
- Wildfire 8/10 Severe
- Heat 6/10 Major 7 d/yr ≥104°F today · 21 d/yr by 30 yrs out
- Wind 3/10 Moderate 5% chance of damaging wind over 30 yrs
- Air quality 1/10 Low 0 unhealthy d/yr today · 0 by 30 yrs out
Nearby sold comps map
Loading sold comps map…
Walkable amenities ~0.75 mi
Loading nearby amenities…
Taxation est. · year 1
- Rental income
- $9,882
- − Mortgage interest
- −$1,680
- − Property taxes
- −$450
- − Insurance
- −$150
- − Repairs & maintenance
- −$791
- − Management
- −$791
- − Depreciation
- −$873
- Taxable income
- $5,147
- Est. tax owed @ 24.0%
- −$1,235
- After-tax cash flow
- $4,083/yr
For passive investors: Depreciation is non-cash, so a rental often shows a tax loss while cash-flowing — sheltering income. Rental losses are passive: they offset passive income freely, and up to $25,000/yr can offset ordinary (W-2) income if you actively participate and your MAGI is under $100k (phasing out to $0 by $150k); unused losses carry forward. On sale, claimed depreciation is recaptured at up to 25%, and gains may owe capital-gains tax (a 1031 exchange can defer both). Figures are a year-1 estimate at your 24.0% rate — not tax advice; consult a CPA.
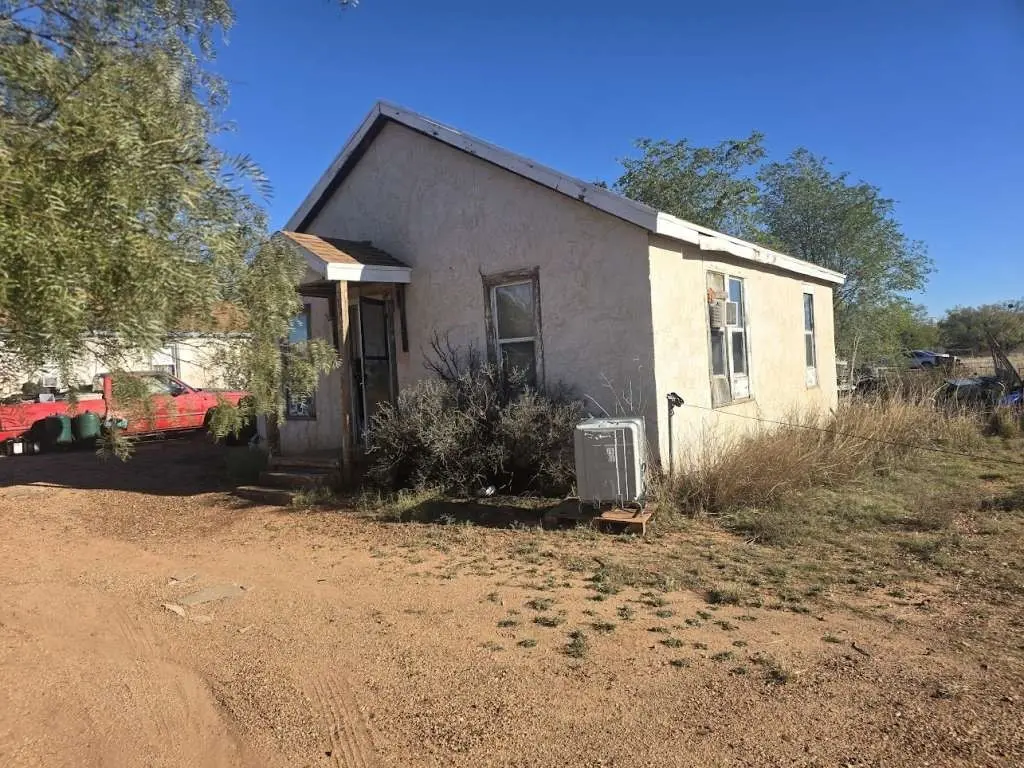
Condition & rehab AI · 1 photo
This fixer-upper home in Spur, TX requires extensive repairs and updates to bring it up to a livable condition. Potential buyers should be prepared for a significant investment.
Repairs flagged
- Major siding — Weathered and in poor condition
- Major roof — Appears aged and in poor condition
- Major HVAC units — No visible units, but the exterior suggests old or damaged units
- Major windows — No visible windows, but the exterior suggests old or damaged windows
- Major landscaping — Overgrown vegetation and dirt around the property
Value-add opportunities
- Both painting and repainting — Fresh paint can improve the home's appearance and curb appeal
- Both landscaping — A well-maintained yard can increase both resale and rental value
- Both HVAC replacement — A new HVAC system can improve comfort and energy efficiency
- Both roof replacement — A new roof can improve the home's appearance and increase its value
- Both window replacement — New windows can improve energy efficiency and curb appeal
Renovation cost estimate screening
| Repair item | Severity | Est. cost |
|---|---|---|
| siding · Weathered and in poor condition | Major | $15,000–50,000 |
| roof · Appears aged and in poor condition | Major | $15,000–50,000 |
| HVAC units · No visible units, but the exterior suggests old or damaged units | Major | $15,000–50,000 |
| windows · No visible windows, but the exterior suggests old or damaged windows | Major | $15,000–50,000 |
| landscaping · Overgrown vegetation and dirt around the property | Major | $15,000–50,000 |
| Total estimated repair cost · 5 items | $75,000–250,000 |
Value-add ROI direction
- Both painting and repainting — Fresh paint can improve the home's appearance and curb appeal ↑
- Both landscaping — A well-maintained yard can increase both resale and rental value ↑
- Both HVAC replacement — A new HVAC system can improve comfort and energy efficiency ↑
- Both roof replacement — A new roof can improve the home's appearance and increase its value ↑
- Both window replacement — New windows can improve energy efficiency and curb appeal ↑
ⓘ Cost ranges are severity-bucket heuristics (US national rule-of-thumb). Get contractor quotes + a written scope before underwriting a rehab budget.
Schools (NCES district)
- District
- Spur ISD
- NCES district ID
- 4800002
- Math proficiency
- 35% ▬ 0.00%
- Reading proficiency
- 40% ▲ 5.00%
- Median HH income
- $36,631
- Composite
- 33.67/100
- National rank
- #10452
- State rank
- #841 of 1141 in TX
Livability — Spur
- Score
- 59/100
- State rank
- #1138
- US rank
- #20062
Category grades
Schools grade is shown separately in the Schools card above.
Census & demographics
- Census place
- Spur, TX
- Population (ZIP)
- 1,217
Population outlook (Dickens County) Hauer SSP2
- Today (2025)
- 1,879 people
- By 2030
- 1,720 · -8.5%
- By 2040
- 1,443 · -23.2%
- By 2050
- 1,249 · -33.5%
- By 2075
- 971 · -48.3%
- By 2100
- 774 · -58.8%
Race, ethnicity, and origin ACS 2023
- Neighborhood character
- Predominantly White (66%)
- Race & ethnicity
- White 66% Hispanic / Latino 32% Two or more races 4% Native American 1%
- Hispanic origin (detail)
- Mexican 28%
- Common ancestry
- Slovak 3% Lithuanian 1% Scotch-Irish 1%
- Foreign-born
- 3% · Canada
- Languages at home
- 78% English-only · Spanish 22%
Political lean MEDSL · Dickens
- 2024 margin
- Solid R (+70.3) · D 14.7% · R 85.0%
- 2008→2024 swing
- -19.3pp toward R · 2008: -51.0pp · 2024: -70.3pp
- All cycles
- 2024: R+70.3 2020: R+73.2 2016: R+69.0 2012: R+56.6 2008: R+51.0
Not yet ingested
- Civics
- —
Market trends
- HPI YoY
- ▲ 3.44%
- Current HPI
- 87.075
- Rent YoY
- —
- Metro
- —
- State GDP YoY
- ▲ 3.95%
- F500 in state
- 110
Industry mix (Fortune 500 HQ in TX)
| Industry | F500 HQs | Revenue |
|---|---|---|
| Energy | 16 | $1,198B |
|
||
| Technology | 5 | $198B |
|
||
| Engineering / Construction | 4 | $72B |
|
||
| Energy Services | 3 | $60B |
|
||
| Utilities | 3 | $41B |
|
||
| Healthcare | 2 | $330B |
|
||
Price history
1 event — show timeline
- 2025-05-05 Listed $29,999 HARMLS
Cash-flow waterfall
monthlySold comps — $/sqft
last 12 mo · ≤1 miLoading sold comps…