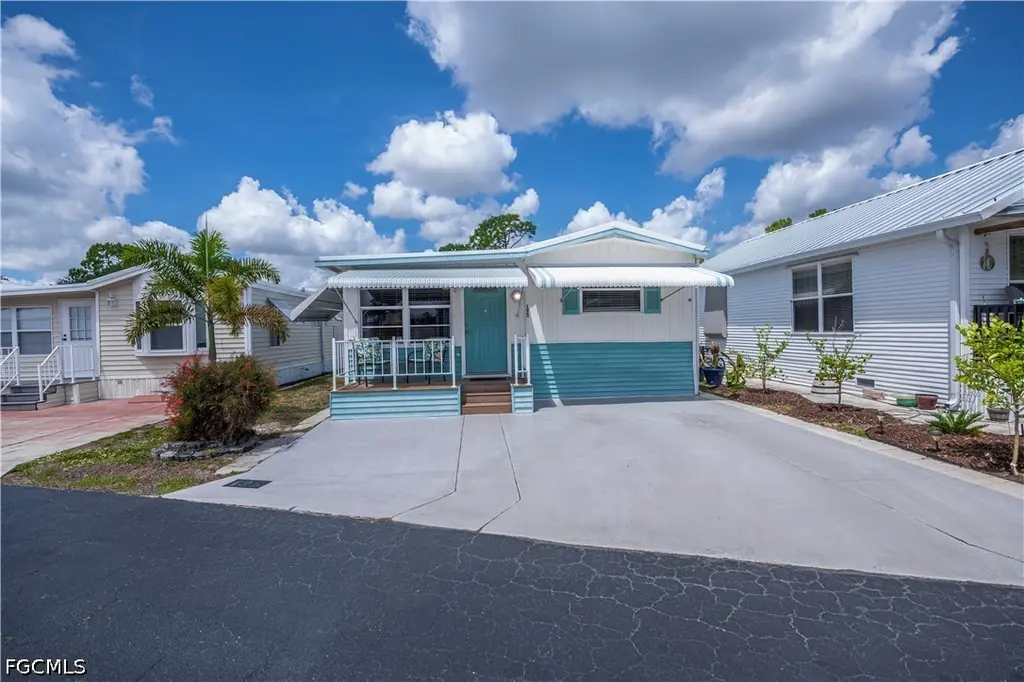
195 Ramble Dr · North Fort Myers, FL
Flood risk 3/10 · Minor
- FEMA flood zone
- X (unshaded)
- Chance of flooding over 30 yrs
- 0.2%
- Est. flood insurance / yr
- $507 – $1,088
Fire risk 6/10 · Moderate
- Est. fire insurance / yr
- $947 – $1,759
Heat risk 10/10 · Severe
- Hot days now (above 107°F)
- 7 days/yr
- Hot days in 30 yrs
- 31 days/yr
Wind risk 10/10 · Severe
- Chance of severe wind over 30 yrs
- 99.0%
Air-quality risk 2/10 · Minimal
- Unhealthy air days now
- 1 days/yr
- Unhealthy air days in 30 yrs
- 1 days/yr
Risk factors via First Street. Map © Google.
Why this score? — see what drove the C- grade
The composite is a weighted blend of 9 inputs, each scored 0–100. Each bar is that input's sub-score; the figure is the points it added to the 100-point composite (weight × sub-score).
- Cash flow +19.2/30.0
- 1% rule +8.5/10.0
- ARV discount +6.6/15.0
- DSCR +6.0/10.0
- Schools +4.1/10.0
- Livability +3.7/5.0
- Condition / age +2.5/5.0
- Rent growth +2.0/5.0
- Appreciation +0.0/10.0
$94,500
🖨 Deal sheet 📄 Offer letter ✓ Due diligence
Listing remarks
Located in desirable Fountain View RV Resort, a well-established 55+ community where you OWN THE LAND, this beautifully maintained turnkey-furnished 2-bedroom, 1.5-bath home offers approximately 792 sq. ft. of comfortable living space. Featuring an open floor plan, the spacious kitchen includes a dishwasher, abundant built-in cabinetry, and overlooks the dining and living areas, creating an inviting space for everyday living and entertaining. Laminate flooring 2022 runs throughout the home, and the in-residence laundry adds everyday convenience. Enjoy both a front deck and rear deck, perfect for relaxing outdoors. Clamshell awning shutters provide shade during the day and can be deployed fo
Key facts
- In-residence laundry
- Open floor plan
- Spacious kitchen
Tags
Property features AI
Finance
- Financial info: Pets allowed (call; conditional)
- HOA & community: Homeowners association with monthly fee ($264.50); Association covers management, cable TV, insurance, internet, laundry, grounds maintenance, recreation facilities, road maintenance, street lights, trash, and water; Association amenities include clubhouse, pool, spa/hot tub, tennis courts, pickleball, basketball court, bocce court, shuffleboard, sport court, RV/boat storage, storage, library, laundry, and on-site management; Community of 338 units; Street lights; Senior community
Exterior
- Parking: Driveway; Paved parking
- Utilities: Public water; Public sewer; Cable available; High speed internet available
- Home design: Manufactured home; One story; Entry level: 1; Faces east
- Construction: Vinyl siding; Roof over
- Exterior features: Open patio and porch; Patio; Porch; Shutters (manual); Community pool
Interior
- Kitchen: Dishwasher; Freezer; Microwave; Range; Refrigerator; Self-cleaning oven
- Bedrooms: Florida room
- Flooring: Laminate
- Bathrooms: 1 full bathroom; 1 half bathroom
- Heating & cooling: Central heating (electric); Central air conditioning (electric); Ceiling fan(s)
- Interior features: Built-in features; Eat-in kitchen; Pantry; Shower only (separate shower); Cable TV; Vaulted ceilings; Window treatments; High speed internet; Single-hung windows; Window coverings; Furnished
- Laundry & utility: Washer; Dryer; Washer hookup; Dryer hookup; Laundry tub; Common area laundry
Neighborhood map
What this means for you Summary
Snapshot
- This is a 1-bed/1.0-bath manufactured listed at $94k.
Deal economics
- At list price, monthly cash flow is $101 ($1k/yr) — positive.
- The deal already cash-flows at list — no discount required.
- Meets the 1% rule at list price ($1k rent vs $94k).
- Cap rate 7.6% vs local median 3.6% in North Fort Myers — top-decile yield for the area; either an underpriced asset or a hidden risk that comps aren't pricing in. Stress-test before assuming the spread holds.
Location & tenants
- Location reads 74/100 on livability (#269 in FL, #4,409 nationally) — a middle-class / working-renter tenant base. Strengths: cost of living A+, housing A+, health & safety A+; Watch: employment C-, amenities F, commute F.
- Lee (suburban): math 47% / reading 50% proficiency, ranked #42 of 73 in FL (top 58%) — families likely to look elsewhere, expect single-tenant / working-renter base with shorter leases.
- Market conditions: Rents soft (-1.9%/yr); 472 active listings in the ZIP; 3 comparable units currently listed for rent nearby; rentals leasing fast (median 10d on market — plan ~1-2 weeks tenant-placement turnaround); 15,411 units permitted in Lee County in 2024 (4,686 in 5+ unit buildings).
Forward outlook
- Local home prices are declining (-3.0%/yr); year-one equity from $653 of loan paydown is wiped out by about $3k of value loss. Plan a longer hold.
- Lee County population projected at +44% by 2050 — long-run rental-demand tailwind backs the buy-and-hold thesis.
Negotiation context
- Only 3 days on market — expect competitive offers; lowballing is unlikely to land.
- Current owner paid $51k; list at $94k implies a 85% gain — meaningful room to come down on a strong offer.
Risks & watch-outs
- Watch-outs: HOA is 21% of rent.
- Climate carrying-cost: severe wind risk, 99% chance of damaging wind over 30y; major wildfire risk; extreme-heat days projected 7→31/yr by 2055 (HVAC capex compounding) — expect insurance premiums to compound above CPI over the hold.
Questions for the listing agent
- What does the HOA fee cover, when was the last increase, and are there any pending special assessments or reserve-fund shortfalls?
- Is there a deadline driving the sale (1031 exchange, divorce, estate, relocation)? That informs how much negotiation room exists.
- What's the average days-on-market for RENTAL listings here right now (not sales)? A rising rental-DOM trend means longer vacancies and softer asking-rent achievability than the comps imply.
- What's the recent tenant-quality profile in this submarket — average credit score on applications, eviction rate, late-payment / NSF rate, and stable-employment percentage? A property-management company in the area should have these aggregated.
- How much new for-sale + rental construction is in the pipeline within 1–3 miles? Heavy new supply typically softens prices + rents 12–24 months out; constrained supply supports both.
Investment metrics
- 1% rule
- 1.35% ✓
- Cap rate
- 7.58%
- Cash-on-cash
- 4.59%
- DSCR
- 1.20
- GRM
- 6.2
CMA / ARV
- ARV (on-the-fly)
- $92,664
- Comps found
- 3
Show comp detail 3 sales within ~0.75 mi
| Address | Dist | Beds/Ba | Sqft | Sold | Price | $/sf | Match |
|---|---|---|---|---|---|---|---|
| 195 Ramble Dr | 0.00mi | 2/1.5 (+1) | 792 (0%) | 0mo | $90,000 | $114 | 93 |
| 86 Lofty Ln | 0.16mi | 1/1.5 | 813 (+3%) | 16mo | $95,000 | $117 | 73 |
| 42 La Fonda Ln | 0.23mi | 2/1.5 (+1) | 768 (-3%) | 19mo | $99,500 | $130 | 62 |
Match score weights: distance 35% · size 25% · config 20% · recency 20%. Top-matched comps best support the ARV.
Projected returns pro-forma
-3.0% appreciation · 0.0% rent growth · sell at horizon
- IRR
- -13.6%
- Equity multiple
- 0.53×
- Total profit
- $-12,416
- Equity at exit
- $14,090
- IRR
- -12.7%
- Equity multiple
- 0.39×
- Total profit
- $-16,204
- Equity at exit
- $8,171
Cash invested: $26,460 (down + closing). Projections, not guarantees.
Landlord ↔ Tenant lean methodology
- Overall (STATE)
- 87 Strongly Landlord-Friendly
- State Florida
- 87 Strongly Landlord-Friendly · R+3
- County
- — inherits STATE
- City
- — inherits STATE
ZIP-level market 33903
- Rents YoY
- -1.9%
- Active inventory
- 472
- Price-to-rent
- 6.2×
Monthly cashflow live
- Estimated rent
- $1,272 medium interval (Pro) →
- Mortgage (P&I)
- −$496
- Tax from tax record
- −$104 /mo · $1,252/yr
- Insurance
- −$39
- HOA
- −$264
- Vacancy / Maint / Mgmt
- −$267
- Net cashflow
- $101
Break-even live
UW: 25.0% down · 7.5% · 30yr · 1.5% tax · 5.0% vac · 8.0% maint · 8.0% mgmt
Financing live
Cash to close
- Down payment
- $23,625
- Closing costs
- $2,835
- Reserves months
- —
- Total cash needed
- —
Loan-product check · same deal, 3 products live
Conventional
25% down · 7.5% · 30yr
- Down + closing
- —
- Monthly P&I
- —
- Monthly cashflow
- —
- DSCR
- —
- Eligible?
- —
Personal DTI + credit; lowest rate.
DSCR
20% down · 8.5% · 30yr
- Down + closing
- —
- Monthly P&I
- —
- Monthly cashflow
- —
- DSCR
- —
- Eligible?
- —
No personal income docs; deal must DSCR.
Hard money
10% down · 12.0% · 12mo
- Down + closing
- —
- Monthly P&I
- —
- Monthly cashflow
- —
- DSCR
- —
- Eligible?
- —
Short-term bridge; refi at stabilization.
Rent comps 3 comps
| Address | Beds | Baths | Sqft | Rent | $/sqft | DOM | Units | Dist |
|---|---|---|---|---|---|---|---|---|
| 10011 Merion Ct North Fort Myers, FL | 2.0 | 1.5 | 750 | $1,100 | $1.47 | 10d | 1 | 0.30mi |
| 3940 Villa Del Mar CIR Cape Coral, FL | 1.0–3.0 | 1.0–2.0 | 1051 | $1,494 | $1.42 | 1d | 21 | 1.38mi |
| 3953 Pomodoro Cir Cape Coral, FL | 1.0–3.0 | 1.0–2.0 | 1044 | $1,299 | $1.24 | 14d | 9 | 1.48mi |
HOA detail
- Monthly dues
- $264 · $3,168/yr
Listing history 4 events
-
2026-05-11status Pending
-
2026-05-08$94,500 Active
-
2003-03-12soldstatus $51,000
-
1988-01-19soldstatus $15,400
ⓘ Source: listings_history table (triggers on properties + properties_extension) + one-shot
backfill from property_details.listing_events for pre-trigger history.
Tax reassessment forecast FL · Resets to sale price
- Current annual tax
- $1,252 · $104/mo
- Projected year-2 tax
- $1,252 · $104/mo
- Expected delta
- $0/yr ($0/mo · 0.0%)
ⓘ Screening estimate from a state-policy table — verify with the county assessor before closing.
Climate risk First Street
- Flood 3/10 Moderate FEMA zone X (unshaded) · 20% chance over 30 yrs
- Wildfire 6/10 Major
- Heat 10/10 Extreme 7 d/yr ≥107°F today · 31 d/yr by 30 yrs out
- Wind 10/10 Extreme 99% chance of damaging wind over 30 yrs
- Air quality 2/10 Low 1 unhealthy d/yr today · 1 by 30 yrs out
Nearby sold comps map
Loading sold comps map…
Walkable amenities ~0.75 mi
Loading nearby amenities…
Taxation est. · year 1
- Rental income
- $15,259
- − Mortgage interest
- −$5,293
- − Property taxes
- −$1,252
- − Insurance
- −$472
- − Repairs & maintenance
- −$1,221
- − Management
- −$1,221
- − HOA
- −$3,168
- − Depreciation
- −$2,749
- Taxable loss
- −$117
- Est. tax savings @ 24.0%
- +$28
- After-tax cash flow
- $1,244/yr
For passive investors: Depreciation is non-cash, so a rental often shows a tax loss while cash-flowing — sheltering income. Rental losses are passive: they offset passive income freely, and up to $25,000/yr can offset ordinary (W-2) income if you actively participate and your MAGI is under $100k (phasing out to $0 by $150k); unused losses carry forward. On sale, claimed depreciation is recaptured at up to 25%, and gains may owe capital-gains tax (a 1031 exchange can defer both). Figures are a year-1 estimate at your 24.0% rate — not tax advice; consult a CPA.
Schools (NCES district)
- District
- Lee
- NCES district ID
- 1201080
- Math proficiency
- 47% ▼ -11.00%
- Reading proficiency
- 50% ▼ -4.00%
- Median HH income
- $49,518
- Composite
- 41.49/100
- National rank
- #3458
- State rank
- #42 of 73 in FL
Livability — North Fort Myers
- Score
- 74/100
- State rank
- #269
- US rank
- #4409
Category grades
Schools grade is shown separately in the Schools card above.
Census & demographics
- Census place
- North Fort Myers, FL
- County
- Lee County · 788,662 people
- City population
- 57,035
- Metro
- Cape Coral-Fort Myers, FL
- Population (ZIP)
- 23,655
- Household income
- $56,993
- Rent vs Own
- Severe rent burden
- 468.0
Population outlook (Lee County) Hauer SSP2
- Today (2025)
- 871,946 people
- By 2030
- 955,468 · +9.6%
- By 2040
- 1,113,587 · +27.7%
- By 2050
- 1,256,891 · +44.1%
- By 2075
- 1,560,270 · +78.9%
- By 2100
- 1,726,848 · +98.0%
Race, ethnicity, and origin ACS 2023
- Neighborhood character
- Predominantly White (81%)
- Race & ethnicity
- White 81% Hispanic / Latino 14% Two or more races 8% Black 2%
- Hispanic origin (detail)
- Mexican 3% Puerto Rican 3% Cuban 3%
- Common ancestry
- Lithuanian 4% Romanian 4% Italian 3%
- Foreign-born
- 11% · Canada
- Languages at home
- 88% English-only · Spanish 9% Other Indo-European 1%
Political lean MEDSL · Lee
- 2024 margin
- Strong R (+28.4) · D 35.5% · R 63.9%
- 2008→2024 swing
- -18.0pp toward R · 2008: -10.4pp · 2024: -28.4pp
- All cycles
- 2024: R+28.4 2020: R+19.2 2016: R+20.4 2012: R+16.6 2008: R+10.4
Not yet ingested
- Civics
- —
Market trends
- HPI YoY
- ▼ -172.26%
- Current HPI
- 256.773
- Rent YoY
- ▼ -1.94%
- Metro
- Cape Coral-Fort Myers, FL
- State GDP YoY
- ▲ 3.28%
- F500 in state
- 36
Industry mix (Fortune 500 HQ in FL)
| Industry | F500 HQs | Revenue |
|---|---|---|
| Industrial Technology | 2 | $29B |
|
||
| Insurance | 2 | $17B |
|
||
| Retail | 1 | $60B |
|
||
| Technology Distribution | 1 | $58B |
|
||
| Homebuilding | 1 | $35B |
|
||
| Technology Manufacturing | 1 | $35B |
|
||
Price history
+513.6% since first listed4 events — show timeline
- 2026-05-11 Pending — FORTMLS
- 2026-05-08 Listed $94,500 FORTMLS
- 2003-03-12 Sold (Public Records) $51,000 Public Records
- 1988-01-19 Sold (Public Records) $15,400 Public Records
Property tax history
+6.1%/yrLatest (2025): $1,252 · +9.5% YoY. Source: county tax records.
Cash-flow waterfall
monthlySold comps — $/sqft
last 12 mo · ≤1 miLoading sold comps…