246 Margarita Dr · Mustang Ridge, TX
Flood risk 1/10 · Minimal
- FEMA flood zone
- X (unshaded)
- Chance of flooding over 30 yrs
- 0.0%
- Est. flood insurance / yr
- $507 – $1,088
Fire risk 5/10 · Moderate
- Est. fire insurance / yr
- $1,222 – $2,270
Heat risk 8/10 · Major
- Hot days now (above 108°F)
- 7 days/yr
- Hot days in 30 yrs
- 22 days/yr
Wind risk 8/10 · Major
- Chance of severe wind over 30 yrs
- 80.0%
Air-quality risk 1/10 · Minimal
- Unhealthy air days now
- 0 days/yr
- Unhealthy air days in 30 yrs
- 0 days/yr
Risk factors via First Street. Map © Google.
Why this score? — see what drove the F grade
The composite is a weighted blend of 9 inputs, each scored 0–100. Each bar is that input's sub-score; the figure is the points it added to the 100-point composite (weight × sub-score).
- Appreciation +10.0/10.0
- Cash flow +7.9/30.0
- Livability +3.2/5.0
- Rent growth +2.5/5.0
- Condition / age +2.5/5.0
- Schools +2.4/10.0
- DSCR +2.0/10.0
- 1% rule +1.6/10.0
- ARV discount +0.0/15.0
$272,000
🖨 Deal sheet (PDF) 📄 Offer letter ✓ Due diligence
Listing remarks
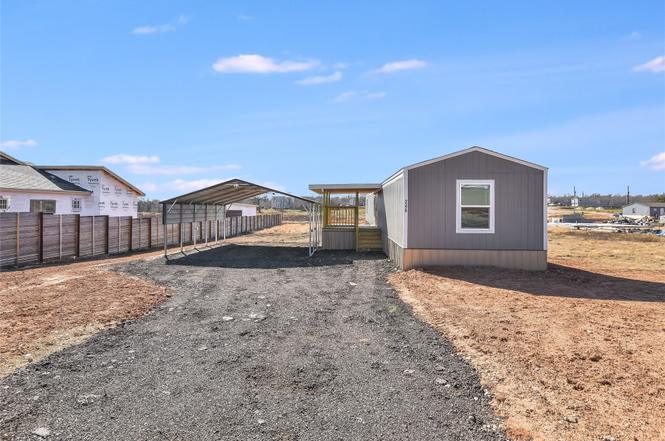
GREAT PROPERTY FOR FIRST TIME HOMEBUYERS OR INVESTORS! Move into this beautiful 4 bedroom, 2 bath mobile home with an open concept floor plan or build your dream home! This lovely home offers a covered porch & carport, a kitchen with new appliances, a spacious master bedroom with an ensuite bathroom and three additional bedrooms perfect for guest bedrooms or office space use. Sitting on a little over 1/3 of an acre, this property backs up to a vacant lot. Conveniently located 15 mins to Circuit of The Americas, 20 mins to airport and within a 30 min drive of Austin or Bastrop. This home is a quiet retreat with the ability to escape the hustle and bustle of the city but still be close
Key facts
- 0.33 acre lot
- 4 parking spots
- Built 2023
Neighborhood map
What this means for you Summary
Snapshot
- This is a 4-bed/2.0-bath manufactured listed at $272k.
Deal economics
- At list price, monthly cash flow is $-285 ($-3k/yr) — negative.
- To cash-flow at today's rent, offer at most $222k (18.5% below list).
- To meet the 1% rule (rent ≥ 1% of price), the offer needs to be $180k (33.8% below list).
- Recommended offer: $180k (33.8% below list) — sets the bar for 1% rule.
Location & tenants
- Location reads 63/100 on livability (#854 in TX) — a middle-class / working-renter tenant base. Strengths: crime A+, employment A+, cost of living A+; Watch: amenities F, commute F, health & safety F.
- Bastrop ISD (rural): math 25% / reading 28% proficiency, ranked #670 of 826 in TX (top 81%) — low school quality limits family demand, transient renter base, plan for 1-2y turnover; 62% free/reduced lunch — lower-income household profile, screen leases tightly.
- Zoned schools: Cedar Creek El (math 12% / reading 13%, grade F, #4,167 of 4,322 statewide, top 97%, 1,077 students, 92% FRL); Cedar Creek Middle (math 21% / reading 28%, grade F, #1,279 of 1,662 statewide, top 78%, 1,040 students, 90% FRL); Cedar Creek H S (math 44% / reading 39%, grade F, #767 of 1,632 statewide, top 47%, 2,002 students, 75% FRL) — zoned schools average 86% FRL vs 62% district-wide (24 pts higher); higher-poverty schools than district average — tighter screening recommended.
- Market conditions: 202 active listings in the ZIP; 1 comparable units currently listed for rent nearby; 1,841 units permitted in Bastrop County in 2024 (150 in 5+ unit buildings).
Forward outlook
- In year one you build about $29k of equity ($2k loan paydown + $27k appreciation (10.0% local appreciation)).
- Bastrop County population projected at +37% by 2050 — long-run rental-demand tailwind backs the buy-and-hold thesis.
- By year 2, paydown + projected appreciation supports a ~$47k cash-out refi (75% LTV) — recoverable capital for the next deal without selling this one.
Negotiation context
- It's been on market 295 days — a 12% lower offer ($239k) is reasonable based on typical stale-listing flexibility.
- 3 sale attempts since 4y ago with the ask held roughly flat each time — persistent listings suggest the price (not the market) is what's stuck; bring a comps-based counter.
Risks & watch-outs
- Climate carrying-cost: severe wind risk, 80% chance of damaging wind over 30y; moderate wildfire risk; extreme-heat days projected 7→22/yr by 2055 (HVAC capex compounding) — expect insurance premiums to compound above CPI over the hold.
Questions for the listing agent
- What do current leases actually rent for vs. the listed asking? Can we see a recent rent roll and the last 12 months of T-12 income?
- It's been on market 295 days. Have you received any prior offers? Is the seller open to a 34% concession, seller financing, or rate buy-down credit?
- Why hasn't it sold? Are there any deal-killer items the seller is aware of (foundation, flood, title, zoning, code violations)?
- Is there a deadline driving the sale (1031 exchange, divorce, estate, relocation)? That informs how much negotiation room exists.
- Schools are F-rated, which usually means shorter tenancies and higher turnover. Who's the typical renter profile here, and what's been the actual vacancy rate?
- The area grade is low — what's the realistic commute time and amenity access for the typical tenant pool here? Any planned neighborhood developments (good or bad) we should know about?
- What's the average days-on-market for RENTAL listings here right now (not sales)? A rising rental-DOM trend means longer vacancies and softer asking-rent achievability than the comps imply.
- What's the recent tenant-quality profile in this submarket — average credit score on applications, eviction rate, late-payment / NSF rate, and stable-employment percentage? A property-management company in the area should have these aggregated.
- How much new for-sale + rental construction is in the pipeline within 1–3 miles? Heavy new supply typically softens prices + rents 12–24 months out; constrained supply supports both.
Investment metrics
- 1% rule
- 0.66% ✗
- Cap rate
- 5.03%
- Cash-on-cash
- -4.49%
- DSCR
- 0.80
- GRM
- 12.6
CMA / ARV
- ARV (on-the-fly)
- $225,936
- Comps found
- 3
Show comp detail 3 sales within ~0.75 mi
| Address | Dist | Beds/Ba | Sqft | Sold | Price | $/sf | Match |
|---|---|---|---|---|---|---|---|
| 121 Sunflower Rd | 0.28mi | 3/2.0 (-1) | 924 (-12%) | 2mo | $199,900 | $216 | 61 |
| 138 La Fortuna Dr | 0.60mi | 3/2.0 (-1) | 1,144 (+9%) | 10mo | $252,000 | $220 | 43 |
| 120 Violeta Dr | 0.41mi | 3/2.0 (-1) | 1,152 (+10%) | 20mo | $238,900 | $207 | 42 |
Match score weights: distance 35% · size 25% · config 20% · recency 20%. Top-matched comps best support the ARV.
Projected returns pro-forma
10.0% appreciation · 3.0% rent growth · sell at horizon
- IRR
- 21.1%
- Equity multiple
- 2.71×
- Total profit
- $129,891
- Equity at exit
- $245,039
- IRR
- 19.1%
- Equity multiple
- 6.21×
- Total profit
- $396,638
- Equity at exit
- $528,436
Cash invested: $76,160 (down + closing). Projections, not guarantees.
Landlord ↔ Tenant lean methodology
- Overall (STATE)
- 87 Strongly Landlord-Friendly
- State Texas
- 87 Strongly Landlord-Friendly · R+5
- County
- — inherits STATE
- City
- — inherits STATE
ZIP-level market 78616
- Home prices YoY
- 4.8%
- Active inventory
- 202
- Price-to-rent
- 12.6×
Monthly cashflow live
- Estimated rent
- $1,800 medium interval (Pro) →
- Mortgage (P&I)
- −$1,426
- Tax from tax record
- −$168 /mo · $2,010/yr
- Insurance
- −$113
- HOA
- −$0
- Vacancy / Maint / Mgmt
- −$378
- Net cashflow
- $-285
Break-even live
Sensitivity live
| Price | -10% $-131 | -5% $-208 | +0% $-285 | +5% $-362 | +10% $-439 |
|---|---|---|---|---|---|
| Rent | -10% $-427 | -5% $-356 | +0% $-285 | +5% $-214 | +10% $-143 |
| Rate | -1.0pp $-148 | -0.5pp $-216 | base $-285 | +0.5pp $-356 | +1.0pp $-427 |
UW: 25.0% down · 7.5% · 30yr · 1.5% tax · 5.0% vac · 8.0% maint · 8.0% mgmt
Financing live
Cash to close
- Down payment
- $68,000
- Closing costs
- $8,160
- Reserves months
- —
- Total cash needed
- —
Loan-product check · same deal, 3 products live
Conventional
25% down · 7.5% · 30yr
- Down + closing
- —
- Monthly P&I
- —
- Monthly cashflow
- —
- DSCR
- —
- Eligible?
- —
Personal DTI + credit; lowest rate.
DSCR
20% down · 8.5% · 30yr
- Down + closing
- —
- Monthly P&I
- —
- Monthly cashflow
- —
- DSCR
- —
- Eligible?
- —
No personal income docs; deal must DSCR.
Hard money
10% down · 12.0% · 12mo
- Down + closing
- —
- Monthly P&I
- —
- Monthly cashflow
- —
- DSCR
- —
- Eligible?
- —
Short-term bridge; refi at stabilization.
Rent comps 1 comps
| Address | Beds | Baths | Sqft | Rent | $/sqft | DOM | Units | Dist |
|---|---|---|---|---|---|---|---|---|
| 116 Mazatlan Dr Del Valle, TX | 4.0 | 2.0 | 1200 | $1,800 | $1.50 | 6d | 1 | 1.24mi |
Listing history 5 events
-
2024-06-21status Pending
-
2023-08-31$272,000 Active
-
2023-05-05price
-
2023-01-27Active
-
2022-05-12Active
ⓘ Source: listings_history table (triggers on properties + properties_extension) + one-shot
backfill from property_details.listing_events for pre-trigger history.
Tax reassessment forecast TX · Resets to sale price
- Current annual tax
- $2,010 · $168/mo
- Projected year-2 tax
- $4,978 · $415/mo
- Expected delta
- +$2,967/yr (+$247/mo · 147.6%)
ⓘ Screening estimate from a state-policy table — verify with the county assessor before closing.
Climate risk First Street
- Flood 1/10 Low FEMA zone X (unshaded) · 0% chance over 30 yrs
- Wildfire 5/10 Major
- Heat 8/10 Severe 7 d/yr ≥108°F today · 22 d/yr by 30 yrs out
- Wind 8/10 Severe 80% chance of damaging wind over 30 yrs
- Air quality 1/10 Low 0 unhealthy d/yr today · 0 by 30 yrs out
Nearby sold comps map
Loading sold comps map…
Walkable amenities ~0.75 mi
Loading nearby amenities…
Taxation est. · year 1
- Rental income
- $21,600
- − Mortgage interest
- −$15,236
- − Property taxes
- −$2,010
- − Insurance
- −$1,360
- − Repairs & maintenance
- −$1,728
- − Management
- −$1,728
- − Depreciation
- −$7,913
- Taxable loss
- −$8,375
- Est. tax savings @ 24.0%
- +$2,010
- After-tax cash flow
- $-1,413/yr
For passive investors: Depreciation is non-cash, so a rental often shows a tax loss while cash-flowing — sheltering income. Rental losses are passive: they offset passive income freely, and up to $25,000/yr can offset ordinary (W-2) income if you actively participate and your MAGI is under $100k (phasing out to $0 by $150k); unused losses carry forward. On sale, claimed depreciation is recaptured at up to 25%, and gains may owe capital-gains tax (a 1031 exchange can defer both). Figures are a year-1 estimate at your 24.0% rate — not tax advice; consult a CPA.
Schools (NCES district)
- District
- Bastrop ISD
- NCES district ID
- 4809570
- Math proficiency
- 25% ▼ -13.00%
- Reading proficiency
- 28% ▼ -4.00%
- Median HH income
- $56,010
- Composite
- 23.87/100
- National rank
- #7799
- State rank
- #670 of 826 in TX
Livability — Mustang Ridge
- Score
- 63/100
- State rank
- #854
- US rank
- #15380
Category grades
Schools grade is shown separately in the Schools card above.
Census & demographics
- Population (ZIP)
- 10,008
Population outlook (Bastrop County) Hauer SSP2
- Today (2025)
- 94,260 people
- By 2030
- 101,355 · +7.5%
- By 2040
- 115,578 · +22.6%
- By 2050
- 129,464 · +37.3%
- By 2075
- 168,068 · +78.3%
- By 2100
- 194,857 · +106.7%
Race, ethnicity, and origin ACS 2023
- Neighborhood character
- Predominantly Hispanic (77%)
- Race & ethnicity
- Hispanic / Latino 77% Two or more races 48% White 17% Native American 2% Black 1%
- Hispanic origin (detail)
- Mexican 72%
- Common ancestry
- Iranian 1% Romanian 1% Lithuanian 1%
- Foreign-born
- 24% · Canada
- Languages at home
- 48% English-only · Spanish 51% German/W. Germanic 1%
Political lean MEDSL · Bastrop
- 2024 margin
- R (+18.4) · D 40.2% · R 58.6% · Other 1.2%
- 2008→2024 swing
- -10.2pp toward R · 2008: -8.2pp · 2024: -18.4pp
- All cycles
- 2024: R+18.4 2020: R+13.8 2016: R+20.4 2012: R+17.0 2008: R+8.2
Not yet ingested
- Civics
- —
Market trends
- HPI YoY
- ▲ 14.00%
- Current HPI
- 308.45
- Rent YoY
- —
- Metro
- —
- State GDP YoY
- ▲ 3.95%
- F500 in state
- 110
Industry mix (Fortune 500 HQ in TX)
| Industry | F500 HQs | Revenue |
|---|---|---|
| Energy | 16 | $1,198B |
|
||
| Technology | 5 | $198B |
|
||
| Engineering / Construction | 4 | $72B |
|
||
| Energy Services | 3 | $60B |
|
||
| Utilities | 3 | $41B |
|
||
| Healthcare | 2 | $330B |
|
||
Price history
5 events — show timeline
- 2024-06-21 Pending — Unlock MLS
- 2023-08-31 Listed $272,000 Unlock MLS
- 2023-05-05 Price Changed — Unlock MLS
- 2023-01-27 Listed — Unlock MLS
- 2022-05-12 Listed — Unlock MLS
Property tax history
+132.1%/yrLatest (2025): $2,010 · +8.1% YoY. Source: county tax records.
Cash-flow waterfall
monthlySold comps — $/sqft
last 12 mo · ≤1 miLoading sold comps…