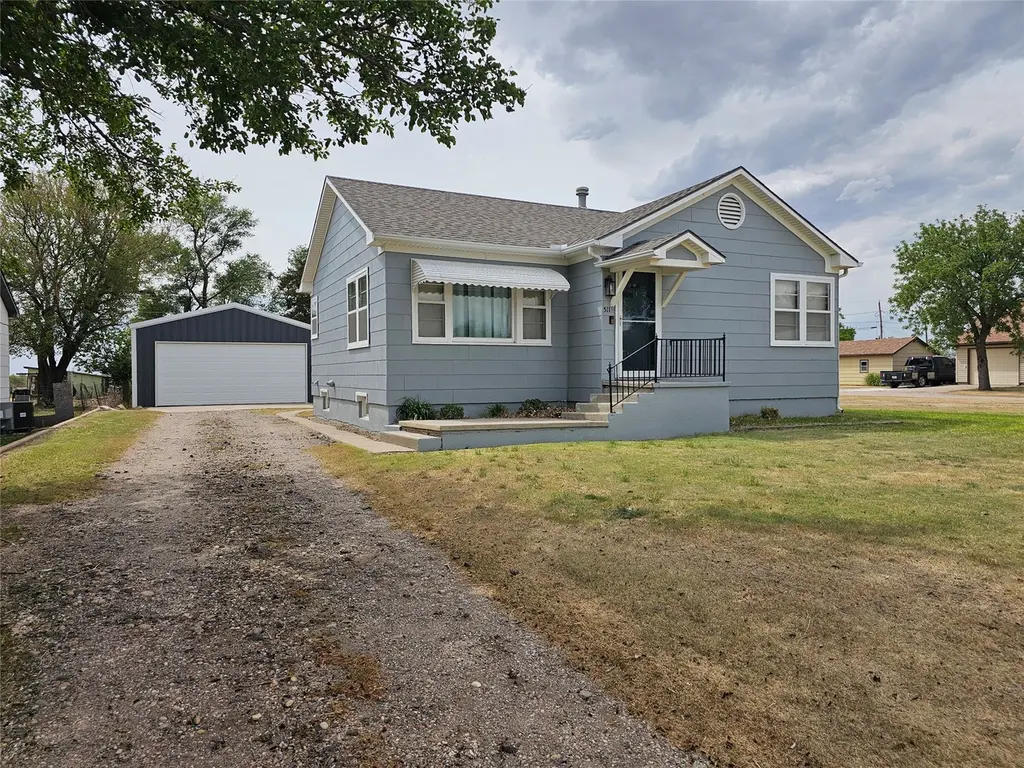
511 Maple · Fowler, KS
Flood risk 1/10 · Minimal
- FEMA flood zone
- —
- Chance of flooding over 30 yrs
- 0.0%
- Est. flood insurance / yr
- —
Fire risk 6/10 · Moderate
- Est. fire insurance / yr
- $1,154 – $2,142
Heat risk 5/10 · Moderate
- Hot days now (above 103°F)
- 7 days/yr
- Hot days in 30 yrs
- 19 days/yr
Wind risk 2/10 · Minimal
- Chance of severe wind over 30 yrs
- —
Air-quality risk 2/10 · Minimal
- Unhealthy air days now
- 1 days/yr
- Unhealthy air days in 30 yrs
- 1 days/yr
Risk factors via First Street. Map © Google.
Why this score? — see what drove the C grade
The composite is a weighted blend of 9 inputs, each scored 0–100. Each bar is that input's sub-score; the figure is the points it added to the 100-point composite (weight × sub-score).
- Cash flow +20.2/30.0
- ARV discount +7.5/15.0
- DSCR +6.4/10.0
- 1% rule +6.1/10.0
- Appreciation +4.1/10.0
- Livability +3.1/5.0
- Schools +2.7/10.0
- Rent growth +2.5/5.0
- Condition / age +2.5/5.0
$80,000
🖨 Deal sheet (PDF) 📄 Offer letter ✓ Due diligence
Key facts
- Insulated garage
- Large family room
- Natural light
Tags
Property features AI
Exterior
- Parking: Attached garage with 2 covered spaces
- Utilities: Public water; Public sewer
- Home design: Single-family residential home; One level
- Construction: Frame and Masonite construction; Composition roof; Concrete perimeter foundation; Above-grade finished area and below-grade finished area each listed as 1,000
- Exterior features: Rain gutters; No fencing listed; Lot approximately 8,640 sq ft (0.198 acres)
Interior
- Kitchen: Gas oven; Exhaust fan; Refrigerator; Gas water heater
- Flooring: Carpet; Concrete; Hardwood; Laminate; Linoleum
- Bathrooms: Two full bathrooms
- Heating & cooling: Forced air heating (natural gas); Central air conditioning; Ceiling fans; Electric cooling
- Interior features: Screens, storm windows, wood window frames and window treatments; Humidifier; No fireplace
- Laundry & utility: Laundry in basement; Full concrete basement
Neighborhood map
What this means for you Summary
Snapshot
- This is a 2-bed/1.5-bath single-family listed at $80k.
Deal economics
- At list price, monthly cash flow is $100 ($1k/yr) — positive.
- The deal already cash-flows at list — no discount required.
- Meets the 1% rule at list price ($890 rent vs $80k).
Location & tenants
- Location reads 62/100 on livability (#369 in KS) — a middle-class / working-renter tenant base. Strengths: cost of living A+, health & safety A+, housing B; Watch: crime F, amenities F, commute F.
- Fowler (rural): math 30% / reading 25% proficiency, ranked #194 of 280 in KS (top 69%) — low school quality limits family demand, transient renter base, plan for 1-2y turnover.
- Zoned schools: Fowler Elem (math 50% / reading 30%, grade F, #315 of 684 statewide, top 47%, 40 students, 65% FRL); Fowler High (math 24% / reading 15%, grade F, #198 of 327 statewide, top 66%, 30 students, 50% FRL).
- Market conditions: 9 active listings in the ZIP; 5 units permitted in Meade County in 2024 (0 in 5+ unit buildings).
Forward outlook
- Local home prices are declining (-1.8%/yr); year-one equity from $553 of loan paydown is wiped out by about $1k of value loss. Plan a longer hold.
- Meade County population projected at -35% by 2050 — secular population decline; favor cash flow + early exit over multi-decade hold.
Negotiation context
- Only 6 days on market — expect competitive offers; lowballing is unlikely to land.
- 2 sale attempts since 2y ago with the ask held roughly flat each time — persistent listings suggest the price (not the market) is what's stuck; bring a comps-based counter.
Risks & watch-outs
- Watch-outs: built in 1950 — expect roof / HVAC / electrical / plumbing capex.
- Climate carrying-cost: major wildfire risk; extreme-heat days projected 7→19/yr by 2055 (HVAC capex compounding) — expect insurance premiums to compound above CPI over the hold.
Questions for the listing agent
- Built in 1950 — when were the roof, HVAC, electrical panel, plumbing, and water heater last replaced?
- Is there a deadline driving the sale (1031 exchange, divorce, estate, relocation)? That informs how much negotiation room exists.
- Schools are D-rated, which usually means shorter tenancies and higher turnover. Who's the typical renter profile here, and what's been the actual vacancy rate?
- Crime grade is F in this area — have there been break-ins, vandalism, or insurance claims at this property in the last 3 years? What carrier currently insures it and at what premium?
- What's the average days-on-market for RENTAL listings here right now (not sales)? A rising rental-DOM trend means longer vacancies and softer asking-rent achievability than the comps imply.
- What's the recent tenant-quality profile in this submarket — average credit score on applications, eviction rate, late-payment / NSF rate, and stable-employment percentage? A property-management company in the area should have these aggregated.
- How much new for-sale + rental construction is in the pipeline within 1–3 miles? Heavy new supply typically softens prices + rents 12–24 months out; constrained supply supports both.
Investment metrics
- 1% rule
- 1.11% ✓
- Cap rate
- 7.80%
- Cash-on-cash
- 5.38%
- DSCR
- 1.24
- GRM
- 7.5
CMA / ARV
No comps found within radius.
Projected returns pro-forma
-1.84% appreciation · 3.0% rent growth · sell at horizon
- IRR
- -2.8%
- Equity multiple
- 0.89×
- Total profit
- $-2,570
- Equity at exit
- $16,133
- IRR
- 5.0%
- Equity multiple
- 1.43×
- Total profit
- $9,732
- Equity at exit
- $14,360
Cash invested: $22,400 (down + closing). Projections, not guarantees.
Landlord ↔ Tenant lean methodology
- Overall (STATE)
- 83 Strongly Landlord-Friendly
- State Kansas
- 83 Strongly Landlord-Friendly · R+10
- County
- — inherits STATE
- City
- — inherits STATE
ZIP-level market 67844
- Home prices YoY
- -1.1%
- Active inventory
- 9
- Price-to-rent
- 7.5×
Monthly cashflow live
- Estimated rent
- $890 medium interval (Pro) →
- Mortgage (P&I)
- −$420
- Tax from tax record
- −$150 /mo · $1,795/yr
- Insurance
- −$33
- HOA
- −$0
- Vacancy / Maint / Mgmt
- −$187
- Net cashflow
- $100
Break-even live
Sensitivity live
| Price | -10% $146 | -5% $123 | +0% $100 | +5% $78 | +10% $55 |
|---|---|---|---|---|---|
| Rent | -10% $30 | -5% $65 | +0% $100 | +5% $136 | +10% $171 |
| Rate | -1.0pp $141 | -0.5pp $121 | base $100 | +0.5pp $80 | +1.0pp $59 |
UW: 25.0% down · 7.5% · 30yr · 1.5% tax · 5.0% vac · 8.0% maint · 8.0% mgmt
Financing live
Cash to close
- Down payment
- $20,000
- Closing costs
- $2,400
- Reserves months
- —
- Total cash needed
- —
Loan-product check · same deal, 3 products live
Conventional
25% down · 7.5% · 30yr
- Down + closing
- —
- Monthly P&I
- —
- Monthly cashflow
- —
- DSCR
- —
- Eligible?
- —
Personal DTI + credit; lowest rate.
DSCR
20% down · 8.5% · 30yr
- Down + closing
- —
- Monthly P&I
- —
- Monthly cashflow
- —
- DSCR
- —
- Eligible?
- —
No personal income docs; deal must DSCR.
Hard money
10% down · 12.0% · 12mo
- Down + closing
- —
- Monthly P&I
- —
- Monthly cashflow
- —
- DSCR
- —
- Eligible?
- —
Short-term bridge; refi at stabilization.
Listing history 5 events
-
2026-05-12status Pending
-
2026-05-04$80,000 Active
-
2024-10-11soldstatus
-
2024-07-29$77,500
-
1989-10-01soldstatus
ⓘ Source: listings_history table (triggers on properties + properties_extension) + one-shot
backfill from property_details.listing_events for pre-trigger history.
Tax reassessment forecast KS · Resets to sale price
- Current annual tax
- $1,795 · $150/mo
- Projected year-2 tax
- $1,795 · $150/mo
- Expected delta
- $0/yr ($0/mo · 0.0%)
ⓘ Screening estimate from a state-policy table — verify with the county assessor before closing.
Climate risk First Street
- Flood 1/10 Low 0% chance over 30 yrs
- Wildfire 6/10 Major
- Heat 5/10 Major 7 d/yr ≥103°F today · 19 d/yr by 30 yrs out
- Wind 2/10 Low
- Air quality 2/10 Low 1 unhealthy d/yr today · 1 by 30 yrs out
Nearby sold comps map
Loading sold comps map…
Walkable amenities ~0.75 mi
Loading nearby amenities…
Taxation est. · year 1
- Rental income
- $10,677
- − Mortgage interest
- −$4,481
- − Property taxes
- −$1,795
- − Insurance
- −$400
- − Repairs & maintenance
- −$854
- − Management
- −$854
- − Depreciation
- −$2,327
- Taxable loss
- −$35
- Est. tax savings @ 24.0%
- +$8
- After-tax cash flow
- $1,214/yr
For passive investors: Depreciation is non-cash, so a rental often shows a tax loss while cash-flowing — sheltering income. Rental losses are passive: they offset passive income freely, and up to $25,000/yr can offset ordinary (W-2) income if you actively participate and your MAGI is under $100k (phasing out to $0 by $150k); unused losses carry forward. On sale, claimed depreciation is recaptured at up to 25%, and gains may owe capital-gains tax (a 1031 exchange can defer both). Figures are a year-1 estimate at your 24.0% rate — not tax advice; consult a CPA.
Schools (NCES district)
- District
- Fowler
- NCES district ID
- 2006210
- Math proficiency
- 30% ▲ 5.00%
- Reading proficiency
- 25% ▬ 0.00%
- Median HH income
- $44,882
- Composite
- 26.59/100
- National rank
- #12599
- State rank
- #194 of 280 in KS
Livability — Fowler
- Score
- 62/100
- State rank
- #369
- US rank
- #16562
Category grades
Schools grade is shown separately in the Schools card above.
Census & demographics
- Census place
- Fowler, KS
- Population (ZIP)
- 726
Population outlook (Meade County) Hauer SSP2
- Today (2025)
- 3,775 people
- By 2030
- 3,511 · -7.0%
- By 2040
- 2,980 · -21.1%
- By 2050
- 2,460 · -34.8%
- By 2075
- 1,685 · -55.4%
- By 2100
- 1,235 · -67.3%
Race, ethnicity, and origin ACS 2023
- Neighborhood character
- Predominantly White (73%)
- Race & ethnicity
- White 73% Hispanic / Latino 22% Two or more races 5% Native American 3%
- Hispanic origin (detail)
- Mexican 13% Cuban 7%
- Common ancestry
- Slovak 2% Portuguese 1% Scottish 1%
- Foreign-born
- 8% · Canada
- Languages at home
- 84% English-only · Spanish 16%
Political lean MEDSL · Meade
- 2024 margin
- Solid R (+69.6) · D 14.6% · R 84.2% · Other 1.2%
- 2008→2024 swing
- -8.4pp toward R · 2008: -61.3pp · 2024: -69.6pp
- All cycles
- 2024: R+69.6 2020: R+69.0 2016: R+70.7 2012: R+69.2 2008: R+61.3
Not yet ingested
- Civics
- —
Market trends
- HPI YoY
- ▼ -1.84%
- Current HPI
- 169.9664
- Rent YoY
- —
- Metro
- —
- State GDP YoY
- —
- F500 in state
- 0
Price history
+3.2% since first listed5 events — show timeline
- 2026-05-12 Pending — GardenMLS
- 2026-05-04 Listed $80,000 GardenMLS
- 2024-10-11 Sold (MLS) — GardenMLS
- 2024-07-29 Listed $77,500 GardenMLS
- 1989-10-01 Sold (Public Records) — Public Records
Property tax history
+5.3%/yrLatest (2025): $1,795 · -0.6% YoY. Source: county tax records.
Cash-flow waterfall
monthlySold comps — $/sqft
last 12 mo · ≤1 miLoading sold comps…