1023 Mercury · Crestline, CA
Flood risk 1/10 · Minimal
- FEMA flood zone
- D
- Chance of flooding over 30 yrs
- 0.0%
- Est. flood insurance / yr
- $544 – $1,084
Fire risk 8/10 · Major
- Est. fire insurance / yr
- $659 – $1,223
Heat risk 2/10 · Minimal
- Hot days now (above threshold)
- —
- Hot days in 30 yrs
- —
Wind risk 1/10 · Minimal
- Chance of severe wind over 30 yrs
- —
Air-quality risk 10/10 · Severe
- Unhealthy air days now
- 26 days/yr
- Unhealthy air days in 30 yrs
- 33 days/yr
Risk factors via First Street. Map © Google.
Why this score? — see what drove the C- grade
The composite is a weighted blend of 9 inputs, each scored 0–100. Each bar is that input's sub-score; the figure is the points it added to the 100-point composite (weight × sub-score).
- Cash flow +17.2/30.0
- ARV discount +15.0/15.0
- DSCR +5.4/10.0
- 1% rule +4.3/10.0
- Rent growth +3.7/5.0
- Livability +2.8/5.0
- Condition / age +2.5/5.0
- Schools +2.1/10.0
- Appreciation +0.0/10.0
$219,900
🖨 Deal sheet 📄 Offer letter ✓ Due diligence
Listing remarks MLS
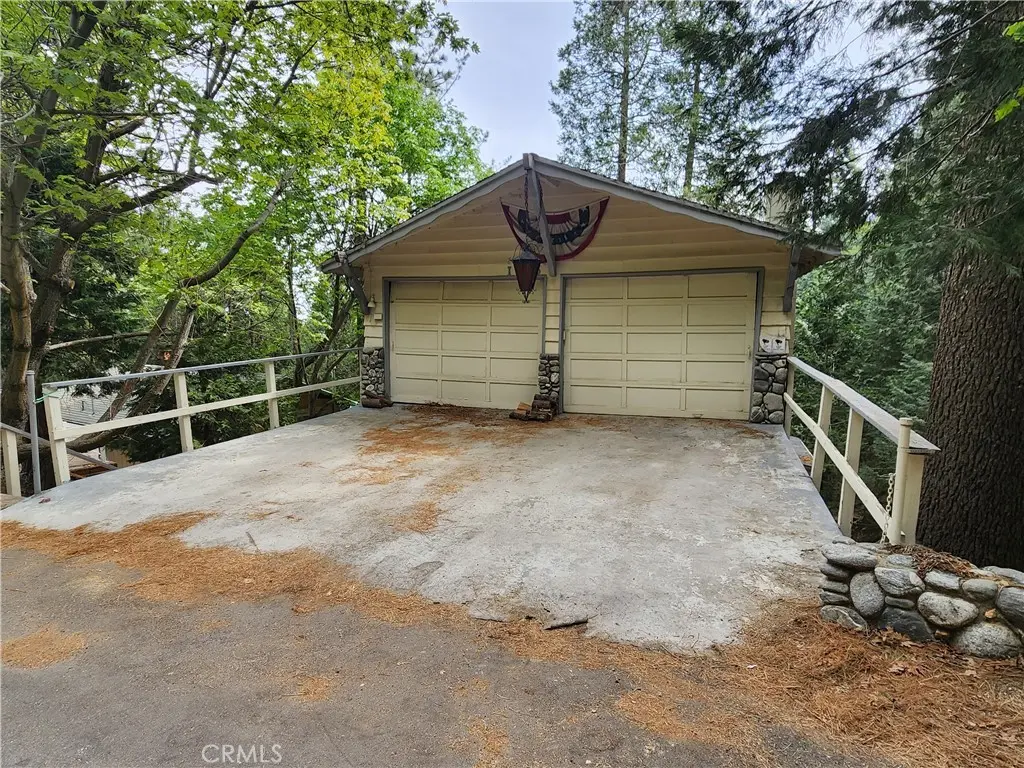
Charming mountain fixer home with great upside potential! Features an oversized garage and tons of parking! Great open floorplan with open beamed ceilings, cozy rock fireplace and generous wall of windows facing out to a lush forested setting. Nice sense of privacy and feeling of being in the woods/forest. Home is somewhat split level with kitchen living room bathroom area and then stairs up to two bedrooms plus a tiny kids sleeping loft. Owner prefers cash or hard money offers and no repairs will be made by the owner. Home is in need of lots of TLC and won't go FHA/VA or Conventional financing.
Key facts
- Cozy rock fireplace
- Tons of parking
- Oversized garage
Tags
Neighborhood map
What this means for you Summary
Snapshot
- This is a 2-bed/1.0-bath single-family listed at $220k.
Deal economics
- At list price, monthly cash flow is $159 ($2k/yr) — positive.
- The deal already cash-flows at list — no discount required.
- To meet the 1% rule (rent ≥ 1% of price), the offer needs to be $204k (7.2% below list).
- Recommended offer: $204k (7.2% below list) — sets the bar for 1% rule.
- Cap rate 7.2% vs local median 3.9% in Crestline — top-decile yield for the area; either an underpriced asset or a hidden risk that comps aren't pricing in. Stress-test before assuming the spread holds.
Location & tenants
- Location reads 56/100 on livability (#805 in CA) — a working-class tenant base; expect higher turnover. Strengths: housing A+; Watch: commute D, schools D-, crime F.
- Rim Of The World Unified (town): math 13% / reading 34% proficiency, ranked #415 of 517 in CA (top 80%) — low school quality limits family demand, transient renter base, plan for 1-2y turnover.
- Market conditions: Rents rising fast (+4.7%/yr); 252 active listings in the ZIP; 12 comparable units currently listed for rent nearby; rentals at typical pace (median 22d on market — plan ~3-4 weeks tenant-placement turnaround); 5,458 units permitted in San Bernardino County in 2024 (1,500 in 5+ unit buildings).
- This rent runs 35% of the median local income ($71k/yr) — at the standard rent-burdened threshold; future hikes will face affordability resistance.
Forward outlook
- Local home prices are declining (-3.0%/yr); year-one equity from $2k of loan paydown is wiped out by about $7k of value loss. Plan a longer hold.
- San Bernardino County population projected at +15% by 2050 — modest demand growth; plan on rents tracking national, not racing it.
Negotiation context
- It's been on market 64 days — a 6% lower offer ($207k) is reasonable based on typical stale-listing flexibility.
- Current owner paid $72k; list at $220k implies a 203% gain — meaningful room to come down on a strong offer.
Risks & watch-outs
- Climate carrying-cost: severe wildfire risk — expect insurance premiums to compound above CPI over the hold.
Questions for the listing agent
- It's been on market 64 days. Have you received any prior offers? Is the seller open to a 7% concession, seller financing, or rate buy-down credit?
- Built in 1970 — when were the roof, HVAC, electrical panel, plumbing, and water heater last replaced?
- Why hasn't it sold? Are there any deal-killer items the seller is aware of (foundation, flood, title, zoning, code violations)?
- Is there a deadline driving the sale (1031 exchange, divorce, estate, relocation)? That informs how much negotiation room exists.
- Schools are D-rated, which usually means shorter tenancies and higher turnover. Who's the typical renter profile here, and what's been the actual vacancy rate?
- Crime grade is F in this area — have there been break-ins, vandalism, or insurance claims at this property in the last 3 years? What carrier currently insures it and at what premium?
- What's the average days-on-market for RENTAL listings here right now (not sales)? A rising rental-DOM trend means longer vacancies and softer asking-rent achievability than the comps imply.
- What's the recent tenant-quality profile in this submarket — average credit score on applications, eviction rate, late-payment / NSF rate, and stable-employment percentage? A property-management company in the area should have these aggregated.
- How much new for-sale + rental construction is in the pipeline within 1–3 miles? Heavy new supply typically softens prices + rents 12–24 months out; constrained supply supports both.
Investment metrics
- 1% rule
- 0.93% ✗
- Cap rate
- 7.16%
- Cash-on-cash
- 3.09%
- DSCR
- 1.14
- GRM
- 9.0
CMA / ARV
- ARV (median comp)
- $302,313
- List price
- $219,900
- Delta
- -27.26%
- Verdict
- UNDERPRICED
- Comps
- 20 within 1.0 mi
Show comp detail 12 sales within ~0.75 mi
| Address | Dist | Beds/Ba | Sqft | Sold | Price | $/sf | Match |
|---|---|---|---|---|---|---|---|
| 23776 Lakeview Dr | 0.28mi | 2/1.0 | 822 (+1%) | 3mo | $325,000 | $395 | 84 |
| 23844 Bowl Rd | 0.37mi | 2/1.0 | 810 (-1%) | 2mo | $311,000 | $384 | 80 |
| 23743 Skyland Dr | 0.12mi | 2/1.0 | 781 (-4%) | 8mo | $249,000 | $319 | 80 |
| 956 Mercury | 0.12mi | 2/3.0 | 744 (-9%) | 4mo | $229,000 | $308 | 68 |
| 23718 Scenic | 0.42mi | 1/1.0 (-1) | 878 (+8%) | 1mo | $271,000 | $309 | 62 |
| 744 Woodland | 0.74mi | 1/1.0 (-1) | 816 (0%) | 0mo | $155,000 | $190 | 60 |
| 768 Deer | 0.49mi | 2/1.0 | 720 (-12%) | 0mo | $241,000 | $335 | 57 |
| 23996 Wildwood Ln | 0.47mi | 2/1.0 | 920 (+13%) | 6mo | $260,000 | $283 | 51 |
| 23924 Pioneer Camp Rd | 0.47mi | 1/1.0 (-1) | 700 (-14%) | 4mo | $155,950 | $223 | 46 |
| 697 Mormon Spgs | 0.66mi | 1/2.0 (-1) | 752 (-8%) | 1mo | $297,000 | $395 | 46 |
| 23690 Hillside Dr | 0.70mi | 2/1.5 | 876 (+7%) | 8mo | $269,900 | $308 | 46 |
| 23812 Wildwood Ln | 0.44mi | 1/1.0 (-1) | 704 (-14%) | 8mo | $250,000 | $355 | 45 |
Match score weights: distance 35% · size 25% · config 20% · recency 20%. Top-matched comps best support the ARV.
Projected returns pro-forma
-3.0% appreciation · 4.65% rent growth · sell at horizon
- IRR
- -9.7%
- Equity multiple
- 0.64×
- Total profit
- $-22,097
- Equity at exit
- $32,788
- IRR
- 1.8%
- Equity multiple
- 1.14×
- Total profit
- $8,345
- Equity at exit
- $19,013
Cash invested: $61,572 (down + closing). Projections, not guarantees.
Landlord ↔ Tenant lean methodology
- Overall (STATE)
- 18 Strongly Tenant-Friendly
- State California
- 18 Strongly Tenant-Friendly · D+13
- County
- — inherits STATE
- City
- — inherits STATE
ZIP-level market 92325
- Rents YoY
- 4.7%
- Active inventory
- 252
- Price-to-rent
- 9.0×
Monthly cashflow live
- Estimated rent
- $2,041 high interval (Pro) →
- Mortgage (P&I)
- −$1,153
- Tax from tax record
- −$209 /mo · $2,511/yr
- Insurance
- −$92
- HOA
- −$0
- Vacancy / Maint / Mgmt
- −$429
- Net cashflow
- $159
Break-even live
UW: 25.0% down · 7.5% · 30yr · 1.5% tax · 5.0% vac · 8.0% maint · 8.0% mgmt
Financing live
Cash to close
- Down payment
- $54,975
- Closing costs
- $6,597
- Reserves months
- —
- Total cash needed
- —
Loan-product check · same deal, 3 products live
Conventional
25% down · 7.5% · 30yr
- Down + closing
- —
- Monthly P&I
- —
- Monthly cashflow
- —
- DSCR
- —
- Eligible?
- —
Personal DTI + credit; lowest rate.
DSCR
20% down · 8.5% · 30yr
- Down + closing
- —
- Monthly P&I
- —
- Monthly cashflow
- —
- DSCR
- —
- Eligible?
- —
No personal income docs; deal must DSCR.
Hard money
10% down · 12.0% · 12mo
- Down + closing
- —
- Monthly P&I
- —
- Monthly cashflow
- —
- DSCR
- —
- Eligible?
- —
Short-term bridge; refi at stabilization.
Rent comps 12 comps
| Address | Beds | Baths | Sqft | Rent | $/sqft | DOM | Units | Dist |
|---|---|---|---|---|---|---|---|---|
| 979 Venus Way Crestline, CA | 2.0 | 2.0 | 800 | $2,500 | $3.12 | 21d | 1 | 0.22mi |
| 23920 Scenic Dr Crestline, CA | 2.0 | 1.0 | 770 | $1,795 | $2.33 | 24d | 1 | 0.26mi |
| 725 Tyrol Dr Crestline, CA | 3.0 | 2.0 | 950 | $2,300 | $2.42 | 4d | 1 | 0.50mi |
| 23654 Lake Dr Crestline, CA | 2.0 | 1.0 | 720 | $1,995 | $2.77 | 1d | 1 | 0.59mi |
| 794 Woodland Rd Unit A Crestline, CA | 2.0 | 1.0 | 686 | $1,400 | $2.04 | 16d | 1 | 0.61mi |
| 767 Woodland Rd Unit 1 Crestline, CA | 2.0 | 1.0 | 1100 | $1,700 | $1.55 | 2d | 1 | 0.68mi |
| 686 Ca-138 Crestline, CA | 2.0 | 1.0 | 720 | $1,800 | $2.50 | 3d | 1 | 0.71mi |
| 1168 Jungfrau DR San Martin, CA | 2.0 | 1.0 | 816 | $1,795 | $2.20 | 24d | 1 | 0.96mi |
| 862 Berne Dr Crestline, CA | 2.0 | 1.0 | 720 | $1,895 | $2.63 | 43d | 1 | 1.16mi |
| 198 Mile High Rd Crestline, CA | 3.0 | 2.5 | 850 | $2,300 | $2.71 | 1d | 1 | 1.26mi |
| 24906 Jewel Dr Crestline, CA | 2.0 | 1.0 | 952 | $3,000 | $3.15 | 43d | 1 | 1.40mi |
| 25138 Valle Dr Crestline, CA | 2.0 | 2.0 | 1020 | $1,975 | $1.94 | 44d | 1 | 1.42mi |
Listing history 7 events
-
2026-06-04days on market $219,900 Active 64 DOM
-
2026-06-03days on market $219,900 Active 63 DOM
-
2026-06-02days on market $219,900 Active 62 DOM
-
2026-06-01days on market $219,900 Active 61 DOM
-
2026-05-31days on market $219,900 Active 60 DOM
-
2026-04-01$219,900 Active 603-char remark
Show marketing remark (603 chars)
Charming mountain fixer home with great upside potential! Features an oversized garage and tons of parking! Great open floorplan with open beamed ceilings, cozy rock fireplace and generous wall of windows facing out to a lush forested setting. Nice sense of privacy and feeling of being in the woods/forest. Home is somewhat split level with kitchen living room bathroom area and then stairs up to two bedrooms plus a tiny kids sleeping loft. Owner prefers cash or hard money offers and no repairs will be made by the owner. Home is in need of lots of TLC and won't go FHA/VA or Conventional financing.
-
1988-07-11soldstatus $72,500
ⓘ Source: listings_history table (triggers on properties + properties_extension) + one-shot
backfill from property_details.listing_events for pre-trigger history.
Tax reassessment forecast CA · Resets to sale price
- Current annual tax
- $2,511 · $209/mo
- Projected year-2 tax
- $2,511 · $209/mo
- Expected delta
- $0/yr ($0/mo · 0.0%)
ⓘ Screening estimate from a state-policy table — verify with the county assessor before closing.
Climate risk First Street
- Flood 1/10 Low FEMA zone D · 0% chance over 30 yrs
- Wildfire 8/10 Severe
- Heat 2/10 Low
- Wind 1/10 Low
- Air quality 10/10 Extreme 26 unhealthy d/yr today · 33 by 30 yrs out
Nearby sold comps map
Loading sold comps map…
Walkable amenities ~0.75 mi
Loading nearby amenities…
Taxation est. · year 1
- Rental income
- $24,496
- − Mortgage interest
- −$12,318
- − Property taxes
- −$2,511
- − Insurance
- −$1,100
- − Repairs & maintenance
- −$1,960
- − Management
- −$1,960
- − Depreciation
- −$6,397
- Taxable loss
- −$1,749
- Est. tax savings @ 24.0%
- +$420
- After-tax cash flow
- $2,323/yr
For passive investors: Depreciation is non-cash, so a rental often shows a tax loss while cash-flowing — sheltering income. Rental losses are passive: they offset passive income freely, and up to $25,000/yr can offset ordinary (W-2) income if you actively participate and your MAGI is under $100k (phasing out to $0 by $150k); unused losses carry forward. On sale, claimed depreciation is recaptured at up to 25%, and gains may owe capital-gains tax (a 1031 exchange can defer both). Figures are a year-1 estimate at your 24.0% rate — not tax advice; consult a CPA.
Schools (NCES district)
- District
- Rim Of The World Unified
- NCES district ID
- 0632610
- Math proficiency
- 13% ▼ -10.00%
- Reading proficiency
- 34% ▼ -7.00%
- Median HH income
- $55,860
- Composite
- 21.29/100
- National rank
- #8389
- State rank
- #415 of 517 in CA
Livability — Crestline
- Score
- 56/100
- State rank
- #805
- US rank
- #22821
Category grades
Schools grade is shown separately in the Schools card above.
Census & demographics
- Census place
- Crestline, CA
- County
- San Bernardino County · 2,030,291 people
- City population
- 9,065
- Metro
- Riverside-San Bernardino-Ontario, CA
- Population (ZIP)
- 9,065
- Household income
- $70,563
- Rent vs Own
- Severe rent burden
- 179.0
Population outlook (San Bernardino County) Hauer SSP2
- Today (2025)
- 2,300,329 people
- By 2030
- 2,378,907 · +3.4%
- By 2040
- 2,523,137 · +9.7%
- By 2050
- 2,642,388 · +14.9%
- By 2075
- 2,880,769 · +25.2%
- By 2100
- 2,909,436 · +26.5%
Race, ethnicity, and origin ACS 2023
- Neighborhood character
- Predominantly White (68%)
- Race & ethnicity
- White 68% Hispanic / Latino 25% Two or more races 20% Black 2%
- Hispanic origin (detail)
- Mexican 21%
- Common ancestry
- Romanian 5% Slovak 5% Lithuanian 4%
- Foreign-born
- 9% · Canada
- Languages at home
- 85% English-only · Spanish 12% Russian/Polish/Slavic 3% German/W. Germanic 1%
Political lean MEDSL · San Bernardino
- 2024 margin
- Toss-up / Even · D 47.5% · R 49.7% · Other 2.8%
- 2008→2024 swing
- -8.5pp toward R · 2008: 6.3pp · 2024: -2.1pp
- All cycles
- 2024: R+2.1 2020: D+10.7 2016: D+9.8 2012: D+5.4 2008: D+6.3
Not yet ingested
- Civics
- —
Market trends
- HPI YoY
- ▼ -255.88%
- Current HPI
- 352.6512
- Rent YoY
- ▲ 4.65%
- Metro
- Riverside-San Bernardino-Ontario, CA
- State GDP YoY
- ▲ 3.21%
- F500 in state
- 116
Industry mix (Fortune 500 HQ in CA)
| Industry | F500 HQs | Revenue |
|---|---|---|
| Technology | 27 | $1,492B |
|
||
| Financial Services | 3 | $174B |
|
||
| Retail | 3 | $44B |
|
||
| Insurance | 3 | $26B |
|
||
| Media / Entertainment | 2 | $115B |
|
||
| Pharmaceuticals / Biotech | 2 | $62B |
|
||
Price history
+203.3% since first listed2 events — show timeline
- 2026-04-01 Listed $219,900 CRMLS
- 1988-07-11 Sold (Public Records) $72,500 Public Records
Property tax history
+4.3%/yrLatest (2025): $2,511 · +2.9% YoY. Source: county tax records.
Cash-flow waterfall
monthlySold comps — $/sqft
last 12 mo · ≤1 miLoading sold comps…