504 Barbary Coast Ln Ln · Sonterra, TX
Flood risk 1/10 · Minimal
- FEMA flood zone
- X (unshaded)
- Chance of flooding over 30 yrs
- 0.0%
- Est. flood insurance / yr
- $507 – $1,088
Fire risk 3/10 · Minor
- Est. fire insurance / yr
- $1,222 – $2,270
Heat risk 8/10 · Major
- Hot days now (above 107°F)
- 7 days/yr
- Hot days in 30 yrs
- 24 days/yr
Wind risk 8/10 · Major
- Chance of severe wind over 30 yrs
- 80.0%
Air-quality risk 2/10 · Minimal
- Unhealthy air days now
- 1 days/yr
- Unhealthy air days in 30 yrs
- 1 days/yr
Risk factors via First Street. Map © Google.
Why this score? — see what drove the D- grade
The composite is a weighted blend of 9 inputs, each scored 0–100. Each bar is that input's sub-score; the figure is the points it added to the 100-point composite (weight × sub-score).
- ARV discount +14.0/15.0
- Cash flow +7.1/30.0
- Condition / age +4.0/5.0
- 1% rule +3.0/10.0
- Livability +2.5/5.0
- Rent growth +2.1/5.0
- Schools +2.1/10.0
- DSCR +1.3/10.0
- Appreciation +0.0/10.0
$239,900
🖨 Deal sheet (PDF) 📄 Offer letter ✓ Due diligence
Listing remarks
M O T I V A T E D S E L L E R – R e c e n t l y R e d u c e d ! Welcome to 504 Barbary Coast Ln — a beautifully updated 3-bedroom, 2-bath home with a versatile bonus room that can easily serve as a 4th bedroom, office, or playroom. Located in the quiet and desirable Coolwater community, this home offers comfort, flexibility, and exceptional value. Step inside to a bright, open living space featuring updated lighting throughout and a layout perfect for both relaxing and entertaining. The kitchen opens seamlessly to the living area and includes a convenient 4-seat bar, ideal for casual dining or hosting guests. The spacious primary suite features an oversized walk-in shower,
Key facts
- Community pool
- Bonus room
- Updated lighting
Tags
Neighborhood map
What this means for you Summary
Snapshot
- This is a 3-bed/2.0-bath single-family listed at $240k. Condition is rated good.
Deal economics
- At list price, monthly cash flow is $-340 ($-4k/yr) — negative.
- To cash-flow at today's rent, offer at most $180k (25.0% below list).
- To meet the 1% rule (rent ≥ 1% of price), the offer needs to be $192k (19.9% below list).
- Recommended offer: $180k (25.0% below list) — sets the bar for cash-flow.
Location & tenants
- Location reads: area grade D — affects rentability + tenant quality, not the cash-flow math above.
- Jarrell ISD (rural): math 19% / reading 28% proficiency, ranked #713 of 826 in TX (top 86%) — low school quality limits family demand, transient renter base, plan for 1-2y turnover.
- Market conditions: Rents soft (-1.7%/yr); 773 active listings in the ZIP; 33 comparable units currently listed for rent nearby; rentals at typical pace (median 19d on market — plan ~3-4 weeks tenant-placement turnaround); solid renter incomes; 7,543 units permitted in Williamson County in 2024 (1,425 in 5+ unit buildings).
Forward outlook
- Local home prices are declining (-3.0%/yr); year-one equity from $2k of loan paydown is wiped out by about $7k of value loss. Plan a longer hold.
- Williamson County population projected at +69% by 2050 — long-run rental-demand tailwind backs the buy-and-hold thesis.
Negotiation context
- It's been on market 23 days — a 2% lower offer ($236k) is reasonable based on typical stale-listing flexibility.
Risks & watch-outs
- Climate carrying-cost: severe wind risk, 80% chance of damaging wind over 30y; extreme-heat days projected 7→24/yr by 2055 (HVAC capex compounding) — expect insurance premiums to compound above CPI over the hold.
Questions for the listing agent
- What do current leases actually rent for vs. the listed asking? Can we see a recent rent roll and the last 12 months of T-12 income?
- What does the HOA fee cover, when was the last increase, and are there any pending special assessments or reserve-fund shortfalls?
- Is there a deadline driving the sale (1031 exchange, divorce, estate, relocation)? That informs how much negotiation room exists.
- The area grade is low — what's the realistic commute time and amenity access for the typical tenant pool here? Any planned neighborhood developments (good or bad) we should know about?
- What's the average days-on-market for RENTAL listings here right now (not sales)? A rising rental-DOM trend means longer vacancies and softer asking-rent achievability than the comps imply.
- What's the recent tenant-quality profile in this submarket — average credit score on applications, eviction rate, late-payment / NSF rate, and stable-employment percentage? A property-management company in the area should have these aggregated.
- How much new for-sale + rental construction is in the pipeline within 1–3 miles? Heavy new supply typically softens prices + rents 12–24 months out; constrained supply supports both.
Investment metrics
- 1% rule
- 0.80% ✗
- Cap rate
- 4.59%
- Cash-on-cash
- -6.07%
- DSCR
- 0.73
- GRM
- 10.4
CMA / ARV
- ARV (median comp)
- $280,433
- List price
- $239,900
- Delta
- -14.45%
- Verdict
- UNDERPRICED
- Comps
- 20 within 1.0 mi
Show comp detail 12 sales within ~0.75 mi
| Address | Dist | Beds/Ba | Sqft | Sold | Price | $/sf | Match |
|---|---|---|---|---|---|---|---|
| 129 Starpacker Ln | 0.30mi | 3/2.0 | 1,418 (+2%) | 1mo | $218,999 | $154 | 82 |
| 125 Starpacker Ln | 0.30mi | 3/2.0 | 1,409 (+1%) | 3mo | $227,990 | $162 | 82 |
| 109 Starpacker Ln | 0.28mi | 3/2.0 | 1,409 (+1%) | 4mo | $239,990 | $170 | 82 |
| 149 Starpacker Ln | 0.32mi | 3/2.0 | 1,418 (+2%) | 0mo | $204,999 | $145 | 81 |
| 141 Starpacker Ln | 0.31mi | 3/2.0 | 1,418 (+2%) | 1mo | $204,999 | $145 | 81 |
| 113 Starpacker Ln | 0.28mi | 3/2.0 | 1,418 (+2%) | 3mo | $226,990 | $160 | 81 |
| 360 Brannigan Dr | 0.36mi | 3/2.0 | 1,409 (+1%) | 1mo | $216,999 | $154 | 80 |
| 117 Morrison Dr | 0.15mi | 3/2.0 | 1,305 (-6%) | 4mo | $232,900 | $178 | 80 |
| 364 Brannigan Dr | 0.36mi | 3/2.0 | 1,418 (+2%) | 3mo | $218,990 | $154 | 78 |
| 117 Starpacker Ln | 0.29mi | 3/2.0 | 1,273 (-8%) | 1mo | $201,999 | $159 | 72 |
| 505 Yellow Ribbon Trl | 0.24mi | 3/2.0 | 1,252 (-10%) | 2mo | $279,900 | $224 | 70 |
| 129 Morrison Dr | 0.17mi | 3/2.0 | 1,580 (+14%) | 2mo | $252,900 | $160 | 68 |
Match score weights: distance 35% · size 25% · config 20% · recency 20%. Top-matched comps best support the ARV.
Projected returns pro-forma
-3.0% appreciation · 0.0% rent growth · sell at horizon
- IRR
- -30.6%
- Equity multiple
- 0.02×
- Total profit
- $-66,008
- Equity at exit
- $35,770
- IRR
- -56.4%
- Equity multiple
- -0.59×
- Total profit
- $-106,511
- Equity at exit
- $20,742
Cash invested: $67,172 (down + closing). Projections, not guarantees.
Landlord ↔ Tenant lean methodology
- Overall (STATE)
- 87 Strongly Landlord-Friendly
- State Texas
- 87 Strongly Landlord-Friendly · R+5
- County
- — inherits STATE
- City
- — inherits STATE
ZIP-level market 76537
- Home prices YoY
- -14.4%
- Rents YoY
- -1.7%
- Active inventory
- 773
- Price-to-rent
- 10.4×
Monthly cashflow live
- Estimated rent
- $1,922 high interval (Pro) →
- Mortgage (P&I)
- −$1,258
- Tax from tax record
- −$480 /mo · $5,766/yr
- Insurance
- −$100
- HOA
- −$20
- Vacancy / Maint / Mgmt
- −$404
- Net cashflow
- $-340
Break-even live
Sensitivity live
| Price | -10% $-204 | -5% $-272 | +0% $-340 | +5% $-408 | +10% $-476 |
|---|---|---|---|---|---|
| Rent | -10% $-492 | -5% $-416 | +0% $-340 | +5% $-264 | +10% $-188 |
| Rate | -1.0pp $-219 | -0.5pp $-279 | base $-340 | +0.5pp $-402 | +1.0pp $-465 |
UW: 25.0% down · 7.5% · 30yr · 1.5% tax · 5.0% vac · 8.0% maint · 8.0% mgmt
Financing live
Cash to close
- Down payment
- $59,975
- Closing costs
- $7,197
- Reserves months
- —
- Total cash needed
- —
Loan-product check · same deal, 3 products live
Conventional
25% down · 7.5% · 30yr
- Down + closing
- —
- Monthly P&I
- —
- Monthly cashflow
- —
- DSCR
- —
- Eligible?
- —
Personal DTI + credit; lowest rate.
DSCR
20% down · 8.5% · 30yr
- Down + closing
- —
- Monthly P&I
- —
- Monthly cashflow
- —
- DSCR
- —
- Eligible?
- —
No personal income docs; deal must DSCR.
Hard money
10% down · 12.0% · 12mo
- Down + closing
- —
- Monthly P&I
- —
- Monthly cashflow
- —
- DSCR
- —
- Eligible?
- —
Short-term bridge; refi at stabilization.
Rent comps 33 comps
| Address | Beds | Baths | Sqft | Rent | $/sqft | DOM | Units | Dist |
|---|---|---|---|---|---|---|---|---|
| 105 McLintock Rd Jarrell, TX | 3.0–5.0 | 2.0–3.5 | 1773 | $2,055 | $1.16 | 2d | 1 | 0.01mi |
| 313 McLintock Rd Jarrell, TX | 4.0 | 2.0 | 1855 | $2,000 | $1.08 | 3d | 1 | 0.07mi |
| 121 Old Stagecoach Rd Jarrell, TX | 4.0 | 2.0 | 1531 | $1,800 | $1.18 | 44d | 1 | 0.10mi |
| 221 Barbary Coast Ln Jarrell, TX | 3.0 | 2.0 | 1450 | $1,750 | $1.21 | 2d | 1 | 0.11mi |
| 104 Fighting Seabees Run Unit NA Jarrell, TX | 2.0 | 1.0 | 900 | $1,500 | $1.67 | 3d | 1 | 0.12mi |
| 201 Fighting Seabees Run Jarrell, TX | 4.0 | 2.0 | 1667 | $1,900 | $1.14 | 8d | 1 | 0.12mi |
| 120 Morrison Dr Jarrell, TX | 3.0 | 2.0 | 1580 | $2,210 | $1.40 | 17d | 1 | 0.19mi |
| 360 Brannigan Dr Jarrell, TX | 3.0 | 2.0 | 1409 | $1,700 | $1.21 | 2d | 1 | 0.35mi |
| 252 Wild Wind Trl Jarrell, TX | 3.0 | 2.0 | 1243 | $1,650 | $1.33 | 18d | 1 | 0.60mi |
| 107 Wild Wind Cv Jarrell, TX | 3.0 | 2.0 | 1214 | $1,700 | $1.40 | 44d | 1 | 0.62mi |
| 154 Hammond Jarrell, TX | 3.0 | 2.0 | 1500 | $1,900 | $1.27 | 4d | 1 | 0.71mi |
| 112 Ragnar Jarrell, TX | 3.0 | 2.0 | 1251 | $1,495 | $1.20 | 17d | 1 | 0.76mi |
| 112 Ragnar Jarrell, TX | 3.0 | 2.0 | 1251 | $1,495 | $1.20 | 20d | 1 | 0.76mi |
| 104 Hellfighters Way Jarrell, TX | 3.0 | 2.5 | 1619 | $2,000 | $1.24 | 44d | 1 | 0.82mi |
| 449 Stone Water Ln Jarrell, TX | 3.0 | 2.5 | 1674 | $1,900 | $1.14 | 44d | 1 | 0.87mi |
| 621 Xanadu Dr Jarrell, TX | 3.0 | 2.0 | 1586 | $1,750 | $1.10 | 5d | 1 | 1.08mi |
| 241 Alcatraz Loop Jarrell, TX | 3.0 | 2.0 | 1288 | $1,895 | $1.47 | 18d | 1 | 1.17mi |
| 504 Wyatt Way Jarrell, TX | 4.0 | 2.0 | 1612 | $1,895 | $1.18 | 18d | 1 | 1.19mi |
| 508 Wyatt Way Jarrell, TX | 3.0 | 2.0 | 1500 | $1,800 | $1.20 | 44d | 1 | 1.19mi |
| 600 Shimek St Unit 19A Jarrell, TX | 3.0 | 2.0 | 1357 | $1,650 | $1.22 | 18d | 1 | 1.22mi |
| 149 Vulcan Dr Jarrell, TX | 3.0 | 2.0 | 1450 | $1,799 | $1.24 | 24d | 1 | 1.23mi |
| 117 Galaxy Way Jarrell, TX | 3.0 | 2.0 | 1276 | $1,650 | $1.29 | 21d | 1 | 1.25mi |
| 873 Circle Way Jarrell, TX | 3.0 | 2.0 | 1450 | $1,650 | $1.14 | 15d | 1 | 1.29mi |
| 137 Kellys Heroes Way Jarrell, TX | 3.0 | 2.0 | 1214 | $1,695 | $1.40 | 44d | 1 | 1.29mi |
| 1100 Jackson Ln Jarrell, TX | 4.0 | 2.5 | 1839 | $1,745 | $0.95 | 5d | 1 | 1.30mi |
| 125 Kellys Heroes Way Jarrell, TX | 3.0 | 2.0 | 1641 | $1,650 | $1.01 | 44d | 1 | 1.30mi |
| 324 Circle Way Jarrell, TX | 3.0 | 2.5 | 1661 | $1,650 | $0.99 | 11d | 1 | 1.31mi |
| 244 Circle Way Jarrell, TX | 3.0 | 2.0 | 1242 | $1,545 | $1.24 | 21d | 1 | 1.36mi |
| 637 The Ugly Way Jarrell, TX | 4.0 | 2.0 | 1688 | $1,795 | $1.06 | 44d | 1 | 1.44mi |
| 104 Perfect World Loop Jarrell, TX | 4.0 | 2.0 | 1751 | $1,885 | $1.08 | 3d | 1 | 1.47mi |
| 104 Perfect World Loop Jarrell, TX | 4.0 | 2.0 | 1751 | $1,885 | $1.08 | 5d | 1 | 1.47mi |
| 340 The Bad Way Jarrell, TX | 4.0 | 2.0 | 1616 | $1,695 | $1.05 | 44d | 1 | 1.48mi |
| 340 The Bad Way Jarrell, TX | 4.0 | 2.0 | 1616 | $1,695 | $1.05 | 24d | 1 | 1.48mi |
HOA detail
- Monthly dues
- $20 · $240/yr
- Likely covers
- water
Listing history 12 events
-
2026-06-21days on market $239,900 Active 23 DOM
-
2026-06-18days on market $239,900 Active 20 DOM
-
2026-06-17days on market $239,900 Active 19 DOM
-
2026-06-16days on market $239,900 Active 18 DOM
-
2026-06-15days on market $239,900 Active 17 DOM
-
2026-06-13days on market $239,900 Active 15 DOM
-
2026-06-09days on market $239,900 Active 11 DOM
-
2026-06-08days on market $239,900 Active 10 DOM
-
2026-06-07days on market $239,900 Active 9 DOM
-
2026-06-04days on market $239,900 Active 6 DOM
-
2026-06-03pricedays on market $239,900 Active 5 DOM
-
2026-05-31days on market $250,000 Active 4 DOM
ⓘ Source: listings_history table (triggers on properties + properties_extension) + one-shot
backfill from property_details.listing_events for pre-trigger history.
Tax reassessment forecast TX · Resets to sale price
- Current annual tax
- $5,766 · $480/mo
- Projected year-2 tax
- $5,766 · $480/mo
- Expected delta
- $0/yr ($0/mo · 0.0%)
ⓘ Screening estimate from a state-policy table — verify with the county assessor before closing.
Climate risk First Street
- Flood 1/10 Low FEMA zone X (unshaded) · 0% chance over 30 yrs
- Wildfire 3/10 Moderate
- Heat 8/10 Severe 7 d/yr ≥107°F today · 24 d/yr by 30 yrs out
- Wind 8/10 Severe 80% chance of damaging wind over 30 yrs
- Air quality 2/10 Low 1 unhealthy d/yr today · 1 by 30 yrs out
Nearby sold comps map
Loading sold comps map…
Walkable amenities ~0.75 mi
Loading nearby amenities…
Taxation est. · year 1
- Rental income
- $23,067
- − Mortgage interest
- −$13,438
- − Property taxes
- −$5,766
- − Insurance
- −$1,200
- − Repairs & maintenance
- −$1,845
- − Management
- −$1,845
- − HOA
- −$240
- − Depreciation
- −$6,979
- Taxable loss
- −$8,247
- Est. tax savings @ 24.0%
- +$1,979
- After-tax cash flow
- $-2,100/yr
For passive investors: Depreciation is non-cash, so a rental often shows a tax loss while cash-flowing — sheltering income. Rental losses are passive: they offset passive income freely, and up to $25,000/yr can offset ordinary (W-2) income if you actively participate and your MAGI is under $100k (phasing out to $0 by $150k); unused losses carry forward. On sale, claimed depreciation is recaptured at up to 25%, and gains may owe capital-gains tax (a 1031 exchange can defer both). Figures are a year-1 estimate at your 24.0% rate — not tax advice; consult a CPA.
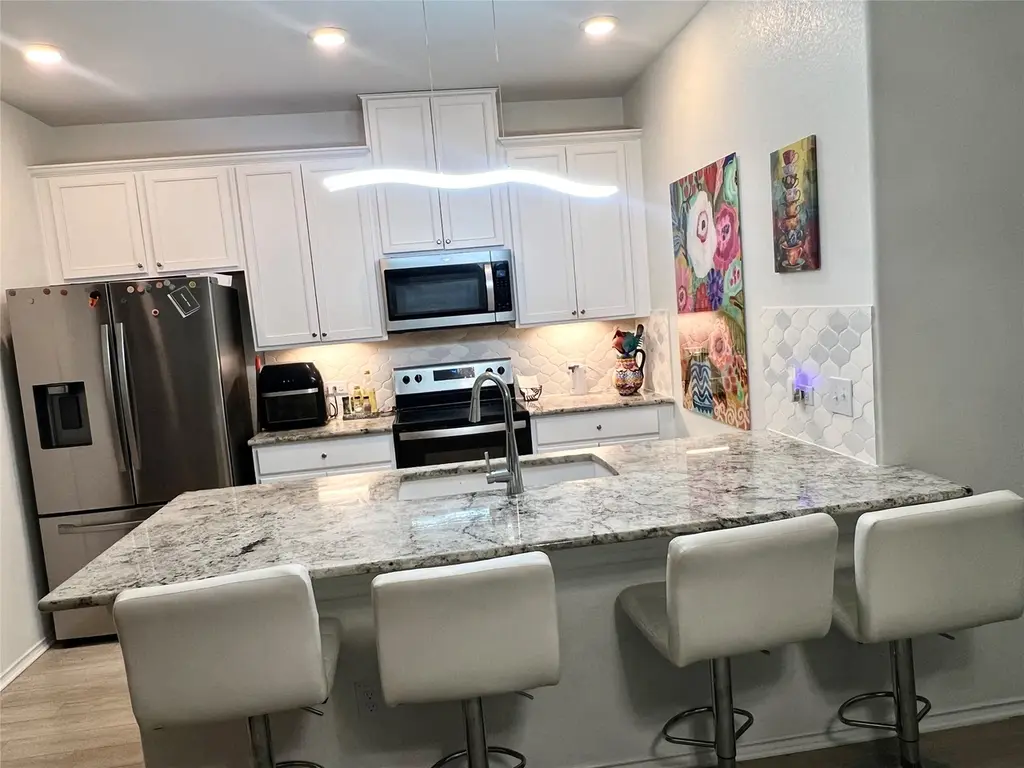
Condition & rehab AI · 1 photo
This recently updated single-family home in Sonterra, TX, offers a good condition with a modern kitchen and fresh paint. It has potential for further value increases through exterior improvements and smart home upgrades.
Value-add opportunities
- Both Painting the exterior and landscaping — Enhances curb appeal and can increase both resale and rental value.
- Both Upgrading the flooring in the bathrooms — Improves aesthetics and can increase both resale and rental value.
- Both Adding smart home features — Enhances convenience and can increase both resale and rental value.
Renovation cost estimate screening
Value-add ROI direction
- Both Painting the exterior and landscaping — Enhances curb appeal and can increase both resale and rental value. ↑
- Both Upgrading the flooring in the bathrooms — Improves aesthetics and can increase both resale and rental value. ↑
- Both Adding smart home features — Enhances convenience and can increase both resale and rental value. ↑
ⓘ Cost ranges are severity-bucket heuristics (US national rule-of-thumb). Get contractor quotes + a written scope before underwriting a rehab budget.
Schools (NCES district)
- District
- Jarrell ISD
- NCES district ID
- 4824600
- Math proficiency
- 19% ▼ -18.00%
- Reading proficiency
- 28% ▼ -5.00%
- Median HH income
- $57,132
- Composite
- 21.47/100
- National rank
- #8335
- State rank
- #713 of 826 in TX
Livability — Sonterra
No livability data for this city. (Only ~50 U.S. cities are tracked.)
Census & demographics
- County
- Williamson County · 680,029 people
- City population
- 12,526
- Metro
- Austin-Round Rock-Georgetown, TX
- Population (ZIP)
- 16,272
- Household income
- $98,199
- Rent vs Own
- Severe rent burden
- 225.0
Population outlook (Williamson County) Hauer SSP2
- Today (2025)
- 699,027 people
- By 2030
- 795,537 · +13.8%
- By 2040
- 990,683 · +41.7%
- By 2050
- 1,184,292 · +69.4%
- By 2075
- 1,623,825 · +132.3%
- By 2100
- 1,924,153 · +175.3%
Race, ethnicity, and origin ACS 2023
- Neighborhood character
- Diverse neighborhood (Simpson 0.63)
- Race & ethnicity
- White 48% Hispanic / Latino 36% Two or more races 14% Black 7% Asian 4%
- Hispanic origin (detail)
- Mexican 30% Puerto Rican 5%
- Common ancestry
- Romanian 3% Italian 2% Slovak 1%
- Foreign-born
- 13% · Canada, Vietnam
- Languages at home
- 69% English-only · Spanish 26% Chinese 2% French/Haitian/Cajun 1%
Political lean MEDSL · Williamson
- 2024 margin
- Toss-up / Even · D 48.0% · R 50.4% · Other 1.6%
- 2008→2024 swing
- +10.6pp toward D · 2008: -13.0pp · 2024: -2.5pp
- All cycles
- 2024: R+2.5 2020: D+1.4 2016: R+9.9 2012: R+21.5 2008: R+13.0
Not yet ingested
- Civics
- —
Market trends
- HPI YoY
- ▼ -31.03%
- Current HPI
- 184.8935
- Rent YoY
- ▼ -1.73%
- Metro
- Austin-Round Rock-Georgetown, TX
- State GDP YoY
- ▲ 3.95%
- F500 in state
- 110
Industry mix (Fortune 500 HQ in TX)
| Industry | F500 HQs | Revenue |
|---|---|---|
| Energy | 16 | $1,198B |
|
||
| Technology | 5 | $198B |
|
||
| Engineering / Construction | 4 | $72B |
|
||
| Energy Services | 3 | $60B |
|
||
| Utilities | 3 | $41B |
|
||
| Healthcare | 2 | $330B |
|
||
Property tax history
+8.1%/yrLatest (2026): $5,766 · -18.4% YoY. Source: county tax records.
Cash-flow waterfall
monthlySold comps — $/sqft
last 12 mo · ≤1 miLoading sold comps…