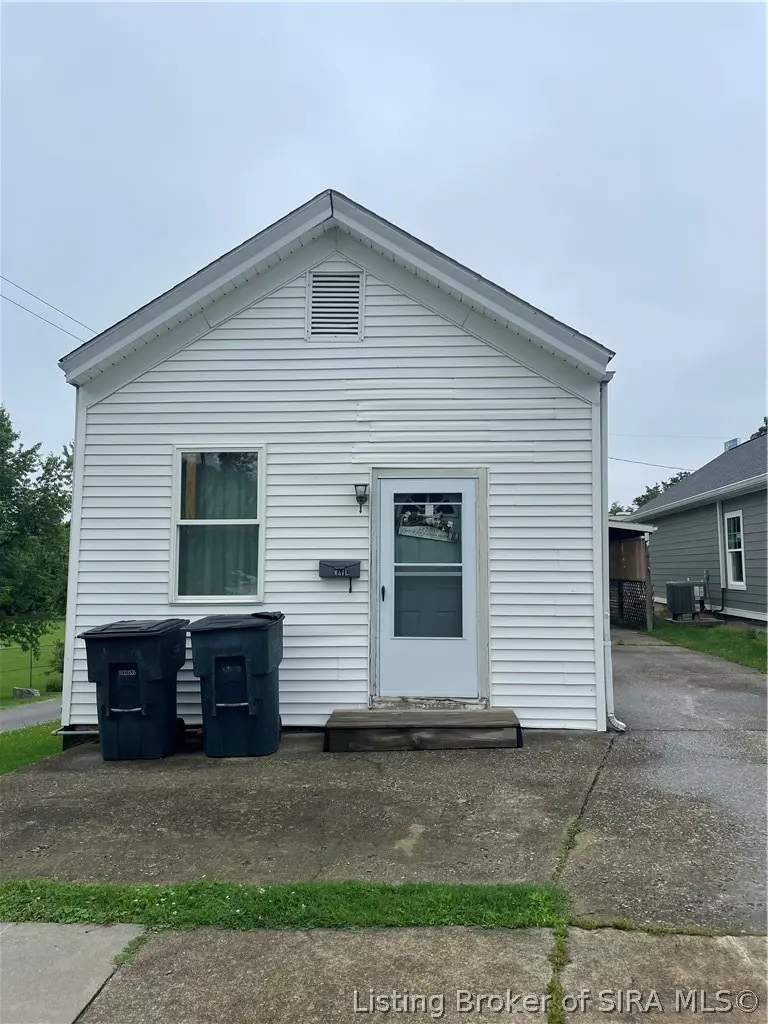
426 W Seventh St · New Albany, IN
Flood risk No data
- FEMA flood zone
- —
- Chance of flooding over 30 yrs
- —
- Est. flood insurance / yr
- —
Fire risk No data
- Est. fire insurance / yr
- —
Heat risk No data
- Hot days now (above threshold)
- —
- Hot days in 30 yrs
- —
Wind risk No data
- Chance of severe wind over 30 yrs
- —
Air-quality risk No data
- Unhealthy air days now
- —
- Unhealthy air days in 30 yrs
- —
Risk factors via First Street. Map © Google.
Why this score? — see what drove the B grade
The composite is a weighted blend of 9 inputs, each scored 0–100. Each bar is that input's sub-score; the figure is the points it added to the 100-point composite (weight × sub-score).
- Cash flow +26.7/30.0
- ARV discount +15.0/15.0
- DSCR +9.2/10.0
- 1% rule +6.1/10.0
- Rent growth +4.3/5.0
- Schools +4.2/10.0
- Livability +3.7/5.0
- Condition / age +2.5/5.0
- Appreciation +0.0/10.0
$100,000
🖨 Deal sheet 📄 Offer letter ✓ Due diligence
Key facts
- 3,049 sq ft lot
- Parking
- Built 1929
Property features AI
Exterior
- Parking: Carport
- Utilities: Public water connected; Public sewer
- Home design: Single-story home; Vinyl siding; Resale condition
- Construction: Crawlspace foundation
- Exterior features: Paved driveway; Covered porch
Interior
- Kitchen: Oven; Range; Refrigerator
- Bathrooms: 1 full bathroom
- Heating & cooling: Forced air heating
- Interior features: Unfinished crawl space basement
Neighborhood map
What this means for you Summary
Snapshot
- This is a 2-bed/1.0-bath single-family listed at $100k.
Deal economics
- At list price, monthly cash flow is $271 ($3k/yr) — positive.
- The deal already cash-flows at list — no discount required.
- Meets the 1% rule at list price ($1k rent vs $100k).
- Recommended offer: $98k (1.5% below list) — sets the bar for market timing.
- Cap rate 9.5% vs local median 3.8% in New Albany — top-decile yield for the area; either an underpriced asset or a hidden risk that comps aren't pricing in. Stress-test before assuming the spread holds.
Location & tenants
- Location reads 73/100 on livability (#100 in IN) — a middle-class / working-renter tenant base. Strengths: cost of living A+, housing A+, health & safety B; Watch: commute C-, employment D+, schools D.
- New Albany-Floyd County Consolidated Schools (suburban): math 46% / reading 50% proficiency, ranked #68 of 301 in IN (top 23%) — families likely to look elsewhere, expect single-tenant / working-renter base with shorter leases.
- Market conditions: Rents rising fast (+7.2%/yr); 269 active listings in the ZIP; 23 comparable units currently listed for rent nearby; rentals at typical pace (median 20d on market — plan ~3-4 weeks tenant-placement turnaround); 297 units permitted in Floyd County in 2024 (84 in 5+ unit buildings).
Forward outlook
- Local home prices are declining (-3.0%/yr); year-one equity from $691 of loan paydown is wiped out by about $3k of value loss. Plan a longer hold.
- Floyd County population projected at +10% by 2050 — modest demand growth; plan on rents tracking national, not racing it.
- At projected returns (-3.0% appreciation + 7.2% rent growth), your $28k cash investment doubles in ~8 years — after that, you're playing with house money.
Negotiation context
- It's been on market 27 days — a 2% lower offer ($98k) is reasonable based on typical stale-listing flexibility.
Risks & watch-outs
- Watch-outs: built in 1929 — expect roof / HVAC / electrical / plumbing capex.
Questions for the listing agent
- Built in 1929 — when were the roof, HVAC, electrical panel, plumbing, and water heater last replaced?
- Is there a deadline driving the sale (1031 exchange, divorce, estate, relocation)? That informs how much negotiation room exists.
- Schools are D-rated, which usually means shorter tenancies and higher turnover. Who's the typical renter profile here, and what's been the actual vacancy rate?
- What's the average days-on-market for RENTAL listings here right now (not sales)? A rising rental-DOM trend means longer vacancies and softer asking-rent achievability than the comps imply.
- What's the recent tenant-quality profile in this submarket — average credit score on applications, eviction rate, late-payment / NSF rate, and stable-employment percentage? A property-management company in the area should have these aggregated.
- How much new for-sale + rental construction is in the pipeline within 1–3 miles? Heavy new supply typically softens prices + rents 12–24 months out; constrained supply supports both.
Investment metrics
- 1% rule
- 1.11% ✓
- Cap rate
- 9.54%
- Cash-on-cash
- 11.60%
- DSCR
- 1.52
- GRM
- 7.5
CMA / ARV
- ARV (on-the-fly)
- $163,072
- Comps found
- 12
Show comp detail 12 sales within ~0.75 mi
| Address | Dist | Beds/Ba | Sqft | Sold | Price | $/sf | Match |
|---|---|---|---|---|---|---|---|
| 416 W 7th St | 0.03mi | 2/1.0 | 962 (+7%) | 7mo | $174,000 | $181 | 80 |
| 650 W 7th St | 0.28mi | 2/1.0 | 896 (0%) | 10mo | $153,000 | $171 | 79 |
| 229 W 9th St | 0.23mi | 2/1.0 | 962 (+7%) | 2mo | $184,900 | $192 | 75 |
| 219 W 8th St | 0.22mi | 2/1.0 | 962 (+7%) | 4mo | $184,900 | $192 | 74 |
| 722 Mosier Ave | 0.35mi | 2/1.0 | 907 (+1%) | 12mo | $167,000 | $184 | 72 |
| 729 Young St | 0.39mi | 1/1.0 (-1) | 900 (+0%) | 10mo | $59,900 | $67 | 68 |
| 729 Mosier Ave | 0.33mi | 2/1.0 | 860 (-4%) | 12mo | $159,900 | $186 | 68 |
| 247 Jackson St | 0.57mi | 2/1.0 | 826 (-8%) | 2mo | $150,000 | $182 | 59 |
| 235 W 9th St | 0.22mi | 2/1.0 | 768 (-14%) | 16mo | $126,000 | $164 | 53 |
| 1108 State St | 0.75mi | 2/1.0 | 982 (+10%) | 2mo | $52,900 | $54 | 47 |
| 1107 Griffin St | 0.69mi | 2/1.0 | 784 (-12%) | 3mo | $145,400 | $185 | 44 |
| 926 State St | 0.69mi | 2/1.0 | 1,016 (+13%) | 19mo | $91,900 | $90 | 30 |
Match score weights: distance 35% · size 25% · config 20% · recency 20%. Top-matched comps best support the ARV.
Projected returns pro-forma
-3.0% appreciation · 7.24% rent growth · sell at horizon
- IRR
- 5.2%
- Equity multiple
- 1.21×
- Total profit
- $5,913
- Equity at exit
- $14,910
- IRR
- 17.9%
- Equity multiple
- 2.76×
- Total profit
- $49,234
- Equity at exit
- $8,646
Cash invested: $28,000 (down + closing). Projections, not guarantees.
Landlord ↔ Tenant lean methodology
- Overall (STATE)
- 90 Strongly Landlord-Friendly
- State Indiana
- 90 Strongly Landlord-Friendly · R+11
- County
- — inherits STATE
- City
- — inherits STATE
ZIP-level market 47150
- Rents YoY
- 7.2%
- Active inventory
- 269
- Price-to-rent
- 7.5×
Monthly cashflow live
- Estimated rent
- $1,107 high interval (Pro) →
- Mortgage (P&I)
- −$524
- Tax from tax record
- −$38 /mo · $450/yr
- Insurance
- −$42
- HOA
- −$0
- Vacancy / Maint / Mgmt
- −$232
- Net cashflow
- $271
Break-even live
UW: 25.0% down · 7.5% · 30yr · 1.5% tax · 5.0% vac · 8.0% maint · 8.0% mgmt
Financing live
Cash to close
- Down payment
- $25,000
- Closing costs
- $3,000
- Reserves months
- —
- Total cash needed
- —
Loan-product check · same deal, 3 products live
Conventional
25% down · 7.5% · 30yr
- Down + closing
- —
- Monthly P&I
- —
- Monthly cashflow
- —
- DSCR
- —
- Eligible?
- —
Personal DTI + credit; lowest rate.
DSCR
20% down · 8.5% · 30yr
- Down + closing
- —
- Monthly P&I
- —
- Monthly cashflow
- —
- DSCR
- —
- Eligible?
- —
No personal income docs; deal must DSCR.
Hard money
10% down · 12.0% · 12mo
- Down + closing
- —
- Monthly P&I
- —
- Monthly cashflow
- —
- DSCR
- —
- Eligible?
- —
Short-term bridge; refi at stabilization.
Rent comps 23 comps
| Address | Beds | Baths | Sqft | Rent | $/sqft | DOM | Units | Dist |
|---|---|---|---|---|---|---|---|---|
| 309 E Spring St Unit 310-106 New Albany, IN | 2.0 | 2.0 | 1005 | $1,250 | $1.24 | 17d | 1 | 0.67mi |
| 309 E Spring St Unit 310-203 New Albany, IN | 2.0 | 2.5 | 1005 | $1,250 | $1.24 | 3d | 1 | 0.67mi |
| 1108 State St New Albany, IN | 2.0 | 1.0 | 982 | $1,150 | $1.17 | 21d | 1 | 0.77mi |
| 520 Culbertson Ave Unit B New Albany, IN | 3.0 | 2.0 | 1000 | $1,395 | $1.40 | 3d | 1 | 0.85mi |
| 608 E Spring St Unit 2 New Albany, IN | 2.0 | 2.0 | 1100 | $1,195 | $1.09 | 23d | 1 | 0.85mi |
| 608 E Spring St Unit 2 New Albany, IN | 2.0 | 2.0 | 1100 | $1,195 | $1.09 | 3d | 1 | 0.85mi |
| 1226 Naghel St Unit 2 New Albany, IN | 1.0 | 1.0 | 650 | $725 | $1.12 | 21d | 1 | 0.94mi |
| 1226 Naghel St Unit 2 New Albany, IN | 1.0 | 1.0 | 600 | $725 | $1.21 | 23d | 1 | 0.94mi |
| 812 Culbertson Ave New Albany, IN | 2.0 | 1.0 | 1000 | $1,095 | $1.09 | 21d | 1 | 1.02mi |
| 905 E Elm St New Albany, IN | 1.0–2.0 | 1.0 | 937 | $1,035 | $1.10 | 23d | 1 | 1.03mi |
| 901 E Oak St New Albany, IN | 3.0 | 1.0 | 1100 | $1,350 | $1.23 | 23d | 1 | 1.04mi |
| 1201 Dewey St #3 New Albany, IN | 1.0 | 1.0 | 700 | $775 | $1.11 | 17d | 1 | 1.22mi |
| 115 N 46th St Unit 2 Louisville, KY | 1.0 | 1.0 | 650 | $750 | $1.15 | 23d | 1 | 1.24mi |
| 1307 E Market St #2 New Albany, IN | 1.0 | 1.0 | 804 | $975 | $1.21 | 16d | 1 | 1.27mi |
| 1307 E Market St #1 New Albany, IN | 2.0 | 1.0 | 936 | $1,190 | $1.27 | 17d | 1 | 1.27mi |
| 112 S 46th St Louisville, KY | 3.0 | 1.0 | 902 | $1,200 | $1.33 | 23d | 1 | 1.29mi |
| 1409 Chartres St Unit 2 New Albany, IN | 1.0 | 1.0 | 700 | $750 | $1.07 | 23d | 1 | 1.30mi |
| 1409 Chartres St Unit 2 New Albany, IN | 1.0 | 1.0 | 650 | $750 | $1.15 | 14d | 1 | 1.30mi |
| 121 E 14th St Unit 2 New Albany, IN | 1.0 | 1.0 | 650 | $825 | $1.27 | 20d | 1 | 1.32mi |
| 1808 Bono Rd New Albany, IN | 1.0–2.0 | 1.0–2.0 | 1000 | $1,035 | $1.03 | 3d | 1 | 1.33mi |
| 313 N 42nd St Louisville, KY | 3.0 | 1.0 | 900 | $1,250 | $1.39 | 3d | 1 | 1.38mi |
| 3910 Garfield Ave Louisville, KY | 2.0 | 1.0 | 872 | $1,035 | $1.19 | 3d | 1 | 1.41mi |
| 3901 Jewell Ave Louisville, KY | 3.0 | 1.0 | 1069 | $1,140 | $1.07 | 20d | 1 | 1.46mi |
Listing history 14 events
-
2026-06-18days on market $100,000 Active 27 DOM
-
2026-06-17days on market $100,000 Active 26 DOM
-
2026-06-16days on market $100,000 Active 25 DOM
-
2026-06-15days on market $100,000 Active 24 DOM
-
2026-06-13pricedays on market $100,000 Active 22 DOM
-
2026-06-10days on market $125,000 Active 19 DOM
-
2026-06-09days on market $125,000 Active 18 DOM
-
2026-06-08days on market $125,000 Active 17 DOM
-
2026-06-07days on market $125,000 Active 16 DOM
-
2026-06-03days on market $125,000 Active 12 DOM
-
2026-06-02days on market $125,000 Active 11 DOM
-
2026-06-01days on market $125,000 Active 10 DOM
-
2026-05-31days on market $125,000 Active 9 DOM
-
2026-05-22$149,900 Active
ⓘ Source: listings_history table (triggers on properties + properties_extension) + one-shot
backfill from property_details.listing_events for pre-trigger history.
Tax reassessment forecast IN · Partial reset (capped growth)
- Current annual tax
- $450 · $38/mo
- Projected year-2 tax
- $650 · $54/mo
- Expected delta
- +$200/yr (+$17/mo · 44.4%)
ⓘ Screening estimate from a state-policy table — verify with the county assessor before closing.
Nearby sold comps map
Loading sold comps map…
Walkable amenities ~0.75 mi
Loading nearby amenities…
Taxation est. · year 1
- Rental income
- $13,278
- − Mortgage interest
- −$5,602
- − Property taxes
- −$450
- − Insurance
- −$500
- − Repairs & maintenance
- −$1,062
- − Management
- −$1,062
- − Depreciation
- −$2,909
- Taxable income
- $1,693
- Est. tax owed @ 24.0%
- −$406
- After-tax cash flow
- $2,840/yr
For passive investors: Depreciation is non-cash, so a rental often shows a tax loss while cash-flowing — sheltering income. Rental losses are passive: they offset passive income freely, and up to $25,000/yr can offset ordinary (W-2) income if you actively participate and your MAGI is under $100k (phasing out to $0 by $150k); unused losses carry forward. On sale, claimed depreciation is recaptured at up to 25%, and gains may owe capital-gains tax (a 1031 exchange can defer both). Figures are a year-1 estimate at your 24.0% rate — not tax advice; consult a CPA.
Schools (NCES district)
- District
- New Albany-Floyd County Consolidated Schools
- NCES district ID
- 1807410
- Math proficiency
- 46% ▼ -4.00%
- Reading proficiency
- 50% ▼ -3.00%
- Median HH income
- $54,709
- Composite
- 41.57/100
- National rank
- #3441
- State rank
- #68 of 301 in IN
Livability — New Albany
- Score
- 73/100
- State rank
- #100
- US rank
- #5454
Category grades
Schools grade is shown separately in the Schools card above.
Census & demographics
- Census place
- New Albany, IN
- County
- Floyd County · 49,144 people
- City population
- 49,144
- Metro
- Louisville/Jefferson County, KY-IN
- Population (ZIP)
- 49,144
- Household income
- $62,820
- Rent vs Own
- Severe rent burden
- 1737.0
Population outlook (Floyd County) Hauer SSP2
- Today (2025)
- 82,092 people
- By 2030
- 84,384 · +2.8%
- By 2040
- 87,919 · +7.1%
- By 2050
- 89,958 · +9.6%
- By 2075
- 94,159 · +14.7%
- By 2100
- 91,907 · +12.0%
Race, ethnicity, and origin ACS 2023
- Neighborhood character
- Predominantly White (82%)
- Race & ethnicity
- White 82% Black 8% Two or more races 6% Hispanic / Latino 5% Asian 1%
- Common ancestry
- Italian 3% Slovak 2% Lithuanian 2%
- Foreign-born
- 3% · Canada
- Languages at home
- 96% English-only · Spanish 2% Other Asian/Pacific 1%
Political lean MEDSL · Floyd
- 2024 margin
- R (+15.5) · D 41.4% · R 56.9% · Other 1.7%
- 2008→2024 swing
- -5.4pp toward R · 2008: -10.1pp · 2024: -15.5pp
- All cycles
- 2024: R+15.5 2020: R+14.1 2016: R+20.1 2012: R+14.3 2008: R+10.1
Not yet ingested
- Civics
- —
Market trends
- HPI YoY
- ▼ -185.20%
- Current HPI
- 206.7738
- Rent YoY
- ▲ 7.24%
- Metro
- Louisville/Jefferson County, KY-IN
- State GDP YoY
- ▲ 2.90%
- F500 in state
- 18
Industry mix (Fortune 500 HQ in IN)
| Industry | F500 HQs | Revenue |
|---|---|---|
| Industrial Machinery | 2 | $37B |
|
||
| Healthcare | 1 | $177B |
|
||
| Pharmaceuticals | 1 | $45B |
|
||
| Metals / Steel | 1 | $18B |
|
||
| Agriculture | 1 | $17B |
|
||
| Packaging | 1 | $12B |
|
||
Price history
1 event — show timeline
- 2026-05-22 Listed $149,900 SIRA
Property tax history
+1.2%/yrLatest (2024): $450 · -2.8% YoY. Source: county tax records.
Cash-flow waterfall
monthlySold comps — $/sqft
last 12 mo · ≤1 miLoading sold comps…