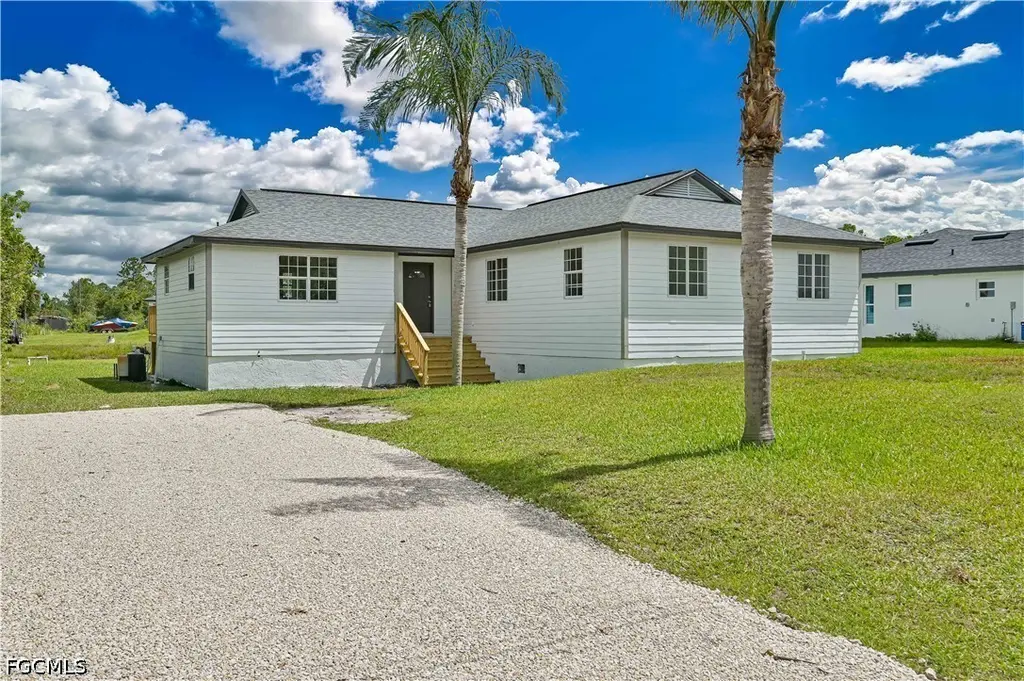
2912 28th St W · Lehigh Acres, FL
Flood risk 7/10 · Major
- FEMA flood zone
- X (unshaded)
- Chance of flooding over 30 yrs
- 0.76%
- Est. flood insurance / yr
- $507 – $1,088
Fire risk 4/10 · Minor
- Est. fire insurance / yr
- $947 – $1,759
Heat risk 9/10 · Severe
- Hot days now (above 107°F)
- 7 days/yr
- Hot days in 30 yrs
- 25 days/yr
Wind risk 10/10 · Severe
- Chance of severe wind over 30 yrs
- 99.0%
Air-quality risk 2/10 · Minimal
- Unhealthy air days now
- 1 days/yr
- Unhealthy air days in 30 yrs
- 1 days/yr
Risk factors via First Street. Map © Google.
Why this score? — see what drove the C grade
The composite is a weighted blend of 9 inputs, each scored 0–100. Each bar is that input's sub-score; the figure is the points it added to the 100-point composite (weight × sub-score).
- Cash flow +20.8/30.0
- ARV discount +15.0/15.0
- DSCR +6.6/10.0
- 1% rule +4.5/10.0
- Schools +4.1/10.0
- Livability +3.0/5.0
- Condition / age +2.5/5.0
- Rent growth +1.3/5.0
- Appreciation +0.0/10.0
$240,000
🖨 Deal sheet (PDF) 📄 Offer letter ✓ Due diligence
Listing remarks
Welcome to this Stunning renovated home In Lehigh Acres back to a canal perfect for fishing. Large renovated 4-bedroom home with an affordable price tag is rare to come up in Lehigh acres. The property has been totally renovated from top to bottom like a new home. Step inside, you'll be greeted by stunning wood plank luxury vinyl that graces the entire house with 5 inches base board gives it the modern feel. The Living room, open concept with kitchen and dining room offers great practical space for family and friends gathering and partying. This luxury kitchen carries brand new hardwood cabinets with soft closing features, beautiful quartz countertop, Huge peninsula and brand-new stainless-
Key facts
- Luxury kitchen
- Quartz countertop
- Hardwood cabinets
Tags
Property features AI
Finance
- Financial info: Pets allowed
- HOA & community: Non-gated community; No association fee reported
Exterior
- Parking: Two parking spaces
- Security: Smoke detector(s)
- Utilities: Well water; Septic tank; Cable available
- Home design: Single-story; Resale property; Entry level: 1; Faces west; Has a view; Rectangular lot; East exposure
- Construction: Built with wood frame construction; Shingle roof; Pillar/post/pier foundation
- Exterior features: Deck; Open porch; Room for a pool; Canal access waterfront
Interior
- Kitchen: Dishwasher; Microwave; Range; Refrigerator; Kitchen island; Eat-in kitchen
- Bedrooms: Bedroom located on the main level
- Flooring: Vinyl
- Bathrooms: 2 full bathrooms; Separate shower
- Heating & cooling: Central heating (electric); Central air conditioning (electric)
- Interior features: Eat-in kitchen; Kitchen island; Living/dining room; Shower only with separate shower; Walk-in closet(s); Split bedroom layout; Unfurnished; Single hung and sliding windows; Bedroom on main level
- Laundry & utility: Washer hookup inside; Dryer hookup inside
Neighborhood map
What this means for you Summary
Snapshot
- This is a 4-bed/2.0-bath single-family listed at $240k.
Deal economics
- At list price, monthly cash flow is $261 ($3k/yr) — positive.
- The deal already cash-flows at list — no discount required.
- To meet the 1% rule (rent ≥ 1% of price), the offer needs to be $229k (4.5% below list).
- Recommended offer: $229k (4.5% below list) — sets the bar for 1% rule.
- Cap rate 7.9% vs local median 4.7% in Lehigh Acres — top-decile yield for the area; either an underpriced asset or a hidden risk that comps aren't pricing in. Stress-test before assuming the spread holds.
Location & tenants
- Location reads 59/100 on livability (#826 in FL) — a working-class tenant base; expect higher turnover. Strengths: cost of living A+, housing A+; Watch: crime C-, employment D+, amenities F.
- Lee (suburban): math 47% / reading 50% proficiency, ranked #42 of 73 in FL (top 58%) — families likely to look elsewhere, expect single-tenant / working-renter base with shorter leases.
- Zoned schools: Veterans Park Academy For The Arts (math 41% / reading 45%, grade F, #1,366 of 2,144 statewide, top 64%, 2,133 students, 36% FRL); Oak Hammock Middle School (math 43% / reading 41%, grade D-, #340 of 571 statewide, top 61%, 1,563 students, 56% FRL); Lehigh Senior High School (math 23% / reading 45%, grade F, #394 of 667 statewide, top 60%, 2,476 students, 57% FRL).
- Market conditions: Rents falling (-4.7%/yr); 1347 active listings in the ZIP; 40 comparable units currently listed for rent nearby; rentals at typical pace (median 21d on market — plan ~3-4 weeks tenant-placement turnaround); solid renter incomes; 15,411 units permitted in Lee County in 2024 (4,686 in 5+ unit buildings).
- This rent runs 35% of the median local income ($78k/yr) — at the standard rent-burdened threshold; future hikes will face affordability resistance.
Forward outlook
- Local home prices are declining (-3.0%/yr); year-one equity from $2k of loan paydown is wiped out by about $7k of value loss. Plan a longer hold.
- Lee County population projected at +44% by 2050 — long-run rental-demand tailwind backs the buy-and-hold thesis.
Negotiation context
- It's been on market 19 days — a 2% lower offer ($236k) is reasonable based on typical stale-listing flexibility.
- Current owner paid $70k; list at $240k implies a 243% gain — meaningful room to come down on a strong offer.
Risks & watch-outs
- Watch-outs: flood insurance adds $66/mo.
- Climate carrying-cost: major flood risk; severe wind risk, 99% chance of damaging wind over 30y; extreme-heat days projected 7→25/yr by 2055 (HVAC capex compounding) — expect insurance premiums to compound above CPI over the hold.
Questions for the listing agent
- What's the actual annual flood-insurance premium (NFIP or private), and is the property in a SFHA with mandatory coverage?
- Is there a deadline driving the sale (1031 exchange, divorce, estate, relocation)? That informs how much negotiation room exists.
- Schools are D-rated, which usually means shorter tenancies and higher turnover. Who's the typical renter profile here, and what's been the actual vacancy rate?
- What's the average days-on-market for RENTAL listings here right now (not sales)? A rising rental-DOM trend means longer vacancies and softer asking-rent achievability than the comps imply.
- What's the recent tenant-quality profile in this submarket — average credit score on applications, eviction rate, late-payment / NSF rate, and stable-employment percentage? A property-management company in the area should have these aggregated.
- How much new for-sale + rental construction is in the pipeline within 1–3 miles? Heavy new supply typically softens prices + rents 12–24 months out; constrained supply supports both.
Investment metrics
- 1% rule
- 0.95% ✗
- Cap rate
- 7.93%
- Cash-on-cash
- 5.86%
- DSCR
- 1.26
- GRM
- 8.7
CMA / ARV
- ARV (on-the-fly)
- $389,365
- Comps found
- 12
Show comp detail 12 sales within ~0.75 mi
| Address | Dist | Beds/Ba | Sqft | Sold | Price | $/sf | Match |
|---|---|---|---|---|---|---|---|
| 2917 23rd St W | 0.28mi | 3/2.0 (-1) | 1,771 (-2%) | 14mo | $374,000 | $211 | 66 |
| 3009 32nd St W | 0.32mi | 3/2.0 (-1) | 1,799 (-1%) | 17mo | $360,000 | $200 | 65 |
| 2633 Queen Dr | 0.66mi | 4/2.0 | 1,824 (+1%) | 7mo | $275,000 | $151 | 62 |
| 2914 22nd St W | 0.30mi | 3/2.0 (-1) | 1,723 (-5%) | 16mo | $380,000 | $221 | 60 |
| 2809 Nadine Ln | 0.37mi | 3/2.0 (-1) | 1,614 (-11%) | 13mo | $324,900 | $201 | 49 |
| 2802 22nd St W | 0.36mi | 3/2.0 (-1) | 1,630 (-10%) | 15mo | $355,000 | $218 | 49 |
| 2902 23rd St W | 0.24mi | 3/2.0 (-1) | 1,630 (-10%) | 22mo | $360,000 | $221 | 49 |
| 3216 19th St W | 0.72mi | 4/2.0 | 1,857 (+2%) | 22mo | $400,000 | $215 | 44 |
| 3018 20th St W | 0.50mi | 3/2.0 (-1) | 1,701 (-6%) | 22mo | $325,000 | $191 | 43 |
| 2708 Helen Pl | 0.64mi | 3/2.0 (-1) | 1,633 (-10%) | 8mo | $330,000 | $202 | 42 |
| 3319 31st St W | 0.71mi | 3/3.0 (-1) | 1,714 (-5%) | 12mo | $398,000 | $232 | 39 |
| 3001 37th St W | 0.69mi | 3/2.0 (-1) | 1,630 (-10%) | 12mo | $355,000 | $218 | 37 |
Match score weights: distance 35% · size 25% · config 20% · recency 20%. Top-matched comps best support the ARV.
Projected returns pro-forma
-3.0% appreciation · 0.0% rent growth · sell at horizon
- IRR
- -12.3%
- Equity multiple
- 0.57×
- Total profit
- $-28,985
- Equity at exit
- $35,785
- IRR
- -8.1%
- Equity multiple
- 0.56×
- Total profit
- $-29,880
- Equity at exit
- $20,751
Cash invested: $67,200 (down + closing). Projections, not guarantees.
Landlord ↔ Tenant lean methodology
- Overall (STATE)
- 87 Strongly Landlord-Friendly
- State Florida
- 87 Strongly Landlord-Friendly · R+3
- County
- — inherits STATE
- City
- — inherits STATE
ZIP-level market 33971
- Home prices YoY
- -8.0%
- Rents YoY
- -4.7%
- Active inventory
- 1347
- Price-to-rent
- 8.7×
Monthly cashflow live
- Estimated rent
- $2,291 high interval (Pro) →
- Mortgage (P&I)
- −$1,259
- Tax from tax record
- −$123 /mo · $1,481/yr
- Insurance
- −$100
- Flood insurance flood zone
- −$66 /mo · $798/yr
- HOA
- −$0
- Vacancy / Maint / Mgmt
- −$481
- Net cashflow
- $261
Break-even live
Sensitivity live
| Price | -10% $397 | -5% $329 | +0% $261 | +5% $194 | +10% $126 |
|---|---|---|---|---|---|
| Rent | -10% $80 | -5% $171 | +0% $261 | +5% $352 | +10% $442 |
| Rate | -1.0pp $382 | -0.5pp $322 | base $261 | +0.5pp $199 | +1.0pp $136 |
UW: 25.0% down · 7.5% · 30yr · 1.5% tax · 5.0% vac · 8.0% maint · 8.0% mgmt
Financing live
Cash to close
- Down payment
- $60,000
- Closing costs
- $7,200
- Reserves months
- —
- Total cash needed
- —
Loan-product check · same deal, 3 products live
Conventional
25% down · 7.5% · 30yr
- Down + closing
- —
- Monthly P&I
- —
- Monthly cashflow
- —
- DSCR
- —
- Eligible?
- —
Personal DTI + credit; lowest rate.
DSCR
20% down · 8.5% · 30yr
- Down + closing
- —
- Monthly P&I
- —
- Monthly cashflow
- —
- DSCR
- —
- Eligible?
- —
No personal income docs; deal must DSCR.
Hard money
10% down · 12.0% · 12mo
- Down + closing
- —
- Monthly P&I
- —
- Monthly cashflow
- —
- DSCR
- —
- Eligible?
- —
Short-term bridge; refi at stabilization.
Rent comps 40 comps
| Address | Beds | Baths | Sqft | Rent | $/sqft | DOM | Units | Dist |
|---|---|---|---|---|---|---|---|---|
| 2815 24th St W Lehigh Acres, FL | 4.0 | 2.0 | 1820 | $1,875 | $1.03 | 4d | 1 | 0.22mi |
| 3005 31st St W Lehigh Acres, FL | 3.0 | 2.0 | 1600 | $1,950 | $1.22 | 4d | 1 | 0.27mi |
| 2805 24th St W Lehigh Acres, FL | 3.0 | 3.0 | 1980 | $2,200 | $1.11 | 25d | 1 | 0.27mi |
| 2917 22nd St W Lehigh Acres, FL | 4.0 | 2.0 | 1550 | $2,150 | $1.39 | 25d | 1 | 0.30mi |
| 3175 Sunshine Blvd Lehigh Acres, FL | 3.0 | 2.0 | 1633 | $2,100 | $1.29 | 4d | 1 | 0.38mi |
| 3208 31st St W Lehigh Acres, FL | 3.0 | 2.0 | 1501 | $2,100 | $1.40 | 25d | 1 | 0.45mi |
| 3315 Sunshine Blvd N Lehigh Acres, FL | 3.0 | 2.0 | 1630 | $2,000 | $1.23 | 4d | 1 | 0.50mi |
| 2608 25th St W Lehigh Acres, FL | 3.0 | 2.0 | 1633 | $2,300 | $1.41 | 25d | 1 | 0.50mi |
| 3405 Hanna Ave N Lehigh Acres, FL | 4.0 | 3.0 | 1698 | $2,200 | $1.30 | 25d | 1 | 0.58mi |
| 2809 Darlene Pl Lehigh Acres, FL | 3.0 | 2.0 | 1600 | $2,000 | $1.25 | 25d | 1 | 0.60mi |
| 2712 18th St W Lehigh Acres, FL | 4.0 | 3.0 | 2030 | $2,730 | $1.34 | 4d | 1 | 0.61mi |
| 2611 20th St W Lehigh Acres, FL | 3.0 | 2.0 | 2126 | $2,556 | $1.20 | 12d | 1 | 0.65mi |
| 2918 16th St Lehigh Acres, FL | 3.0 | 2.0 | 1324 | $1,845 | $1.39 | 22d | 1 | 0.67mi |
| 2615 19th St W Lehigh Acres, FL | 3.0 | 2.0 | 1698 | $2,000 | $1.18 | 25d | 1 | 0.67mi |
| 3203 18th St W Lehigh Acres, FL | 3.0 | 2.5 | 1710 | $2,250 | $1.32 | 25d | 1 | 0.69mi |
| 2513 22nd St W Lehigh Acres, FL | 4.0 | 2.0 | 1389 | $1,750 | $1.26 | 22d | 1 | 0.70mi |
| 2513 22nd St W Lehigh Acres, FL | 4.0 | 2.0 | 1389 | $1,750 | $1.26 | 16d | 1 | 0.70mi |
| 2611 Carol Pl Lehigh Acres, FL | 3.0 | 2.0 | 1406 | $1,895 | $1.35 | 12d | 1 | 0.72mi |
| 2614 Carol Pl Lehigh Acres, FL | 3.0 | 2.0 | 1595 | $1,695 | $1.06 | 17d | 1 | 0.73mi |
| 2820 14th St W Lehigh Acres, FL | 3.0 | 2.0 | 2007 | $2,791 | $1.39 | 4d | 1 | 0.81mi |
| 2522 Alice Pl Lehigh Acres, FL | 3.0 | 2.0 | 1630 | $2,300 | $1.41 | 4d | 1 | 0.81mi |
| 2913 14th St W Lehigh Acres, FL | 3.0 | 2.0 | 1629 | $2,400 | $1.47 | 3d | 1 | 0.84mi |
| 2913 14th St W Lehigh Acres, FL | 4.0 | 2.0 | 1629 | $2,300 | $1.41 | 25d | 1 | 0.84mi |
| 3202 37th St W Lehigh Acres, FL | 3.0 | 2.5 | 1412 | $1,705 | $1.21 | 15d | 1 | 0.85mi |
| 3313 35th St W Lehigh Acres, FL | 3.0 | 2.0 | 1458 | $1,950 | $1.34 | 25d | 1 | 0.87mi |
| 3310 35th St W Lehigh Acres, FL | 4.0 | 2.0 | 2133 | $1,745 | $0.82 | 25d | 1 | 0.88mi |
| 3005 40th St W Lehigh Acres, FL | 3.0 | 2.0 | 1272 | $2,000 | $1.57 | 4d | 1 | 0.90mi |
| 3417 31st St W Lehigh Acres, FL | 3.0 | 2.0 | 1779 | $3,500 | $1.97 | 25d | 1 | 0.95mi |
| 3005 41st St W Lehigh Acres, FL | 3.0 | 2.0 | 1853 | $2,250 | $1.21 | 25d | 1 | 0.96mi |
| 2610 40th St W Lehigh Acres, FL | 3.0 | 2.0 | 1472 | $2,000 | $1.36 | 25d | 1 | 1.01mi |
| 2719 42nd St W Lehigh Acres, FL | 3.0 | 2.0 | 1637 | $2,000 | $1.22 | 16d | 1 | 1.04mi |
| 3310 11th St W Lehigh Acres, FL | 3.0 | 2.5 | 1354 | $2,000 | $1.48 | 4d | 1 | 1.12mi |
| 3109 10th St W Lehigh Acres, FL | 3.0 | 2.0 | 1472 | $1,950 | $1.32 | 25d | 1 | 1.13mi |
| 3312 11th St W Lehigh Acres, FL | 3.0 | 2.5 | 1354 | $2,000 | $1.48 | 4d | 1 | 1.13mi |
| 2808 44th St W Lehigh Acres, FL | 4.0 | 2.0 | 1800 | $1,745 | $0.97 | 25d | 1 | 1.18mi |
| 3208 9th St W Lehigh Acres, FL | 3.0 | 2.0 | 1423 | $1,916 | $1.35 | 4d | 1 | 1.18mi |
| 3309 10th St W Lehigh Acres, FL | 4.0 | 2.0 | 1575 | $2,199 | $1.40 | 12d | 1 | 1.20mi |
| 1711 W 12th St Lehigh Acres, FL | 3.0 | 2.0 | 1400 | $1,999 | $1.43 | 20d | 1 | 1.21mi |
| 1711 W 12th St Lehigh Acres, FL | 3.0 | 2.0 | 1400 | $1,999 | $1.43 | 21d | 1 | 1.21mi |
| 1923 Sunniland Blvd Lehigh Acres, FL | 3.0 | 2.5 | 1638 | $2,200 | $1.34 | 25d | 1 | 1.22mi |
Listing history 11 events
-
2026-06-16statusdays on market $240,000 Pending 19 DOM
-
2026-06-15days on market $240,000 Active 18 DOM
-
2026-06-13days on market $240,000 Active 16 DOM
-
2026-06-10days on market $240,000 Active 13 DOM
-
2026-06-09days on market $240,000 Active 12 DOM
-
2026-06-08days on market $240,000 Active 11 DOM
-
2026-06-07days on market $240,000 Active 10 DOM
-
2026-06-03days on market $240,000 Active 6 DOM
-
2026-06-02days on market $240,000 Active 5 DOM
-
2026-06-01days on market $240,000 Active 4 DOM
-
2026-05-31days on market $240,000 Active 3 DOM
ⓘ Source: listings_history table (triggers on properties + properties_extension) + one-shot
backfill from property_details.listing_events for pre-trigger history.
Tax reassessment forecast FL · Resets to sale price
- Current annual tax
- $1,481 · $123/mo
- Projected year-2 tax
- $1,992 · $166/mo
- Expected delta
- +$511/yr (+$43/mo · 34.5%)
ⓘ Screening estimate from a state-policy table — verify with the county assessor before closing.
Climate risk First Street
- Flood 7/10 Severe FEMA zone X (unshaded) · 76% chance over 30 yrs
- Wildfire 4/10 Moderate
- Heat 9/10 Extreme 7 d/yr ≥107°F today · 25 d/yr by 30 yrs out
- Wind 10/10 Extreme 99% chance of damaging wind over 30 yrs
- Air quality 2/10 Low 1 unhealthy d/yr today · 1 by 30 yrs out
Nearby sold comps map
Loading sold comps map…
Walkable amenities ~0.75 mi
Loading nearby amenities…
Taxation est. · year 1
- Rental income
- $27,493
- − Mortgage interest
- −$13,444
- − Property taxes
- −$1,481
- − Insurance
- −$1,997
- − Repairs & maintenance
- −$2,199
- − Management
- −$2,199
- − Depreciation
- −$6,982
- Taxable loss
- −$810
- Est. tax savings @ 24.0%
- +$194
- After-tax cash flow
- $3,332/yr
For passive investors: Depreciation is non-cash, so a rental often shows a tax loss while cash-flowing — sheltering income. Rental losses are passive: they offset passive income freely, and up to $25,000/yr can offset ordinary (W-2) income if you actively participate and your MAGI is under $100k (phasing out to $0 by $150k); unused losses carry forward. On sale, claimed depreciation is recaptured at up to 25%, and gains may owe capital-gains tax (a 1031 exchange can defer both). Figures are a year-1 estimate at your 24.0% rate — not tax advice; consult a CPA.
Schools (NCES district)
- District
- Lee
- NCES district ID
- 1201080
- Math proficiency
- 47% ▼ -11.00%
- Reading proficiency
- 50% ▼ -4.00%
- Median HH income
- $49,518
- Composite
- 41.49/100
- National rank
- #3458
- State rank
- #42 of 73 in FL
Livability — Lehigh Acres
- Score
- 59/100
- State rank
- #826
- US rank
- #20055
Category grades
Schools grade is shown separately in the Schools card above.
Census & demographics
- Census place
- Lehigh Acres, FL
- County
- Lee County · 788,662 people
- City population
- 130,638
- Metro
- Cape Coral-Fort Myers, FL
- Population (ZIP)
- 30,790
- Household income
- $77,723
- Rent vs Own
- Severe rent burden
- 587.0
Population outlook (Lee County) Hauer SSP2
- Today (2025)
- 871,946 people
- By 2030
- 955,468 · +9.6%
- By 2040
- 1,113,587 · +27.7%
- By 2050
- 1,256,891 · +44.1%
- By 2075
- 1,560,270 · +78.9%
- By 2100
- 1,726,848 · +98.0%
Race, ethnicity, and origin ACS 2023
- Neighborhood character
- Diverse neighborhood (Simpson 0.65)
- Race & ethnicity
- Hispanic / Latino 49% Two or more races 32% White 26% Black 19% Asian 2%
- Hispanic origin (detail)
- Mexican 9% Puerto Rican 13% Cuban 14% Dominican 2%
- Common ancestry
- Hispanic 7% Estonian 1% Romanian 1%
- Foreign-born
- 31% · Canada, Vietnam, Guatemala
- Languages at home
- 46% English-only · Spanish 41% French/Haitian/Cajun 9% Other Indo-European 2%
Political lean MEDSL · Lee
- 2024 margin
- Strong R (+28.4) · D 35.5% · R 63.9%
- 2008→2024 swing
- -18.0pp toward R · 2008: -10.4pp · 2024: -28.4pp
- All cycles
- 2024: R+28.4 2020: R+19.2 2016: R+20.4 2012: R+16.6 2008: R+10.4
Not yet ingested
- Civics
- —
Market trends
- HPI YoY
- ▼ -27.68%
- Current HPI
- 317.7147
- Rent YoY
- ▼ -4.69%
- Metro
- Cape Coral-Fort Myers, FL
- State GDP YoY
- ▲ 3.28%
- F500 in state
- 36
Industry mix (Fortune 500 HQ in FL)
| Industry | F500 HQs | Revenue |
|---|---|---|
| Industrial Technology | 2 | $29B |
|
||
| Insurance | 2 | $17B |
|
||
| Retail | 1 | $60B |
|
||
| Technology Distribution | 1 | $58B |
|
||
| Homebuilding | 1 | $35B |
|
||
| Technology Manufacturing | 1 | $35B |
|
||
Price history
+269.2% since first listed3 events — show timeline
- 2026-05-27 Listed $240,000 FORTMLS
- 2026-02-16 Sold (Public Records) $70,000 Public Records
- 2013-07-31 Sold (Public Records) $65,000 Public Records
Property tax history
+0.7%/yrLatest (2025): $1,481 · +3.0% YoY. Source: county tax records.
Cash-flow waterfall
monthlySold comps — $/sqft
last 12 mo · ≤1 miLoading sold comps…