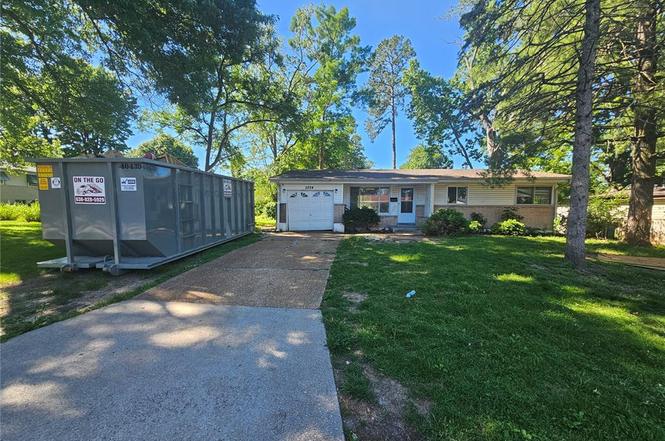
2254 Gadbury Dr · Ferguson, MO
Flood risk 1/10 · Minimal
- FEMA flood zone
- X (unshaded)
- Chance of flooding over 30 yrs
- 0.0%
- Est. flood insurance / yr
- $473 – $860
Fire risk 1/10 · Minimal
- Est. fire insurance / yr
- $1,054 – $1,958
Heat risk 5/10 · Moderate
- Hot days now (above 107°F)
- 7 days/yr
- Hot days in 30 yrs
- 21 days/yr
Wind risk 2/10 · Minimal
- Chance of severe wind over 30 yrs
- 1.0%
Air-quality risk 3/10 · Minor
- Unhealthy air days now
- 3 days/yr
- Unhealthy air days in 30 yrs
- 5 days/yr
Risk factors via First Street. Map © Google.
Why this score? — see what drove the B- grade
The composite is a weighted blend of 9 inputs, each scored 0–100. Each bar is that input's sub-score; the figure is the points it added to the 100-point composite (weight × sub-score).
- Cash flow +23.0/30.0
- ARV discount +13.6/15.0
- DSCR +7.4/10.0
- Appreciation +6.9/10.0
- 1% rule +5.9/10.0
- Rent growth +3.7/5.0
- Livability +2.9/5.0
- Condition / age +2.5/5.0
- Schools +1.7/10.0
$129,900
🖨 Deal sheet 📄 Offer letter ✓ Due diligence
Listing remarks MLS
Please submit all offers on Special Sales contract. No interior viewings without an accepted contract. Total rent is $855 + $40 for sewer Section 8 tenant. Lease expires 9/30/2019
Key facts
- Covered front porch
- Ceramic tile kitchen
- Hardwood floors
Tags
Property features AI
Finance
- Financial info: Lease not considered
- HOA & community: Has HOA; annual fee of $75 (paid annually); Association: City and Village Tax Office
Exterior
- Parking: Attached 1-car garage
- Utilities: Public water; Public sewer; Electric: Other
- Home design: Single family residence; House, one level
- Construction: Frame construction; Composition roof
- Exterior features: Level lot; Paved road access
Interior
- Bedrooms: 3 bedrooms (all on the main level)
- Flooring: Hardwood
- Bathrooms: 2 full bathrooms (main level)
- Heating & cooling: Central air; Other heating type
- Interior features: Hardwood flooring; Partially finished full basement
Neighborhood map
What this means for you Summary
Snapshot
- This is a 3-bed/2.0-bath single-family listed at $130k.
Deal economics
- At list price, monthly cash flow is $231 ($3k/yr) — positive.
- The deal already cash-flows at list — no discount required.
- Meets the 1% rule at list price ($1k rent vs $130k).
Location & tenants
- Location reads 58/100 on livability (#586 in MO) — a working-class tenant base; expect higher turnover. Strengths: cost of living A+, housing B+; Watch: health & safety C-, crime F, amenities F.
- Hazelwood (suburban): math 11% / reading 26% proficiency, ranked #306 of 324 in MO (top 94%) — low school quality limits family demand, transient renter base, plan for 1-2y turnover.
- Zoned schools: Keeven Elem. (math 2% / reading 17%, grade F, #1,037 of 1,115 statewide, top 94%, 267 students, 99% FRL); Hazelwood East High (math 5% / reading 21%, grade F, #495 of 521 statewide, top 95%, 1,264 students, 66% FRL) — zoned schools average 82% FRL vs 53% district-wide (29 pts higher); higher-poverty schools than district average — tighter screening recommended.
- Market conditions: Rents rising fast (+5.0%/yr); 372 active listings in the ZIP; 39 comparable units currently listed for rent nearby; rentals at typical pace (median 24d on market — plan ~3-4 weeks tenant-placement turnaround); lower-income renter base — watch delinquency; 920 units permitted in St. Louis County in 2024 (250 in 5+ unit buildings).
- This rent runs 41% of the median local income ($41k/yr) — at the standard rent-burdened threshold; future hikes will face affordability resistance.
Forward outlook
- In year one you build about $6k of equity ($898 loan paydown + $5k appreciation (3.8% local appreciation)).
- At projected returns (3.8% appreciation + 5.0% rent growth), your $36k cash investment doubles in ~4 years — after that, you're playing with house money.
- By year 6, paydown + projected appreciation supports a ~$31k cash-out refi (75% LTV) — recoverable capital for the next deal without selling this one.
Negotiation context
- Only 1 days on market — expect competitive offers; lowballing is unlikely to land.
- 3 sale attempts since 15y ago with the ask held roughly flat each time — persistent listings suggest the price (not the market) is what's stuck; bring a comps-based counter.
- Current owner paid $61k; list at $130k implies a 112% gain — meaningful room to come down on a strong offer.
Risks & watch-outs
- Watch-outs: built in 1958 — expect roof / HVAC / electrical / plumbing capex.
- Climate carrying-cost: extreme-heat days projected 7→21/yr by 2055 (HVAC capex compounding) — expect insurance premiums to compound above CPI over the hold.
Questions for the listing agent
- Built in 1958 — when were the roof, HVAC, electrical panel, plumbing, and water heater last replaced?
- What does the HOA fee cover, when was the last increase, and are there any pending special assessments or reserve-fund shortfalls?
- Is there a deadline driving the sale (1031 exchange, divorce, estate, relocation)? That informs how much negotiation room exists.
- Schools are F-rated, which usually means shorter tenancies and higher turnover. Who's the typical renter profile here, and what's been the actual vacancy rate?
- Crime grade is F in this area — have there been break-ins, vandalism, or insurance claims at this property in the last 3 years? What carrier currently insures it and at what premium?
- What's the average days-on-market for RENTAL listings here right now (not sales)? A rising rental-DOM trend means longer vacancies and softer asking-rent achievability than the comps imply.
- What's the recent tenant-quality profile in this submarket — average credit score on applications, eviction rate, late-payment / NSF rate, and stable-employment percentage? A property-management company in the area should have these aggregated.
- How much new for-sale + rental construction is in the pipeline within 1–3 miles? Heavy new supply typically softens prices + rents 12–24 months out; constrained supply supports both.
Investment metrics
- 1% rule
- 1.09% ✓
- Cap rate
- 8.43%
- Cash-on-cash
- 7.63%
- DSCR
- 1.34
- GRM
- 7.7
CMA / ARV
- ARV (on-the-fly)
- $150,336
- Comps found
- 12
Show comp detail 12 sales within ~0.75 mi
| Address | Dist | Beds/Ba | Sqft | Sold | Price | $/sf | Match |
|---|---|---|---|---|---|---|---|
| 2252 Luxmore Dr | 0.05mi | 3/1.5 | 986 (-6%) | 6mo | $59,000 | $60 | 82 |
| 10539 Monarch Dr | 0.43mi | 4/2.5 (+1) | 1,073 (+3%) | 3mo | $135,000 | $126 | 66 |
| 10421 Canfield Dr | 0.53mi | 3/1.5 | 1,073 (+3%) | 5mo | $154,900 | $144 | 65 |
| 11100 Landseer Dr | 0.48mi | 3/2.0 | 1,116 (+7%) | 6mo | $187,000 | $168 | 61 |
| 1923 Nashua Dr | 0.69mi | 3/1.0 | 1,014 (-3%) | 1mo | $149,900 | $148 | 58 |
| 10257 Dacey Dr | 0.74mi | 3/1.5 | 1,014 (-3%) | 2mo | $120,000 | $118 | 57 |
| 2515 Linnell Dr | 0.72mi | 2/2.0 (-1) | 1,082 (+4%) | 1mo | $109,900 | $102 | 54 |
| 10269 Dacey Dr | 0.73mi | 4/1.0 (+1) | 1,014 (-3%) | 1mo | $169,000 | $167 | 52 |
| 10615 Trask Dr | 0.70mi | 3/2.0 | 950 (-9%) | 5mo | $160,000 | $168 | 48 |
| 10501 Baron Dr | 0.58mi | 3/1.0 | 888 (-15%) | 2mo | $99,000 | $111 | 42 |
| 10719 Trask Dr | 0.68mi | 3/1.0 | 900 (-14%) | 3mo | $143,500 | $159 | 39 |
| 10512 Count Dr | 0.62mi | 3/1.0 | 888 (-15%) | 4mo | $105,000 | $118 | 39 |
Match score weights: distance 35% · size 25% · config 20% · recency 20%. Top-matched comps best support the ARV.
Projected returns pro-forma
3.79% appreciation · 4.97% rent growth · sell at horizon
- IRR
- 17.7%
- Equity multiple
- 2.07×
- Total profit
- $38,752
- Equity at exit
- $64,273
- IRR
- 19.5%
- Equity multiple
- 4.17×
- Total profit
- $115,281
- Equity at exit
- $103,876
Cash invested: $36,372 (down + closing). Projections, not guarantees.
Landlord ↔ Tenant lean methodology
- Overall (STATE)
- 81 Strongly Landlord-Friendly
- State Missouri
- 81 Strongly Landlord-Friendly · R+10
- County
- — inherits STATE
- City
- — inherits STATE
ZIP-level market 63136
- Home prices YoY
- 0.9%
- Rents YoY
- 5.0%
- Active inventory
- 372
- Price-to-rent
- 7.7×
Monthly cashflow live
- Estimated rent
- $1,412 high interval (Pro) →
- Mortgage (P&I)
- −$681
- Tax from tax record
- −$143 /mo · $1,719/yr
- Insurance
- −$54
- HOA
- −$6
- Vacancy / Maint / Mgmt
- −$297
- Net cashflow
- $231
Break-even live
UW: 25.0% down · 7.5% · 30yr · 1.5% tax · 5.0% vac · 8.0% maint · 8.0% mgmt
Financing live
Cash to close
- Down payment
- $32,475
- Closing costs
- $3,897
- Reserves months
- —
- Total cash needed
- —
Loan-product check · same deal, 3 products live
Conventional
25% down · 7.5% · 30yr
- Down + closing
- —
- Monthly P&I
- —
- Monthly cashflow
- —
- DSCR
- —
- Eligible?
- —
Personal DTI + credit; lowest rate.
DSCR
20% down · 8.5% · 30yr
- Down + closing
- —
- Monthly P&I
- —
- Monthly cashflow
- —
- DSCR
- —
- Eligible?
- —
No personal income docs; deal must DSCR.
Hard money
10% down · 12.0% · 12mo
- Down + closing
- —
- Monthly P&I
- —
- Monthly cashflow
- —
- DSCR
- —
- Eligible?
- —
Short-term bridge; refi at stabilization.
Rent comps 39 comps
| Address | Beds | Baths | Sqft | Rent | $/sqft | DOM | Units | Dist |
|---|---|---|---|---|---|---|---|---|
| 2257 Luxmore Dr Saint Louis, MO | 3.0 | 3.0 | 1073 | $1,495 | $1.39 | 23d | 1 | 0.09mi |
| 2259 Ainsworth Dr Saint Louis, MO | 4.0 | 2.0 | 1500 | $1,776 | $1.18 | 43d | 1 | 0.13mi |
| 2544 Netherton Dr Saint Louis, MO | 3.0 | 2.0 | 1288 | $1,945 | $1.51 | 1d | 1 | 0.46mi |
| 10504 Baron Dr Saint Louis, MO | 3.0 | 1.0 | 1000 | $1,300 | $1.30 | 7d | 1 | 0.59mi |
| 13061 Lord Dr St. Louis, MO | 2.0 | 1.0 | 900 | $1,040 | $1.16 | 21d | 1 | 0.59mi |
| 2745 Rottingdean Dr St. Louis, MO | 1.0–2.0 | 1.0 | 825 | $975 | $1.18 | 43d | 1 | 0.62mi |
| 10512 Count Dr Saint Louis, MO | 3.0 | 1.0 | 888 | $1,195 | $1.35 | 14d | 1 | 0.62mi |
| 62 Capitol Hill Dr Saint Louis, MO | 3.0 | 2.0 | 1239 | $1,250 | $1.01 | 43d | 1 | 0.64mi |
| 10409 Count Dr Saint Louis, MO | 3.0 | 1.0 | 912 | $1,100 | $1.21 | 21d | 1 | 0.71mi |
| 10322 Monarch Dr Saint Louis, MO | 3.0 | 2.0 | 1073 | $1,728 | $1.61 | 23d | 1 | 0.75mi |
| 10501 Duke Dr Saint Louis, MO | 2.0 | 1.0 | 1140 | $1,090 | $0.96 | 43d | 1 | 0.76mi |
| 10365 Lord Dr Saint Louis, MO | 3.0 | 1.0 | 864 | $1,075 | $1.24 | 2d | 1 | 0.78mi |
| 10239 Green Valley Dr Saint Louis, MO | 3.0 | 1.0 | 1014 | $1,395 | $1.38 | 23d | 1 | 0.81mi |
| 10404 Earl Dr Saint Louis, MO | 2.0 | 1.0 | 770 | $1,100 | $1.43 | 4d | 1 | 0.81mi |
| 10557 Castle Dr Saint Louis, MO | 3.0 | 2.0 | 1023 | $1,300 | $1.27 | 14d | 1 | 0.85mi |
| 10441 Prince Dr Saint Louis, MO | 4.0 | 1.5 | 1380 | $1,380 | $1.00 | 43d | 1 | 0.88mi |
| 10421 Prince Dr Saint Louis, MO | 3.0 | 2.0 | 1023 | $1,275 | $1.25 | 23d | 1 | 0.91mi |
| 10304 Bon Oak Dr Saint Louis, MO | 3.0 | 1.5 | 1500 | $1,250 | $0.83 | 43d | 1 | 0.96mi |
| 10129 Cavalier Ct Saint Louis, MO | 3.0 | 1.5 | 912 | $1,250 | $1.37 | 23d | 1 | 0.96mi |
| 10128 Cloverdale Dr Saint Louis, MO | 2.0 | 1.0 | 792 | $1,000 | $1.26 | 23d | 1 | 1.00mi |
| 10128 Cloverdale Dr Saint Louis, MO | 2.0 | 1.0 | 792 | $1,000 | $1.26 | 43d | 1 | 1.00mi |
| 10124 Winkler Dr Saint Louis, MO | 2.0 | 1.0 | 792 | $1,400 | $1.77 | 3d | 1 | 1.05mi |
| 10113 Count Dr Saint Louis, MO | 2.0 | 1.0 | 882 | $775 | $0.88 | 43d | 1 | 1.07mi |
| 10112 Count Dr Saint Louis, MO | 2.0 | 1.0 | 792 | $1,000 | $1.26 | 7d | 1 | 1.08mi |
| 11470 Latonka Trl Florissant, MO | 1.0–2.0 | 1.0 | 843 | $1,050 | $1.25 | 43d | 3 | 1.09mi |
| 10078 Green Valley Dr Saint Louis, MO | 3.0 | 1.0 | 900 | $1,325 | $1.47 | 7d | 1 | 1.11mi |
| 10139 Royal Dr Saint Louis, MO | 2.0 | 1.0 | 1016 | $900 | $0.89 | 43d | 1 | 1.15mi |
| 10113 Duke Dr Saint Louis, MO | 3.0 | 1.0 | 770 | $1,325 | $1.72 | 43d | 1 | 1.16mi |
| 11321 Amboy Ln Saint Louis, MO | 3.0 | 3.0 | 1182 | $1,756 | $1.49 | 1d | 1 | 1.21mi |
| 11635 Hazeloak Dr Black Jack, MO | 3.0 | 2.0 | 1124 | $1,728 | $1.54 | 17d | 1 | 1.24mi |
| 2257 Chambers Rd Saint Louis, MO | 3.0 | 1.0 | 1200 | $1,400 | $1.17 | 23d | 1 | 1.25mi |
| 1547 Babcock Dr Saint Louis, MO | 3.0 | 1.0 | 1014 | $1,480 | $1.46 | 43d | 1 | 1.25mi |
| 2326 Chambers Rd Saint Louis, MO | 2.0 | 1.0 | 1056 | $1,050 | $0.99 | 23d | 1 | 1.27mi |
| 10329 Chesley Dr Saint Louis, MO | 3.0 | 1.0 | 1014 | $1,350 | $1.33 | 23d | 1 | 1.28mi |
| 1926 Chambers Rd Saint Louis, MO | 4.0 | 1.0 | 1095 | $995 | $0.91 | 14d | 1 | 1.35mi |
| 1654 Mowbry Ln Saint Louis, MO | 3.0 | 1.0 | 936 | $1,300 | $1.39 | 23d | 1 | 1.36mi |
| 1520 Attica Dr Saint Louis, MO | 2.0 | 1.0 | 1062 | $1,200 | $1.13 | 23d | 1 | 1.38mi |
| 2321 Noll Dr Saint Louis, MO | 3.0 | 1.0 | 975 | $1,320 | $1.35 | 23d | 1 | 1.39mi |
| 4872 Bristol Rock Rd Black Jack, MO | 4.0 | 2.0 | 1448 | $2,061 | $1.42 | 2d | 1 | 1.41mi |
HOA detail
- Monthly dues
- $6 · $72/yr
- Likely covers
- sewer
Listing history 2 events
-
2026-06-17remarks 699-char remark
-
2026-06-17$129,900 Active 1 DOM
ⓘ Source: listings_history table (triggers on properties + properties_extension) + one-shot
backfill from property_details.listing_events for pre-trigger history.
Tax reassessment forecast MO · Resets to sale price
- Current annual tax
- $1,719 · $143/mo
- Projected year-2 tax
- $1,719 · $143/mo
- Expected delta
- $0/yr ($0/mo · 0.0%)
ⓘ Screening estimate from a state-policy table — verify with the county assessor before closing.
Climate risk First Street
- Flood 1/10 Low FEMA zone X (unshaded) · 0% chance over 30 yrs
- Wildfire 1/10 Low
- Heat 5/10 Major 7 d/yr ≥107°F today · 21 d/yr by 30 yrs out
- Wind 2/10 Low 100% chance of damaging wind over 30 yrs
- Air quality 3/10 Moderate 3 unhealthy d/yr today · 5 by 30 yrs out
Nearby sold comps map
Loading sold comps map…
Walkable amenities ~0.75 mi
Loading nearby amenities…
Taxation est. · year 1
- Rental income
- $16,948
- − Mortgage interest
- −$7,276
- − Property taxes
- −$1,719
- − Insurance
- −$650
- − Repairs & maintenance
- −$1,356
- − Management
- −$1,356
- − HOA
- −$72
- − Depreciation
- −$3,779
- Taxable income
- $741
- Est. tax owed @ 24.0%
- −$178
- After-tax cash flow
- $2,596/yr
For passive investors: Depreciation is non-cash, so a rental often shows a tax loss while cash-flowing — sheltering income. Rental losses are passive: they offset passive income freely, and up to $25,000/yr can offset ordinary (W-2) income if you actively participate and your MAGI is under $100k (phasing out to $0 by $150k); unused losses carry forward. On sale, claimed depreciation is recaptured at up to 25%, and gains may owe capital-gains tax (a 1031 exchange can defer both). Figures are a year-1 estimate at your 24.0% rate — not tax advice; consult a CPA.
Schools (NCES district)
- District
- Hazelwood
- NCES district ID
- 2913830
- Math proficiency
- 11% ▼ -13.00%
- Reading proficiency
- 26% ▼ -6.00%
- Median HH income
- $51,621
- Composite
- 16.77/100
- National rank
- #9156
- State rank
- #306 of 324 in MO
Livability — Ferguson
- Score
- 58/100
- State rank
- #586
- US rank
- #20809
Category grades
Schools grade is shown separately in the Schools card above.
Census & demographics
- County
- Saint Louis County · 888,823 people
- Metro
- St. Louis, MO-IL
- Population (ZIP)
- 40,929
- Household income
- $41,154
- Rent vs Own
- Severe rent burden
- 3085.0
Population outlook (St. Louis County) Hauer SSP2
- Today (2025)
- 1,025,227 people
- By 2030
- 1,028,023 · +0.3%
- By 2040
- 1,020,940 · -0.4%
- By 2050
- 1,007,280 · -1.8%
- By 2075
- 987,277 · -3.7%
- By 2100
- 921,984 · -10.1%
Race, ethnicity, and origin ACS 2023
- Neighborhood character
- Predominantly Black (90%)
- Race & ethnicity
- Black 90% White 5% Two or more races 3%
- Foreign-born
- 1% · Canada
Political lean MEDSL · St. Louis
- 2024 margin
- Strong D (+23.4) · D 60.8% · R 37.4% · Other 1.7%
- 2008→2024 swing
- +3.5pp toward D · 2008: 19.9pp · 2024: 23.4pp
- All cycles
- 2024: D+23.4 2020: D+24.0 2016: D+16.2 2012: D+13.7 2008: D+19.9
Not yet ingested
- Civics
- —
Market trends
- HPI YoY
- ▲ 3.79%
- Current HPI
- 420.28
- Rent YoY
- ▲ 4.97%
- Metro
- St. Louis, MO-IL
- State GDP YoY
- ▲ 1.84%
- F500 in state
- 20
Industry mix (Fortune 500 HQ in MO)
| Industry | F500 HQs | Revenue |
|---|---|---|
| Healthcare | 1 | $163B |
|
||
| Insurance | 1 | $21B |
|
||
| Industrial Technology | 1 | $17B |
|
||
| Retail | 1 | $16B |
|
||
| Industrial Distribution | 1 | $10B |
|
||
| Utilities | 1 | $9B |
|
||
Price history
+39.7% since first listed11 events — show timeline
- 2026-06-17 Listed $129,900 MARIS as Distributed by MLS Grid
- 2019-07-08 Sold (Public Records) $61,250 Public Records
- 2019-07-01 Sold (MLS) — MARIS as Distributed by MLS Grid
- 2019-06-11 Pending — MARIS as Distributed by MLS Grid
- 2019-03-21 Listed $72,900 MARIS as Distributed by MLS Grid
- 2017-04-26 Sold (Public Records) $310,945 Public Records
- 2012-01-19 Sold (MLS) — MARIS as Distributed by MLS Grid
- 2011-12-22 Listed $14,900 MARIS as Distributed by MLS Grid
- 2007-05-16 Sold (Public Records) $105,000 Public Records
- 2004-06-04 Sold (Public Records) $93,000 Public Records
- 1979-11-01 Sold (Public Records) — Public Records
Property tax history
+7.0%/yrLatest (2022): $1,719 · +5.6% YoY. Source: county tax records.
Cash-flow waterfall
monthlySold comps — $/sqft
last 12 mo · ≤1 miLoading sold comps…