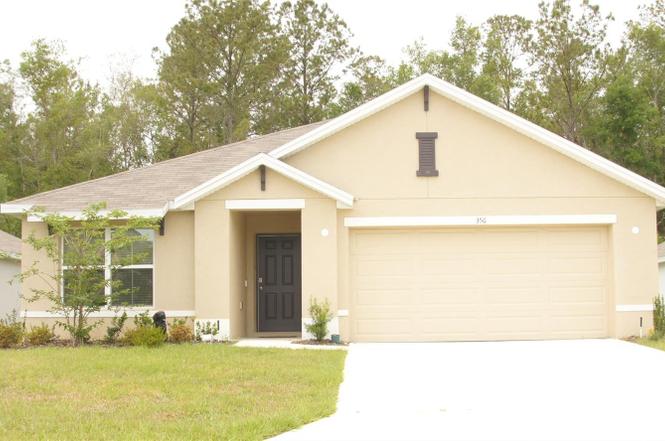
356 SE 66th Ct · Silver Springs, FL
Flood risk No data
- FEMA flood zone
- —
- Chance of flooding over 30 yrs
- —
- Est. flood insurance / yr
- —
Fire risk No data
- Est. fire insurance / yr
- —
Heat risk No data
- Hot days now (above threshold)
- —
- Hot days in 30 yrs
- —
Wind risk No data
- Chance of severe wind over 30 yrs
- —
Air-quality risk No data
- Unhealthy air days now
- —
- Unhealthy air days in 30 yrs
- —
Risk factors via First Street. Map © Google.
Why this score? — see what drove the D+ grade
The composite is a weighted blend of 9 inputs, each scored 0–100. Each bar is that input's sub-score; the figure is the points it added to the 100-point composite (weight × sub-score).
- ARV discount +13.4/15.0
- Cash flow +9.3/30.0
- Appreciation +8.0/10.0
- Schools +3.6/10.0
- DSCR +2.6/10.0
- Rent growth +2.5/5.0
- Livability +2.5/5.0
- Condition / age +2.5/5.0
- 1% rule +2.1/10.0
$259,999
🖨 Deal sheet (PDF) 📄 Offer letter ✓ Due diligence
Listing remarks
One or more photo(s) has been virtually staged. Back on Market - No Fault of the Home! NEWLY BUILT HOME IN DESIRABLE DEER PATH NORTH PHASE 2. Indulge in modern living with this 3-bedroom, all concrete block constructed home featuring an open layout and stainless appliances. The open design connects the living, dining, and kitchen areas, creating a spacious and inviting atmosphere. The primary bedroom features an ensuite bathroom, walk-in closet and luxury vinyl flooring. There is plenty of storage with several well placed storage closets throughout the home. This home comes complete with Pre-Wired smart home package (buyer responsible for activation). New vinyl fencing was installed along t
Key facts
- Walk-in closet
- Stainless appliances
- Open layout
Tags
Neighborhood map
What this means for you Summary
Snapshot
- This is a 3-bed/2.0-bath single-family listed at $260k.
Deal economics
- At list price, monthly cash flow is $-189 ($-2k/yr) — negative.
- To cash-flow at today's rent, offer at most $227k (12.8% below list).
- To meet the 1% rule (rent ≥ 1% of price), the offer needs to be $186k (28.6% below list).
- Recommended offer: $186k (28.6% below list) — sets the bar for 1% rule.
Location & tenants
- Location reads: area grade D — affects rentability + tenant quality, not the cash-flow math above.
- Marion (rural): math 42% / reading 43% proficiency, ranked #61 of 73 in FL (top 84%) — families likely to look elsewhere, expect single-tenant / working-renter base with shorter leases; 61% free/reduced lunch — lower-income household profile, screen leases tightly.
- Zoned schools: Ward-Highlands Elementary School (math 60% / reading 55%, grade C+, #764 of 2,144 statewide, top 36%, 959 students, 59% FRL); Fort King Middle School (math 37% / reading 35%, grade F, #410 of 571 statewide, top 72%, 1,092 students, 71% FRL); Forest High School (math 36% / reading 54%, grade D-, #228 of 667 statewide, top 35%, 2,325 students, 42% FRL) — zoned schools at 57% FRL track the district average.
- Market conditions: Rents flat; 683 active listings in the ZIP; 12 comparable units currently listed for rent nearby; rentals at typical pace (median 23d on market — plan ~3-4 weeks tenant-placement turnaround); 7,071 units permitted in Marion County in 2024 (534 in 5+ unit buildings).
- This rent runs 35% of the median local income ($64k/yr) — at the standard rent-burdened threshold; future hikes will face affordability resistance.
Forward outlook
- In year one you build about $17k of equity ($2k loan paydown + $15k appreciation (5.9% local appreciation)).
- Marion County population projected at +13% by 2050 — modest demand growth; plan on rents tracking national, not racing it.
- By year 3, paydown + projected appreciation supports a ~$43k cash-out refi (75% LTV) — recoverable capital for the next deal without selling this one.
Negotiation context
- It's been on market 336 days — a 12% lower offer ($229k) is reasonable based on typical stale-listing flexibility.
- 2 sale attempts; this cycle's ask has dropped $39k (13%) from the opening price — seller is motivated, your offer sets the floor, not the list.
Questions for the listing agent
- What do current leases actually rent for vs. the listed asking? Can we see a recent rent roll and the last 12 months of T-12 income?
- It's been on market 336 days. Have you received any prior offers? Is the seller open to a 29% concession, seller financing, or rate buy-down credit?
- What does the HOA fee cover, when was the last increase, and are there any pending special assessments or reserve-fund shortfalls?
- Why hasn't it sold? Are there any deal-killer items the seller is aware of (foundation, flood, title, zoning, code violations)?
- Is there a deadline driving the sale (1031 exchange, divorce, estate, relocation)? That informs how much negotiation room exists.
- The area grade is low — what's the realistic commute time and amenity access for the typical tenant pool here? Any planned neighborhood developments (good or bad) we should know about?
- What's the average days-on-market for RENTAL listings here right now (not sales)? A rising rental-DOM trend means longer vacancies and softer asking-rent achievability than the comps imply.
- What's the recent tenant-quality profile in this submarket — average credit score on applications, eviction rate, late-payment / NSF rate, and stable-employment percentage? A property-management company in the area should have these aggregated.
- How much new for-sale + rental construction is in the pipeline within 1–3 miles? Heavy new supply typically softens prices + rents 12–24 months out; constrained supply supports both.
Investment metrics
- 1% rule
- 0.71% ✗
- Cap rate
- 5.42%
- Cash-on-cash
- -3.11%
- DSCR
- 0.86
- GRM
- 11.7
CMA / ARV
- ARV (on-the-fly)
- $298,930
- Comps found
- 6
Show comp detail 6 sales within ~0.75 mi
| Address | Dist | Beds/Ba | Sqft | Sold | Price | $/sf | Match |
|---|---|---|---|---|---|---|---|
| 415 SE 61st Ct | 0.38mi | 3/2.0 | 1,684 (+1%) | 18mo | $349,900 | $208 | 66 |
| 907 SE 65th Cir | 0.33mi | 3/2.0 | 1,543 (-8%) | 16mo | $305,000 | $198 | 59 |
| 6551 SE 1st Loop | 0.20mi | 4/2.0 (+1) | 1,828 (+10%) | 20mo | $319,935 | $175 | 53 |
| 6605 SE 1st Loop | 0.15mi | 4/2.0 (+1) | 1,828 (+10%) | 23mo | $310,935 | $170 | 53 |
| 1371 SE 65th Cir | 0.56mi | 3/2.0 | 1,763 (+6%) | 19mo | $315,000 | $179 | 49 |
| 5715 SE 4th Pl | 0.72mi | 3/2.0 | 1,833 (+10%) | 9mo | $240,000 | $131 | 43 |
Match score weights: distance 35% · size 25% · config 20% · recency 20%. Top-matched comps best support the ARV.
Projected returns pro-forma
5.93% appreciation · 0.17% rent growth · sell at horizon
- IRR
- 11.7%
- Equity multiple
- 1.78×
- Total profit
- $56,799
- Equity at exit
- $162,339
- IRR
- 11.8%
- Equity multiple
- 3.30×
- Total profit
- $167,350
- Equity at exit
- $293,443
Cash invested: $72,800 (down + closing). Projections, not guarantees.
Landlord ↔ Tenant lean methodology
- Overall (STATE)
- 87 Strongly Landlord-Friendly
- State Florida
- 87 Strongly Landlord-Friendly · R+3
- County
- — inherits STATE
- City
- — inherits STATE
ZIP-level market 34472
- Home prices YoY
- 2.4%
- Rents YoY
- 0.2%
- Active inventory
- 683
- Price-to-rent
- 11.7×
Monthly cashflow live
- Estimated rent
- $1,857 high interval (Pro) →
- Mortgage (P&I)
- −$1,363
- Tax from tax record
- −$144 /mo · $1,731/yr
- Insurance
- −$108
- HOA
- −$40
- Vacancy / Maint / Mgmt
- −$390
- Net cashflow
- $-189
Break-even live
Sensitivity live
| Price | -10% $-42 | -5% $-115 | +0% $-189 | +5% $-262 | +10% $-336 |
|---|---|---|---|---|---|
| Rent | -10% $-336 | -5% $-262 | +0% $-189 | +5% $-115 | +10% $-42 |
| Rate | -1.0pp $-58 | -0.5pp $-123 | base $-189 | +0.5pp $-256 | +1.0pp $-325 |
UW: 25.0% down · 7.5% · 30yr · 1.5% tax · 5.0% vac · 8.0% maint · 8.0% mgmt
Financing live
Cash to close
- Down payment
- $65,000
- Closing costs
- $7,800
- Reserves months
- —
- Total cash needed
- —
Loan-product check · same deal, 3 products live
Conventional
25% down · 7.5% · 30yr
- Down + closing
- —
- Monthly P&I
- —
- Monthly cashflow
- —
- DSCR
- —
- Eligible?
- —
Personal DTI + credit; lowest rate.
DSCR
20% down · 8.5% · 30yr
- Down + closing
- —
- Monthly P&I
- —
- Monthly cashflow
- —
- DSCR
- —
- Eligible?
- —
No personal income docs; deal must DSCR.
Hard money
10% down · 12.0% · 12mo
- Down + closing
- —
- Monthly P&I
- —
- Monthly cashflow
- —
- DSCR
- —
- Eligible?
- —
Short-term bridge; refi at stabilization.
Rent comps 12 comps
| Address | Beds | Baths | Sqft | Rent | $/sqft | DOM | Units | Dist |
|---|---|---|---|---|---|---|---|---|
| 100 SE 68th Ct Ocala, FL | 3.0 | 2.0 | 1612 | $1,850 | $1.15 | 23d | 1 | 0.27mi |
| 6772 NE 1st St Unit Na Ocala, FL | 3.0 | 2.0 | 1300 | $1,500 | $1.15 | 15d | 1 | 0.28mi |
| 15 NE 63rd Ct Ocala, FL | 3.0 | 2.0 | 1500 | $1,700 | $1.13 | 23d | 1 | 0.31mi |
| 6859 NE 1st Pl Ocala, FL | 3.0 | 2.0 | 1250 | $1,400 | $1.12 | 23d | 1 | 0.40mi |
| 6001 SE 4th Pl Ocala, FL | 3.0 | 2.0 | 1865 | $2,295 | $1.23 | 15d | 1 | 0.50mi |
| 436 NE 61st Ter Ocala, FL | 3.0 | 2.0 | 2170 | $2,600 | $1.20 | 23d | 1 | 0.66mi |
| 5725 SE 3rd Pl Ocala, FL | 3.0 | 2.0 | 1608 | $1,550 | $0.96 | 23d | 1 | 0.68mi |
| 1503 Peachtree Ln Ocala, FL | 2.0 | 2.0 | 1152 | $1,450 | $1.26 | 23d | 1 | 0.72mi |
| 5610 NE 7th St Ocala, FL | 3.0 | 2.0 | 1900 | $1,800 | $0.95 | 15d | 1 | 1.08mi |
| 113 Teak Rd Ocala, FL | 3.0 | 3.0 | 2086 | $2,150 | $1.03 | 15d | 1 | 1.10mi |
| 6688 Cherry Rd Ocala, FL | 3.0 | 2.0 | 1270 | $1,950 | $1.54 | 15d | 1 | 1.13mi |
| 9 Teak Way Dr Ocala, FL | 3.0 | 2.0 | 1352 | $1,800 | $1.33 | 15d | 1 | 1.30mi |
HOA detail
- Monthly dues
- $40 · $480/yr
Listing history 7 events
-
2026-04-21status Pending
-
2025-12-30status Active
-
2025-12-17status Pending
-
2025-12-14price $259,999
-
2025-09-05price $272,500
-
2025-06-28price $284,995
-
2025-05-07$298,999 Active
ⓘ Source: listings_history table (triggers on properties + properties_extension) + one-shot
backfill from property_details.listing_events for pre-trigger history.
Tax reassessment forecast FL · Resets to sale price
- Current annual tax
- $1,731 · $144/mo
- Projected year-2 tax
- $2,158 · $180/mo
- Expected delta
- +$427/yr (+$36/mo · 24.7%)
ⓘ Screening estimate from a state-policy table — verify with the county assessor before closing.
Nearby sold comps map
Loading sold comps map…
Walkable amenities ~0.75 mi
Loading nearby amenities…
Taxation est. · year 1
- Rental income
- $22,287
- − Mortgage interest
- −$14,564
- − Property taxes
- −$1,731
- − Insurance
- −$1,300
- − Repairs & maintenance
- −$1,783
- − Management
- −$1,783
- − HOA
- −$480
- − Depreciation
- −$7,564
- Taxable loss
- −$6,918
- Est. tax savings @ 24.0%
- +$1,660
- After-tax cash flow
- $-606/yr
For passive investors: Depreciation is non-cash, so a rental often shows a tax loss while cash-flowing — sheltering income. Rental losses are passive: they offset passive income freely, and up to $25,000/yr can offset ordinary (W-2) income if you actively participate and your MAGI is under $100k (phasing out to $0 by $150k); unused losses carry forward. On sale, claimed depreciation is recaptured at up to 25%, and gains may owe capital-gains tax (a 1031 exchange can defer both). Figures are a year-1 estimate at your 24.0% rate — not tax advice; consult a CPA.
Schools (NCES district)
- District
- Marion
- NCES district ID
- 1201260
- Math proficiency
- 42% ▼ -7.00%
- Reading proficiency
- 43% ▼ -4.00%
- Median HH income
- $40,015
- Composite
- 35.61/100
- National rank
- #4890
- State rank
- #61 of 73 in FL
Livability — Silver Springs
No livability data for this city. (Only ~50 U.S. cities are tracked.)
Census & demographics
- County
- Marion County · 315,796 people
- Metro
- Ocala, FL
- Population (ZIP)
- 35,851
- Household income
- $64,208
- Rent vs Own
- Severe rent burden
- 655.0
Population outlook (Marion County) Hauer SSP2
- Today (2025)
- 365,905 people
- By 2030
- 376,768 · +3.0%
- By 2040
- 396,555 · +8.4%
- By 2050
- 412,723 · +12.8%
- By 2075
- 446,090 · +21.9%
- By 2100
- 436,193 · +19.2%
Race, ethnicity, and origin ACS 2023
- Neighborhood character
- Diverse neighborhood (Simpson 0.65)
- Race & ethnicity
- White 50% Hispanic / Latino 25% Black 21% Two or more races 18% Asian 2%
- Hispanic origin (detail)
- Mexican 2% Puerto Rican 14% Cuban 3%
- Common ancestry
- Romanian 2% Iranian 1% Lithuanian 1%
- Foreign-born
- 11% · Canada, Jamaica, China
- Languages at home
- 78% English-only · Spanish 19% Other Indo-European 1%
Political lean MEDSL · Marion
- 2024 margin
- Solid R (+31.6) · D 33.8% · R 65.5%
- 2008→2024 swing
- -20.0pp toward R · 2008: -11.6pp · 2024: -31.6pp
- All cycles
- 2024: R+31.6 2020: R+25.9 2016: R+26.2 2012: R+16.2 2008: R+11.6
Not yet ingested
- Civics
- —
Market trends
- HPI YoY
- ▲ 5.93%
- Current HPI
- 255.0714
- Rent YoY
- ▲ 0.17%
- Metro
- Ocala, FL
- State GDP YoY
- ▲ 3.28%
- F500 in state
- 36
Industry mix (Fortune 500 HQ in FL)
| Industry | F500 HQs | Revenue |
|---|---|---|
| Industrial Technology | 2 | $29B |
|
||
| Insurance | 2 | $17B |
|
||
| Retail | 1 | $60B |
|
||
| Technology Distribution | 1 | $58B |
|
||
| Homebuilding | 1 | $35B |
|
||
| Technology Manufacturing | 1 | $35B |
|
||
Price history
-13.0% since first listed7 events — show timeline
- 2026-04-21 Pending — Stellar MLS as Distributed by MLS Grid
- 2025-12-30 Relisted — Stellar MLS as Distributed by MLS Grid
- 2025-12-17 Pending — Stellar MLS as Distributed by MLS Grid
- 2025-12-14 Price Changed $259,999 Stellar MLS as Distributed by MLS Grid
- 2025-09-05 Price Changed $272,500 Stellar MLS as Distributed by MLS Grid
- 2025-06-28 Price Changed $284,995 Stellar MLS as Distributed by MLS Grid
- 2025-05-07 Listed $298,999 Stellar MLS as Distributed by MLS Grid
Property tax history
+48.5%/yrLatest (2025): $1,731 · +83.0% YoY. Source: county tax records.
Cash-flow waterfall
monthlySold comps — $/sqft
last 12 mo · ≤1 miLoading sold comps…