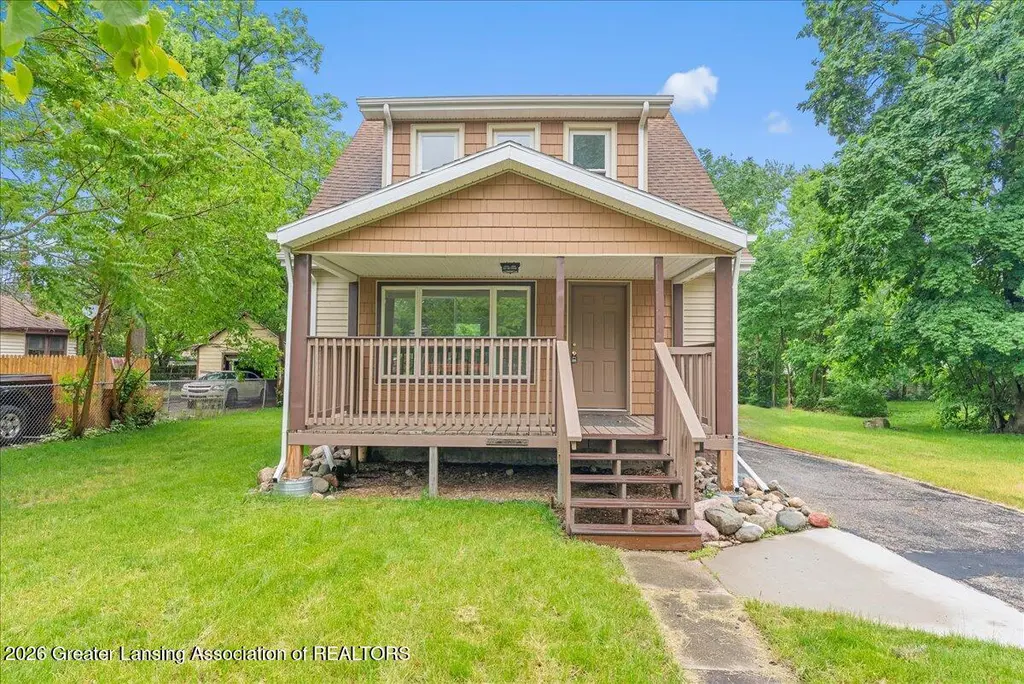
1115 Regent St · Lansing, MI
Flood risk 1/10 · Minimal
- FEMA flood zone
- X (unshaded)
- Chance of flooding over 30 yrs
- 0.0%
- Est. flood insurance / yr
- $473 – $860
Fire risk 1/10 · Minimal
- Est. fire insurance / yr
- $784 – $1,456
Heat risk 2/10 · Minimal
- Hot days now (above 96°F)
- 7 days/yr
- Hot days in 30 yrs
- 15 days/yr
Wind risk 2/10 · Minimal
- Chance of severe wind over 30 yrs
- —
Air-quality risk 2/10 · Minimal
- Unhealthy air days now
- 1 days/yr
- Unhealthy air days in 30 yrs
- 2 days/yr
Risk factors via First Street. Map © Google.
Why this score? — see what drove the B+ grade
The composite is a weighted blend of 9 inputs, each scored 0–100. Each bar is that input's sub-score; the figure is the points it added to the 100-point composite (weight × sub-score).
- Cash flow +30.0/30.0
- ARV discount +15.0/15.0
- 1% rule +10.0/10.0
- DSCR +10.0/10.0
- Rent growth +4.3/5.0
- Livability +4.0/5.0
- Condition / age +2.5/5.0
- Schools +1.9/10.0
- Appreciation +0.0/10.0
$73,000
🖨 Deal sheet (PDF) 📄 Offer letter ✓ Due diligence
Listing remarks MLS
Great investment opportunity with major updates already completed! This four bed, 1.5 bath property features new windows, all-new plumbing throughout, updated electrical, a professionally installed roof (2024), a new furnace (2024), central air conditioning, and a new on-demand water heater. The sale includes a substantial collection of materials ready for installation, including three sinks, three toilets, two vanities, stone countertops for the kitchen and bathrooms, five original antique doors, additional plumbing and electrical supplies, and other building materials. The exterior has been beautifully updated with vinyl siding, new soffits, and fascia. The basement is already plumbed for an additional bathroom, offering even more potential for expansion and value. Property sold AS IS
Key facts
- Updated electrical
- New furnace
- All new plumbing
Tags
Property features AI
Finance
- Financial info: Current use listed as Investment
Exterior
- Parking: Detached garage (2 garage spaces)
- Utilities: 100 Amp electric service; Public sewer; Water, sewer, natural gas and electricity connected
- Home design: Colonial-style home; Two levels; Built in 1919; City street frontage
- Construction: Vinyl siding; Block foundation; Shingle roof
- Exterior features: Private yard; Front porch
Interior
- Kitchen: Kitchen (approx. 10 x 9)
- Bedrooms: 4 bedrooms (Primary bedroom listed separately)
- Flooring: Wood flooring
- Bathrooms: 1 full bath; 1 half bath
- Heating & cooling: Forced air heat (natural gas); Central air conditioning
- Interior features: Tankless water heater; Daylight, block basement with bath stubbed
- Laundry & utility: Laundry located in basement
Neighborhood map
What this means for you Summary
Snapshot
- This is a 4-bed/1.0-bath single-family listed at $73k.
Deal economics
- At list price, monthly cash flow is $715 ($9k/yr) — positive.
- The deal already cash-flows at list — no discount required.
- Meets the 1% rule at list price ($2k rent vs $73k).
- Cap rate 18.0% vs local median 6.0% in Lansing — top-decile yield for the area; either an underpriced asset or a hidden risk that comps aren't pricing in. Stress-test before assuming the spread holds.
Location & tenants
- Location reads 79/100 on livability (#94 in MI, #2,182 nationally) — a middle-class / working-renter tenant base. Strengths: amenities A+, commute A+, cost of living A+; Watch: employment D, crime F.
- Lansing Public School District (urban): math 14% / reading 23% proficiency, ranked #650 of 760 in MI (top 86%) — low school quality limits family demand, transient renter base, plan for 1-2y turnover; 68% free/reduced lunch — lower-income household profile, screen leases tightly.
- Zoned schools: Pattengill School (600 students, 88% FRL) — zoned schools average 88% FRL vs 68% district-wide (21 pts higher); higher-poverty schools than district average — tighter screening recommended.
- Market conditions: Rents rising fast (+7.0%/yr); 100 active listings in the ZIP; 8 comparable units currently listed for rent nearby; rentals at typical pace (median 23d on market — plan ~3-4 weeks tenant-placement turnaround); 350 units permitted in Ingham County in 2024 (186 in 5+ unit buildings).
- This rent runs 34% of the median local income ($54k/yr) — at the standard rent-burdened threshold; future hikes will face affordability resistance.
Forward outlook
- Local home prices are declining (-3.0%/yr); year-one equity from $505 of loan paydown is wiped out by about $2k of value loss. Plan a longer hold.
- Ingham County population projected at +11% by 2050 — modest demand growth; plan on rents tracking national, not racing it.
- At projected returns (-3.0% appreciation + 7.0% rent growth), your $20k cash investment doubles in ~3 years — after that, you're playing with house money.
Negotiation context
- Only 4 days on market — expect competitive offers; lowballing is unlikely to land.
- 4 sale attempts with the ask held roughly flat each time — persistent listings suggest the price (not the market) is what's stuck; bring a comps-based counter.
- Current owner paid $62k; 19% above their basis — modest negotiation headroom, anchor on the comps not their cost.
Risks & watch-outs
- Watch-outs: built in 1919 — expect roof / HVAC / electrical / plumbing capex.
Questions for the listing agent
- Built in 1919 — when were the roof, HVAC, electrical panel, plumbing, and water heater last replaced?
- Is there a deadline driving the sale (1031 exchange, divorce, estate, relocation)? That informs how much negotiation room exists.
- Schools are F-rated, which usually means shorter tenancies and higher turnover. Who's the typical renter profile here, and what's been the actual vacancy rate?
- Crime grade is F in this area — have there been break-ins, vandalism, or insurance claims at this property in the last 3 years? What carrier currently insures it and at what premium?
- What's the average days-on-market for RENTAL listings here right now (not sales)? A rising rental-DOM trend means longer vacancies and softer asking-rent achievability than the comps imply.
- What's the recent tenant-quality profile in this submarket — average credit score on applications, eviction rate, late-payment / NSF rate, and stable-employment percentage? A property-management company in the area should have these aggregated.
- How much new for-sale + rental construction is in the pipeline within 1–3 miles? Heavy new supply typically softens prices + rents 12–24 months out; constrained supply supports both.
Investment metrics
- 1% rule
- 2.11% ✓
- Cap rate
- 18.05%
- Cash-on-cash
- 41.99%
- DSCR
- 2.87
- GRM
- 3.9
CMA / ARV
- ARV (on-the-fly)
- $118,272
- Comps found
- 12
Show comp detail 12 sales within ~0.75 mi
| Address | Dist | Beds/Ba | Sqft | Sold | Price | $/sf | Match |
|---|---|---|---|---|---|---|---|
| 1115 Regent St | 0.00mi | 4/2.0 | 1,232 (0%) | 8mo | $61,500 | $50 | 90 |
| 637 S Clemens Ave | 0.30mi | 3/1.0 (-1) | 1,340 (+9%) | 3mo | $37,000 | $28 | 64 |
| 1240 Climax St | 0.54mi | 3/1.0 (-1) | 1,144 (-7%) | 0mo | $109,900 | $96 | 58 |
| 301 Allen St | 0.65mi | 3/1.0 (-1) | 1,248 (+1%) | 8mo | $87,000 | $70 | 56 |
| 218 S Hayford Ave | 0.71mi | 4/1.0 | 1,136 (-8%) | 6mo | $142,000 | $125 | 49 |
| 239 S Magnolia Ave | 0.66mi | 3/1.0 (-1) | 1,144 (-7%) | 4mo | $129,900 | $114 | 48 |
| 412 S Fairview Ave | 0.53mi | 4/2.0 | 1,408 (+14%) | 0mo | $115,000 | $82 | 47 |
| 424 S Clemens | 0.49mi | 3/1.0 (-1) | 1,056 (-14%) | 4mo | $96,000 | $91 | 45 |
| 613 Clifford St | 0.46mi | 3/1.0 (-1) | 1,403 (+14%) | 7mo | $127,805 | $91 | 44 |
| 1024 E Malcolm X St | 0.70mi | 3/1.0 (-1) | 1,104 (-10%) | 3mo | $145,000 | $131 | 43 |
| 1620 Clifton Ave | 0.73mi | 3/2.0 (-1) | 1,342 (+9%) | 6mo | $205,000 | $153 | 37 |
| 1201 Climax St | 0.63mi | 3/2.0 (-1) | 1,408 (+14%) | 2mo | $157,000 | $112 | 36 |
Match score weights: distance 35% · size 25% · config 20% · recency 20%. Top-matched comps best support the ARV.
Projected returns pro-forma
-3.0% appreciation · 7.02% rent growth · sell at horizon
- IRR
- 43.2%
- Equity multiple
- 2.97×
- Total profit
- $40,242
- Equity at exit
- $10,885
- IRR
- 51.0%
- Equity multiple
- 7.01×
- Total profit
- $122,757
- Equity at exit
- $6,312
Cash invested: $20,440 (down + closing). Projections, not guarantees.
Landlord ↔ Tenant lean methodology
- Overall (STATE)
- 62 Landlord-Friendly
- State Michigan
- 62 Landlord-Friendly · EVEN
- County
- — inherits STATE
- City
- — inherits STATE
ZIP-level market 48912
- Rents YoY
- 7.0%
- Active inventory
- 100
- Price-to-rent
- 3.9×
Monthly cashflow live
- Estimated rent
- $1,544 high interval (Pro) →
- Mortgage (P&I)
- −$383
- Tax est. 1.5%
- −$91 /mo · $1,095/yr
- Insurance
- −$30
- HOA
- −$0
- Vacancy / Maint / Mgmt
- −$324
- Net cashflow
- $715
Break-even live
Sensitivity live
| Price | -10% $766 | -5% $740 | +0% $715 | +5% $690 | +10% $665 |
|---|---|---|---|---|---|
| Rent | -10% $593 | -5% $654 | +0% $715 | +5% $776 | +10% $837 |
| Rate | -1.0pp $752 | -0.5pp $734 | base $715 | +0.5pp $696 | +1.0pp $677 |
UW: 25.0% down · 7.5% · 30yr · 1.5% tax · 5.0% vac · 8.0% maint · 8.0% mgmt
Financing live
Cash to close
- Down payment
- $18,250
- Closing costs
- $2,190
- Reserves months
- —
- Total cash needed
- —
Loan-product check · same deal, 3 products live
Conventional
25% down · 7.5% · 30yr
- Down + closing
- —
- Monthly P&I
- —
- Monthly cashflow
- —
- DSCR
- —
- Eligible?
- —
Personal DTI + credit; lowest rate.
DSCR
20% down · 8.5% · 30yr
- Down + closing
- —
- Monthly P&I
- —
- Monthly cashflow
- —
- DSCR
- —
- Eligible?
- —
No personal income docs; deal must DSCR.
Hard money
10% down · 12.0% · 12mo
- Down + closing
- —
- Monthly P&I
- —
- Monthly cashflow
- —
- DSCR
- —
- Eligible?
- —
Short-term bridge; refi at stabilization.
Rent comps 8 comps
| Address | Beds | Baths | Sqft | Rent | $/sqft | DOM | Units | Dist |
|---|---|---|---|---|---|---|---|---|
| 1223 Bensch St Lansing, MI | 3.0 | 1.0 | 850 | $1,200 | $1.41 | 22d | 1 | 0.41mi |
| 910 Dakin St Lansing, MI | 3.0 | 1.0 | 908 | $1,295 | $1.43 | 45d | 1 | 0.42mi |
| 329 S Clemens Ave Lansing, MI | 3.0 | 1.0 | 1194 | $1,400 | $1.17 | 22d | 1 | 0.56mi |
| 1027 Climax St Lansing, MI | 3.0 | 1.5 | 1298 | $1,550 | $1.19 | 15d | 1 | 0.68mi |
| 208 S Bingham St Lansing, MI | 4.0 | 1.0 | 1020 | $1,500 | $1.47 | 15d | 1 | 0.94mi |
| 414 N Hayford Ave Lansing, MI | 3.0 | 1.0 | 990 | $1,425 | $1.44 | 45d | 1 | 1.12mi |
| 605 S Grand Ave Unit 2 Lansing, MI | 4.0 | 1.0 | 1200 | $1,100 | $0.92 | 45d | 1 | 1.39mi |
| 3113 Forest Rd Lansing, MI | 1.0–3.0 | 1.0–2.0 | 985 | $1,985 | $2.01 | 15d | 9 | 1.44mi |
Listing history 4 events
-
2026-06-14statusdays on market $73,000 Pending 4 DOM
-
2026-06-13days on market $73,000 Active 3 DOM
-
2026-06-09remarks 699-char remark
-
2026-06-09$73,000 Active 1 DOM
ⓘ Source: listings_history table (triggers on properties + properties_extension) + one-shot
backfill from property_details.listing_events for pre-trigger history.
Climate risk First Street
- Flood 1/10 Low FEMA zone X (unshaded) · 0% chance over 30 yrs
- Wildfire 1/10 Low
- Heat 2/10 Low 7 d/yr ≥96°F today · 15 d/yr by 30 yrs out
- Wind 2/10 Low
- Air quality 2/10 Low 1 unhealthy d/yr today · 2 by 30 yrs out
Nearby sold comps map
Loading sold comps map…
Walkable amenities ~0.75 mi
Loading nearby amenities…
Taxation est. · year 1
- Rental income
- $18,527
- − Mortgage interest
- −$4,089
- − Property taxes
- −$1,095
- − Insurance
- −$365
- − Repairs & maintenance
- −$1,482
- − Management
- −$1,482
- − Depreciation
- −$2,124
- Taxable income
- $7,890
- Est. tax owed @ 24.0%
- −$1,894
- After-tax cash flow
- $6,689/yr
For passive investors: Depreciation is non-cash, so a rental often shows a tax loss while cash-flowing — sheltering income. Rental losses are passive: they offset passive income freely, and up to $25,000/yr can offset ordinary (W-2) income if you actively participate and your MAGI is under $100k (phasing out to $0 by $150k); unused losses carry forward. On sale, claimed depreciation is recaptured at up to 25%, and gains may owe capital-gains tax (a 1031 exchange can defer both). Figures are a year-1 estimate at your 24.0% rate — not tax advice; consult a CPA.
Schools (NCES district)
- District
- Lansing Public School District
- NCES district ID
- 2621150
- Math proficiency
- 14% ▲ 1.00%
- Reading proficiency
- 23% ▲ 3.00%
- Median HH income
- $37,453
- Composite
- 18.76/100
- National rank
- #14002
- State rank
- #650 of 760 in MI
Livability — Lansing
- Score
- 79/100
- State rank
- #94
- US rank
- #2182
Category grades
Schools grade is shown separately in the Schools card above.
Census & demographics
- Census place
- Lansing, MI
- County
- Ingham County · 237,052 people
- City population
- 161,269
- Metro
- Lansing-East Lansing, MI
- Population (ZIP)
- 17,674
- Household income
- $54,429
- Rent vs Own
- Severe rent burden
- 1171.0
Population outlook (Ingham County) Hauer SSP2
- Today (2025)
- 300,362 people
- By 2030
- 307,808 · +2.5%
- By 2040
- 320,492 · +6.7%
- By 2050
- 333,223 · +10.9%
- By 2075
- 373,693 · +24.4%
- By 2100
- 392,021 · +30.5%
Race, ethnicity, and origin ACS 2023
- Neighborhood character
- Diverse neighborhood (Simpson 0.62)
- Race & ethnicity
- White 56% Black 22% Two or more races 12% Hispanic / Latino 10% Asian 4%
- Hispanic origin (detail)
- Mexican 6% Cuban 1%
- Common ancestry
- Romanian 5% Iranian 4% Lithuanian 3%
- Foreign-born
- 12% · Canada, Vietnam, China
- Languages at home
- 84% English-only · Spanish 5% French/Haitian/Cajun 1% Korean 1%
Political lean MEDSL · Ingham
- 2024 margin
- Strong D (+29.7) · D 63.9% · R 34.2% · Other 2.0%
- 2008→2024 swing
- -3.6pp toward R · 2008: 33.3pp · 2024: 29.7pp
- All cycles
- 2024: D+29.7 2020: D+32.2 2016: D+27.6 2012: D+27.9 2008: D+33.3
Not yet ingested
- Civics
- —
Market trends
- HPI YoY
- ▼ -167.67%
- Current HPI
- 171.1549
- Rent YoY
- ▲ 7.02%
- Metro
- Lansing-East Lansing, MI
- State GDP YoY
- ▲ 1.37%
- F500 in state
- 28
Industry mix (Fortune 500 HQ in MI)
| Industry | F500 HQs | Revenue |
|---|---|---|
| Automotive Parts | 3 | $48B |
|
||
| Automotive | 2 | $372B |
|
||
| Chemicals | 1 | $45B |
|
||
| Automotive Retail | 1 | $29B |
|
||
| Healthcare / Medical Devices | 1 | $23B |
|
||
| Automotive Technology | 1 | $20B |
|
||
Price history
+25.9% since first listed8 events — show timeline
- 2026-06-08 Listed $73,000 Greater Lansing AoR
- 2026-06-08 Listed $73,000 REALCOMP
- 2025-11-06 Sold (MLS) $61,500 Greater Lansing AoR
- 2025-11-06 Sold (MLS) $61,500 REALCOMP
- 2025-10-16 Contingent — REALCOMP
- 2025-10-16 Contingent — Greater Lansing AoR
- 2025-10-13 Listed $58,000 Greater Lansing AoR
- 2025-10-13 Listed $58,000 REALCOMP
Property tax history
+10.2%/yrLatest (2025): $4,687 · -16.2% YoY. Source: county tax records.
Cash-flow waterfall
monthlySold comps — $/sqft
last 12 mo · ≤1 miLoading sold comps…