504 E 24th St · Wolfforth, TX
Flood risk No data
- FEMA flood zone
- —
- Chance of flooding over 30 yrs
- —
- Est. flood insurance / yr
- —
Fire risk No data
- Est. fire insurance / yr
- —
Heat risk No data
- Hot days now (above threshold)
- —
- Hot days in 30 yrs
- —
Wind risk No data
- Chance of severe wind over 30 yrs
- —
Air-quality risk No data
- Unhealthy air days now
- —
- Unhealthy air days in 30 yrs
- —
Risk factors via First Street. Map © Google.
Why this score? — see what drove the D+ grade
The composite is a weighted blend of 9 inputs, each scored 0–100. Each bar is that input's sub-score; the figure is the points it added to the 100-point composite (weight × sub-score).
- Cash flow +11.0/30.0
- Appreciation +10.0/10.0
- ARV discount +7.5/15.0
- Schools +4.4/10.0
- Livability +4.0/5.0
- 1% rule +3.2/10.0
- DSCR +3.2/10.0
- Rent growth +2.5/5.0
- Condition / age +1.0/5.0
$192,000
🖨 Deal sheet 📄 Offer letter ✓ Due diligence
Listing remarks
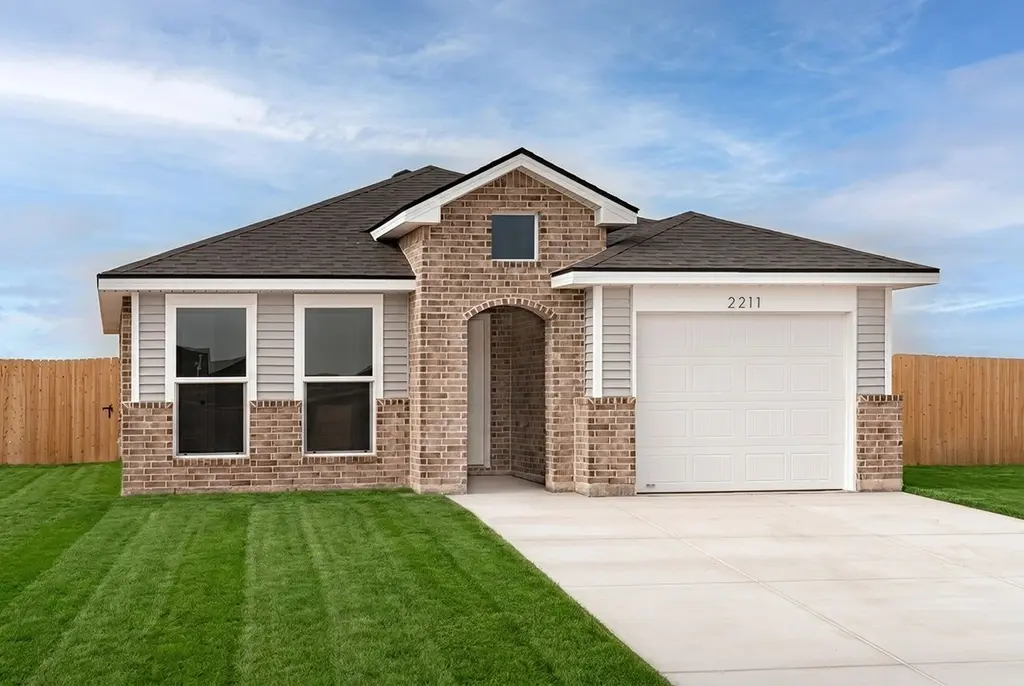
Buy NOW and get up to $7,000 Use-It-Your-Way Cash! Discover the charm and efficiency of our cottage-style homes—perfect for first-time buyers. The Kathleen floor plan features a beautiful brick and vinyl exterior, an inviting covered entry, and a bright open-concept layout with luxury vinyl plank flooring throughout the main areas. Enjoy a modern kitchen with an island, granite or quartz countertops, stainless steel appliances, and upgraded fixtures. This thoughtfully designed home also offers a private master suite with a walk-in closet, plus two additional bedrooms and a second full bath. The Kathleen combines style, comfort, and affordability—everything you need to feel at ho
Key facts
- Covered entry
- Modern kitchen
- Island
Tags
Property features AI
Finance
- Other: Living area approximately 1100; Listing status: Active; List price available
Exterior
- Parking: 1 parking space
- Utilities: Has heating; Has cooling
- Home design: Spec home (Plan: Kathleen); Single-family property
Interior
- Kitchen: Dishwasher; Disposal; Microwave
- Bedrooms: 3 bedrooms
- Bathrooms: 2 full bathrooms
- Heating & cooling: Forced air heating; Central air conditioning
- Interior features: Dishwasher; Disposal; Microwave; Ceiling fan(s)
Neighborhood map
What this means for you Summary
Snapshot
- This is a 3-bed/2.0-bath single-family listed at $192k. Condition is rated poor.
Deal economics
- At list price, monthly cash flow is $-80 ($-959/yr) — negative.
- To cash-flow at today's rent, offer at most $180k (6.0% below list).
- To meet the 1% rule (rent ≥ 1% of price), the offer needs to be $158k (17.8% below list).
- Recommended offer: $158k (17.8% below list) — sets the bar for 1% rule.
Location & tenants
- Location reads 80/100 on livability (#43 in TX, #1,872 nationally) — a professional / high-income tenant draw. Strengths: cost of living A+, housing A+, health & safety A+; Watch: amenities F, commute F.
- Frenship ISD (urban): math 47% / reading 54% proficiency, ranked #162 of 826 in TX (top 20%) — acceptable for families but not a draw, mixed tenant base, ~2y average lease.
- Market conditions: 472 active listings in the ZIP; 15 comparable units currently listed for rent nearby; rentals lingering (median 44d on market — plan ~5-8 weeks vacancy on turnover, expect pricing pressure); 53% of comp listings sitting > 30 days — soft ceiling on asking rent; solid renter incomes; 2,219 units permitted in Lubbock County in 2024 (252 in 5+ unit buildings).
Forward outlook
- In year one you build about $21k of equity ($1k loan paydown + $19k appreciation (10.0% local appreciation)).
- Lubbock County population projected at +39% by 2050 — long-run rental-demand tailwind backs the buy-and-hold thesis.
- At projected returns (10.0% appreciation + 3.0% rent growth), your $54k cash investment doubles in ~3 years — after that, you're playing with house money.
- By year 2, paydown + projected appreciation supports a ~$33k cash-out refi (75% LTV) — recoverable capital for the next deal without selling this one.
Negotiation context
- Only 1 days on market — expect competitive offers; lowballing is unlikely to land.
Questions for the listing agent
- What do current leases actually rent for vs. the listed asking? Can we see a recent rent roll and the last 12 months of T-12 income?
- Have any recent inspections been done? Can we get a copy of the seller's disclosures and any deferred-maintenance estimates?
- Is there a deadline driving the sale (1031 exchange, divorce, estate, relocation)? That informs how much negotiation room exists.
- Schools are B-rated — typically a magnet for longer-tenancy family renters. What's the average tenant stay here, and is there a school-zone premium baked into asking?
- The area grade is low — what's the realistic commute time and amenity access for the typical tenant pool here? Any planned neighborhood developments (good or bad) we should know about?
- What's the average days-on-market for RENTAL listings here right now (not sales)? A rising rental-DOM trend means longer vacancies and softer asking-rent achievability than the comps imply.
- What's the recent tenant-quality profile in this submarket — average credit score on applications, eviction rate, late-payment / NSF rate, and stable-employment percentage? A property-management company in the area should have these aggregated.
- How much new for-sale + rental construction is in the pipeline within 1–3 miles? Heavy new supply typically softens prices + rents 12–24 months out; constrained supply supports both.
Investment metrics
- 1% rule
- 0.82% ✗
- Cap rate
- 5.79%
- Cash-on-cash
- -1.78%
- DSCR
- 0.92
- GRM
- 10.1
CMA / ARV
No comps found within radius.
Projected returns pro-forma
10.0% appreciation · 3.0% rent growth · sell at horizon
- IRR
- 23.0%
- Equity multiple
- 2.85×
- Total profit
- $99,500
- Equity at exit
- $172,969
- IRR
- 20.5%
- Equity multiple
- 6.53×
- Total profit
- $297,062
- Equity at exit
- $373,014
Cash invested: $53,760 (down + closing). Projections, not guarantees.
Landlord ↔ Tenant lean methodology
- Overall (STATE)
- 87 Strongly Landlord-Friendly
- State Texas
- 87 Strongly Landlord-Friendly · R+5
- County
- — inherits STATE
- City
- — inherits STATE
ZIP-level market 79382
- Active inventory
- 472
- Price-to-rent
- 10.1×
Monthly cashflow live
- Estimated rent
- $1,578 high interval (Pro) →
- Mortgage (P&I)
- −$1,007
- Tax est. 1.5%
- −$240 /mo · $2,880/yr
- Insurance
- −$80
- HOA
- −$0
- Vacancy / Maint / Mgmt
- −$331
- Net cashflow
- $-80
Break-even live
UW: 25.0% down · 7.5% · 30yr · 1.5% tax · 5.0% vac · 8.0% maint · 8.0% mgmt
Financing live
Cash to close
- Down payment
- $48,000
- Closing costs
- $5,760
- Reserves months
- —
- Total cash needed
- —
Loan-product check · same deal, 3 products live
Conventional
25% down · 7.5% · 30yr
- Down + closing
- —
- Monthly P&I
- —
- Monthly cashflow
- —
- DSCR
- —
- Eligible?
- —
Personal DTI + credit; lowest rate.
DSCR
20% down · 8.5% · 30yr
- Down + closing
- —
- Monthly P&I
- —
- Monthly cashflow
- —
- DSCR
- —
- Eligible?
- —
No personal income docs; deal must DSCR.
Hard money
10% down · 12.0% · 12mo
- Down + closing
- —
- Monthly P&I
- —
- Monthly cashflow
- —
- DSCR
- —
- Eligible?
- —
Short-term bridge; refi at stabilization.
Rent comps 15 comps
| Address | Beds | Baths | Sqft | Rent | $/sqft | DOM | Units | Dist |
|---|---|---|---|---|---|---|---|---|
| 407 E 21st St Wolfforth, TX | 3.0 | 2.0 | 1360 | $1,399 | $1.03 | 21d | 1 | 0.09mi |
| 2011 Bryan Ave Wolfforth, TX | 3.0 | 2.0 | 1350 | $1,450 | $1.07 | 43d | 1 | 0.11mi |
| 2418 Aberdeen Ave Wolfforth, TX | 3.0 | 2.0 | 1450 | $1,799 | $1.24 | 43d | 1 | 0.11mi |
| 2008 Bryan Ave Unit Harvest-2008 A Bryan Wolfforth, TX | 3.0 | 2.0 | 1223 | $1,400 | $1.14 | 43d | 1 | 0.14mi |
| 2006 Corpus Ave Unit A Wolfforth, TX | 3.0 | 2.0 | 1223 | $1,425 | $1.17 | 13d | 1 | 0.17mi |
| 2001 Bryan Ave Unit B Wolfforth, TX | 3.0 | 2.0 | 1360 | $1,400 | $1.03 | 43d | 1 | 0.17mi |
| 2001 Corpus Ave Unit 2001 B Corpus Wolfforth, TX | 3.0 | 2.0 | 1350 | $1,500 | $1.11 | 21d | 1 | 0.18mi |
| 2001 Corpus Ave Unit B Wolfforth, TX | 3.0 | 2.0 | 1316 | $1,500 | $1.14 | 13d | 1 | 0.18mi |
| 1817 Corpus Ave Wolfforth, TX | 3.0 | 2.0 | 1405 | $1,600 | $1.14 | 13d | 1 | 0.21mi |
| 2304 Corpus Ave Wolfforth, TX | 3.0 | 2.0 | 1316 | $1,425 | $1.08 | 43d | 1 | 0.22mi |
| 2008 Cottonwood Ave Wolfforth, TX | 3.0 | 2.0 | 1450 | $1,810 | $1.25 | 43d | 1 | 0.24mi |
| 304 E 19th St Wolfforth, TX | 3.0 | 2.0 | 1114 | $1,150 | $1.03 | 13d | 1 | 0.30mi |
| 1712 Corpus Ave Wolfforth, TX | 2.0 | 2.0 | 1335 | $1,375 | $1.03 | 43d | 1 | 0.34mi |
| 611 E 14th St Wolfforth, TX | 3.0 | 2.0 | 1299 | $1,725 | $1.33 | 43d | 1 | 0.72mi |
| 127 Brooke Blvd Wolfforth, TX | 3.0 | 2.5 | 1714 | $1,757 | $1.03 | 13d | 2 | 1.27mi |
Listing history 7 events
-
2026-06-18remarks 687-char remark
-
2026-06-18days on market $192,000 Active 1 DOM
-
2026-06-17days on market $192,000 Active 7 DOM
-
2026-06-16days on market $192,000 Active 6 DOM
-
2026-06-15days on market $192,000 Active 5 DOM
-
2026-06-13remarks 356-char remark
-
2026-06-13$192,000 Active 2 DOM
ⓘ Source: listings_history table (triggers on properties + properties_extension) + one-shot
backfill from property_details.listing_events for pre-trigger history.
Nearby sold comps map
Loading sold comps map…
Walkable amenities ~0.75 mi
Loading nearby amenities…
Taxation est. · year 1
- Rental income
- $18,940
- − Mortgage interest
- −$10,755
- − Property taxes
- −$2,880
- − Insurance
- −$960
- − Repairs & maintenance
- −$1,515
- − Management
- −$1,515
- − Depreciation
- −$5,585
- Taxable loss
- −$4,270
- Est. tax savings @ 24.0%
- +$1,025
- After-tax cash flow
- $65/yr
For passive investors: Depreciation is non-cash, so a rental often shows a tax loss while cash-flowing — sheltering income. Rental losses are passive: they offset passive income freely, and up to $25,000/yr can offset ordinary (W-2) income if you actively participate and your MAGI is under $100k (phasing out to $0 by $150k); unused losses carry forward. On sale, claimed depreciation is recaptured at up to 25%, and gains may owe capital-gains tax (a 1031 exchange can defer both). Figures are a year-1 estimate at your 24.0% rate — not tax advice; consult a CPA.
Condition & rehab AI · 1 photo
This home requires extensive repairs and maintenance, including a new roof, exterior siding and paint, and new flooring. Significant improvements would be needed to bring the property up to a move-in-ready condition.
Repairs flagged
- Major roof — Significant damage and potential leaks.
- Major exterior siding — Severe peeling and damage.
- Major interior walls — Peeling paint and potential structural issues.
- Major flooring — Worn-out vinyl plank flooring with visible wear and tear.
- Major exterior paint — Severe peeling and damage.
- Major exterior siding — Severe peeling and damage.
- Major exterior siding — Severe peeling and damage.
- Major exterior siding — Severe peeling and damage.
- Major exterior siding — Severe peeling and damage.
- Major exterior siding — Severe peeling and damage.
- Major exterior siding — Severe peeling and damage.
- Major exterior siding — Severe peeling and damage.
Value-add opportunities
- Both new roof — A new roof would significantly improve the home's appearance and value.
- Both exterior siding and paint — New siding and paint would improve the home's curb appeal and value.
- Both new flooring — New flooring would improve the home's appearance and value.
- Both paint interior walls — New paint would improve the home's appearance and value.
- Both landscaping — New landscaping would improve the home's curb appeal and value.
- Both landscaping — New landscaping would improve the home's curb appeal and value.
- Both landscaping — New landscaping would improve the home's curb appeal and value.
- Both landscaping — New landscaping would improve the home's curb appeal and value.
- Both landscaping — New landscaping would improve the home's curb appeal and value.
- Both landscaping — New landscaping would improve the home's curb appeal and value.
- Both landscaping — New landscaping would improve the home's curb appeal and value.
- Both landscaping — New landscaping would improve the home's curb appeal and value.
Renovation cost estimate screening
| Repair item | Severity | Est. cost |
|---|---|---|
| roof · Significant damage and potential leaks. | Major | $15,000–50,000 |
| exterior siding · Severe peeling and damage. | Major | $15,000–50,000 |
| interior walls · Peeling paint and potential structural issues. | Major | $15,000–50,000 |
| flooring · Worn-out vinyl plank flooring with visible wear and tear. | Major | $15,000–50,000 |
| exterior paint · Severe peeling and damage. | Major | $15,000–50,000 |
| exterior siding · Severe peeling and damage. | Major | $15,000–50,000 |
| exterior siding · Severe peeling and damage. | Major | $15,000–50,000 |
| exterior siding · Severe peeling and damage. | Major | $15,000–50,000 |
| exterior siding · Severe peeling and damage. | Major | $15,000–50,000 |
| exterior siding · Severe peeling and damage. | Major | $15,000–50,000 |
| exterior siding · Severe peeling and damage. | Major | $15,000–50,000 |
| exterior siding · Severe peeling and damage. | Major | $15,000–50,000 |
| Total estimated repair cost · 12 items | $180,000–600,000 |
Value-add ROI direction
- Both new roof — A new roof would significantly improve the home's appearance and value. ↑
- Both exterior siding and paint — New siding and paint would improve the home's curb appeal and value. ↑
- Both new flooring — New flooring would improve the home's appearance and value. ↑
- Both paint interior walls — New paint would improve the home's appearance and value. ↑
- Both landscaping — New landscaping would improve the home's curb appeal and value. ↑
- Both landscaping — New landscaping would improve the home's curb appeal and value. ↑
- Both landscaping — New landscaping would improve the home's curb appeal and value. ↑
- Both landscaping — New landscaping would improve the home's curb appeal and value. ↑
- Both landscaping — New landscaping would improve the home's curb appeal and value. ↑
- Both landscaping — New landscaping would improve the home's curb appeal and value. ↑
- Both landscaping — New landscaping would improve the home's curb appeal and value. ↑
- Both landscaping — New landscaping would improve the home's curb appeal and value. ↑
ⓘ Cost ranges are severity-bucket heuristics (US national rule-of-thumb). Get contractor quotes + a written scope before underwriting a rehab budget.
Schools (NCES district)
- District
- Frenship ISD
- NCES district ID
- 4819830
- Math proficiency
- 47% ▼ -8.00%
- Reading proficiency
- 54% ▬ 0.00%
- Median HH income
- $54,376
- Composite
- 43.59/100
- National rank
- #2976
- State rank
- #162 of 826 in TX
Livability — Wolfforth
- Score
- 80/100
- State rank
- #43
- US rank
- #1872
Category grades
Schools grade is shown separately in the Schools card above.
Census & demographics
- Census place
- Wolfforth, TX
- County
- Lubbock County · 293,542 people
- City population
- 10,512
- Metro
- Lubbock, TX
- Population (ZIP)
- 10,512
- Household income
- $84,457
- Rent vs Own
- Severe rent burden
- 135.0
Population outlook (Lubbock County) Hauer SSP2
- Today (2025)
- 345,960 people
- By 2030
- 371,449 · +7.4%
- By 2040
- 424,539 · +22.7%
- By 2050
- 481,150 · +39.1%
- By 2075
- 633,467 · +83.1%
- By 2100
- 746,853 · +115.9%
Race, ethnicity, and origin ACS 2023
- Neighborhood character
- Majority White (64%)
- Race & ethnicity
- White 64% Hispanic / Latino 31% Two or more races 18% Black 1%
- Hispanic origin (detail)
- Mexican 28%
- Common ancestry
- Italian 4% Slovak 2% Lithuanian 2%
- Foreign-born
- 4% · Canada
- Languages at home
- 85% English-only · Spanish 14%
Political lean MEDSL · Lubbock
- 2024 margin
- Solid R (+39.5) · D 29.7% · R 69.2% · Other 1.0%
- 2008→2024 swing
- -2.8pp toward R · 2008: -36.7pp · 2024: -39.5pp
- All cycles
- 2024: R+39.5 2020: R+32.2 2016: R+38.4 2012: R+40.9 2008: R+36.7
Not yet ingested
- Civics
- —
Market trends
- HPI YoY
- ▲ 166.08%
- Current HPI
- 561.4491
- Rent YoY
- —
- Metro
- Lubbock, TX
- State GDP YoY
- ▲ 3.95%
- F500 in state
- 110
Industry mix (Fortune 500 HQ in TX)
| Industry | F500 HQs | Revenue |
|---|---|---|
| Energy | 16 | $1,198B |
|
||
| Technology | 5 | $198B |
|
||
| Engineering / Construction | 4 | $72B |
|
||
| Energy Services | 3 | $60B |
|
||
| Utilities | 3 | $41B |
|
||
| Healthcare | 2 | $330B |
|
||
Cash-flow waterfall
monthlySold comps — $/sqft
last 12 mo · ≤1 miLoading sold comps…