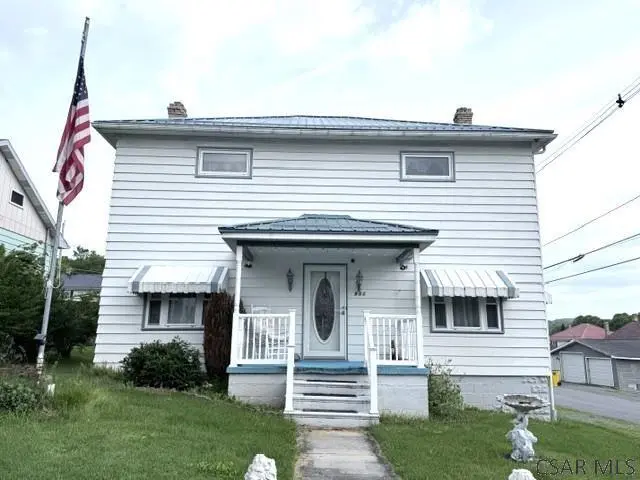
901 Market St · St. Michael, PA
Flood risk 1/10 · Minimal
- FEMA flood zone
- X (unshaded)
- Chance of flooding over 30 yrs
- 0.0%
- Est. flood insurance / yr
- $473 – $860
Fire risk 1/10 · Minimal
- Est. fire insurance / yr
- $511 – $949
Heat risk 3/10 · Minor
- Hot days now (above 91°F)
- 8 days/yr
- Hot days in 30 yrs
- 19 days/yr
Wind risk 2/10 · Minimal
- Chance of severe wind over 30 yrs
- —
Air-quality risk 2/10 · Minimal
- Unhealthy air days now
- 1 days/yr
- Unhealthy air days in 30 yrs
- 2 days/yr
Risk factors via First Street. Map © Google.
Why this score? — see what drove the B- grade
The composite is a weighted blend of 9 inputs, each scored 0–100. Each bar is that input's sub-score; the figure is the points it added to the 100-point composite (weight × sub-score).
- Cash flow +23.6/30.0
- ARV discount +15.0/15.0
- DSCR +7.6/10.0
- 1% rule +5.2/10.0
- Appreciation +5.0/10.0
- Schools +3.7/10.0
- Rent growth +2.5/5.0
- Livability +2.5/5.0
- Condition / age +2.5/5.0
$124,900
🖨 Deal sheet (PDF) 📄 Offer letter ✓ Due diligence
Listing remarks
WELL MAINTAINED HOME IN FOREST HILLS SCHOOLS. .. this 4 bedroom, 2 bath home situated on corner lot is ready for a new owner and could be your next home sweet home. As you enter, you will be impressed with the spacious living room/dining room combo. This space is perfect for relaxing, hosting get-togethers, or enjoying delicious meals with your guests. The eat-in kitchen features an abundance of cabinets/counters, built-in island/table, and appliances. The main floor also includes cozy family room, and updated full bath. Upstairs provides 4 generous-sized bedrooms, updated 3/4 bath, and full walk-up attic for storage. The unfinished basement has vanity, toilet, and shower and laundry hook-u
Key facts
- Updated full bath
- Built-in island
- Eat-in kitchen
Tags
Property features AI
Exterior
- Parking: Detached garage with garage door opener; 2 garage spaces
- Utilities: Public water; Public sewer (sewer available)
- Home design: Single-family residence; Two stories
- Construction: Frame construction; Shingle roof
- Exterior features: Covered porch; Corner lot; Rectangular lot; City street frontage; Public maintained road
Interior
- Kitchen: Dishwasher; Microwave; Range/Oven; Refrigerator
- Flooring: Carpet; Ceramic tile
- Bathrooms: 2 full bathrooms
- Heating & cooling: Forced air heating (oil); Ceiling fan(s) for cooling
- Interior features: Eat-in kitchen; Double-pane windows
- Laundry & utility: Laundry in basement; Full basement
Neighborhood map
What this means for you Summary
Snapshot
- This is a 4-bed/2.0-bath single-family listed at $125k.
Deal economics
- At list price, monthly cash flow is $235 ($3k/yr) — positive.
- The deal already cash-flows at list — no discount required.
- Meets the 1% rule at list price ($1k rent vs $125k).
Location & tenants
- Location reads: area grade B — affects rentability + tenant quality, not the cash-flow math above.
- Forest Hills SD (rural): math 40% / reading 47% proficiency, ranked #293 of 539 in PA (top 54%) — families likely to look elsewhere, expect single-tenant / working-renter base with shorter leases.
- Zoned schools: Forest Hills El Sch (math 43% / reading 55%, grade D, #712 of 1,518 statewide, top 47%, 957 students, 43% FRL); Forest Hills Jshs (math 37% / reading 30%, grade F, #323 of 437 statewide, top 74%, 775 students, 30% FRL) — zoned schools at 36% FRL track the district average.
- Market conditions: 3 active listings in the ZIP; 64 units permitted in Cambria County in 2024 (0 in 5+ unit buildings).
Forward outlook
- In year one you build about $5k of equity ($864 loan paydown + $4k appreciation (3.0% local appreciation)).
- Cambria County population projected at -28% by 2050 — secular population decline; favor cash flow + early exit over multi-decade hold.
- At projected returns (3.0% appreciation + 3.0% rent growth), your $35k cash investment doubles in ~5 years — after that, you're playing with house money.
- By year 8, paydown + projected appreciation supports a ~$34k cash-out refi (75% LTV) — recoverable capital for the next deal without selling this one.
Negotiation context
- Only 9 days on market — expect competitive offers; lowballing is unlikely to land.
Risks & watch-outs
- Watch-outs: built in 1937 — expect roof / HVAC / electrical / plumbing capex.
Questions for the listing agent
- Built in 1937 — when were the roof, HVAC, electrical panel, plumbing, and water heater last replaced?
- Is there a deadline driving the sale (1031 exchange, divorce, estate, relocation)? That informs how much negotiation room exists.
- What's the average days-on-market for RENTAL listings here right now (not sales)? A rising rental-DOM trend means longer vacancies and softer asking-rent achievability than the comps imply.
- What's the recent tenant-quality profile in this submarket — average credit score on applications, eviction rate, late-payment / NSF rate, and stable-employment percentage? A property-management company in the area should have these aggregated.
- How much new for-sale + rental construction is in the pipeline within 1–3 miles? Heavy new supply typically softens prices + rents 12–24 months out; constrained supply supports both.
Investment metrics
- 1% rule
- 1.02% ✓
- Cap rate
- 8.55%
- Cash-on-cash
- 8.07%
- DSCR
- 1.36
- GRM
- 8.2
CMA / ARV
- ARV (on-the-fly)
- $150,360
- Comps found
- 2
Show comp detail 2 sales within ~0.75 mi
| Address | Dist | Beds/Ba | Sqft | Sold | Price | $/sf | Match |
|---|---|---|---|---|---|---|---|
| 177 Washington St | 0.16mi | 5/2.0 (+1) | 1,998 (+12%) | 10mo | $123,000 | $62 | 60 |
| 315 Ragers Hill Rd | 0.66mi | 3/1.5 (-1) | 1,659 (-7%) | 12mo | $139,900 | $84 | 40 |
Match score weights: distance 35% · size 25% · config 20% · recency 20%. Top-matched comps best support the ARV.
Projected returns pro-forma
3.0% appreciation · 3.0% rent growth · sell at horizon
- IRR
- 15.0%
- Equity multiple
- 1.86×
- Total profit
- $29,978
- Equity at exit
- $56,160
- IRR
- 16.7%
- Equity multiple
- 3.45×
- Total profit
- $85,701
- Equity at exit
- $86,550
Cash invested: $34,972 (down + closing). Projections, not guarantees.
Landlord ↔ Tenant lean methodology
- Overall (STATE)
- 62 Landlord-Friendly
- State Pennsylvania
- 62 Landlord-Friendly · EVEN
- County
- — inherits STATE
- City
- — inherits STATE
ZIP-level market 15951
- Active inventory
- 3
- Price-to-rent
- 8.2×
Monthly cashflow live
- Estimated rent
- $1,268 medium interval (Pro) →
- Mortgage (P&I)
- −$655
- Tax from tax record
- −$60 /mo · $714/yr
- Insurance
- −$52
- HOA
- −$0
- Vacancy / Maint / Mgmt
- −$266
- Net cashflow
- $235
Break-even live
Sensitivity live
| Price | -10% $306 | -5% $270 | +0% $235 | +5% $200 | +10% $164 |
|---|---|---|---|---|---|
| Rent | -10% $135 | -5% $185 | +0% $235 | +5% $285 | +10% $335 |
| Rate | -1.0pp $298 | -0.5pp $267 | base $235 | +0.5pp $203 | +1.0pp $170 |
UW: 25.0% down · 7.5% · 30yr · 1.5% tax · 5.0% vac · 8.0% maint · 8.0% mgmt
Financing live
Cash to close
- Down payment
- $31,225
- Closing costs
- $3,747
- Reserves months
- —
- Total cash needed
- —
Loan-product check · same deal, 3 products live
Conventional
25% down · 7.5% · 30yr
- Down + closing
- —
- Monthly P&I
- —
- Monthly cashflow
- —
- DSCR
- —
- Eligible?
- —
Personal DTI + credit; lowest rate.
DSCR
20% down · 8.5% · 30yr
- Down + closing
- —
- Monthly P&I
- —
- Monthly cashflow
- —
- DSCR
- —
- Eligible?
- —
No personal income docs; deal must DSCR.
Hard money
10% down · 12.0% · 12mo
- Down + closing
- —
- Monthly P&I
- —
- Monthly cashflow
- —
- DSCR
- —
- Eligible?
- —
Short-term bridge; refi at stabilization.
Listing history 6 events
-
2026-06-07statusdays on market $124,900 Pending 9 DOM
-
2026-06-04days on market $124,900 Active 8 DOM
-
2026-06-02days on market $124,900 Active 7 DOM
-
2026-06-01days on market $124,900 Active 6 DOM
-
2026-05-31days on market $124,900 Active 5 DOM
-
2026-05-26$124,900 Active
ⓘ Source: listings_history table (triggers on properties + properties_extension) + one-shot
backfill from property_details.listing_events for pre-trigger history.
Tax reassessment forecast PA · Partial reset (capped growth)
- Current annual tax
- $714 · $60/mo
- Projected year-2 tax
- $1,344 · $112/mo
- Expected delta
- +$630/yr (+$52/mo · 88.2%)
ⓘ Screening estimate from a state-policy table — verify with the county assessor before closing.
Climate risk First Street
- Flood 1/10 Low FEMA zone X (unshaded) · 0% chance over 30 yrs
- Wildfire 1/10 Low
- Heat 3/10 Moderate 8 d/yr ≥91°F today · 19 d/yr by 30 yrs out
- Wind 2/10 Low
- Air quality 2/10 Low 1 unhealthy d/yr today · 2 by 30 yrs out
Nearby sold comps map
Loading sold comps map…
Walkable amenities ~0.75 mi
Loading nearby amenities…
Taxation est. · year 1
- Rental income
- $15,214
- − Mortgage interest
- −$6,996
- − Property taxes
- −$714
- − Insurance
- −$624
- − Repairs & maintenance
- −$1,217
- − Management
- −$1,217
- − Depreciation
- −$3,633
- Taxable income
- $812
- Est. tax owed @ 24.0%
- −$195
- After-tax cash flow
- $2,626/yr
For passive investors: Depreciation is non-cash, so a rental often shows a tax loss while cash-flowing — sheltering income. Rental losses are passive: they offset passive income freely, and up to $25,000/yr can offset ordinary (W-2) income if you actively participate and your MAGI is under $100k (phasing out to $0 by $150k); unused losses carry forward. On sale, claimed depreciation is recaptured at up to 25%, and gains may owe capital-gains tax (a 1031 exchange can defer both). Figures are a year-1 estimate at your 24.0% rate — not tax advice; consult a CPA.
Schools (NCES district)
- District
- Forest Hills SD
- NCES district ID
- 4209940
- Math proficiency
- 40% ▼ -8.00%
- Reading proficiency
- 47% ▼ -20.00%
- Median HH income
- $48,950
- Composite
- 37.27/100
- National rank
- #4452
- State rank
- #293 of 539 in PA
Livability — St. Michael
No livability data for this city. (Only ~50 U.S. cities are tracked.)
Census & demographics
- Census place
- St. Michael, PA
- City population
- 550
- Population (ZIP)
- 550
Population outlook (Cambria County) Hauer SSP2
- Today (2025)
- 122,754 people
- By 2030
- 115,827 · -5.6%
- By 2040
- 101,309 · -17.5%
- By 2050
- 88,379 · -28.0%
- By 2075
- 65,237 · -46.9%
- By 2100
- 46,909 · -61.8%
Race, ethnicity, and origin ACS 2023
- Neighborhood character
- Predominantly White (99%)
- Race & ethnicity
- White 99%
- Common ancestry
- Romanian 26%
Political lean MEDSL · Cambria
- 2024 margin
- Solid R (+39.7) · D 29.8% · R 69.5%
- 2008→2024 swing
- -40.4pp toward R · 2008: 0.7pp · 2024: -39.7pp
- All cycles
- 2024: R+39.7 2020: R+37.3 2016: R+37.8 2012: R+17.8 2008: D+0.7
Not yet ingested
- Civics
- —
Market trends
- HPI YoY
- —
- Current HPI
- —
- Rent YoY
- —
- Metro
- —
- State GDP YoY
- ▲ 1.68%
- F500 in state
- 34
Industry mix (Fortune 500 HQ in PA)
| Industry | F500 HQs | Revenue |
|---|---|---|
| Healthcare | 2 | $309B |
|
||
| Insurance | 2 | $27B |
|
||
| Telecommunications / Media | 1 | $124B |
|
||
| Industrial Distribution | 1 | $22B |
|
||
| Financial Services | 1 | $20B |
|
||
| Chemicals / Materials | 1 | $18B |
|
||
Price history
1 event — show timeline
- 2026-05-26 Listed $124,900 CSMLS
Property tax history
+1.5%/yrLatest (2026): $714 · +3.5% YoY. Source: county tax records.
Cash-flow waterfall
monthlySold comps — $/sqft
last 12 mo · ≤1 miLoading sold comps…