 🏷️ Likely Rental
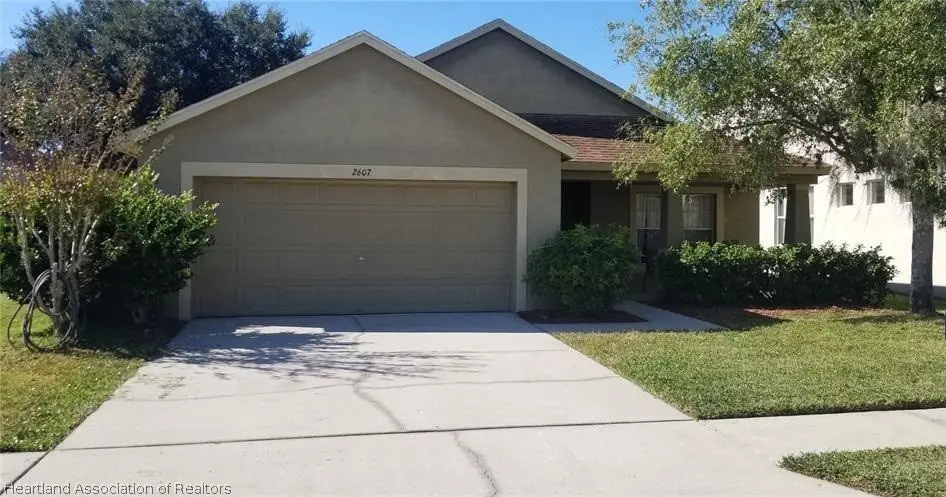
2607 Palesta Dr · Trinity, FL
Flood risk 1/10 · Minimal
- FEMA flood zone
- X (unshaded)
- Chance of flooding over 30 yrs
- 0.0%
- Est. flood insurance / yr
- $507 – $1,088
Fire risk 3/10 · Minor
- Est. fire insurance / yr
- $947 – $1,759
Heat risk 10/10 · Severe
- Hot days now (above 108°F)
- 8 days/yr
- Hot days in 30 yrs
- 30 days/yr
Wind risk 10/10 · Severe
- Chance of severe wind over 30 yrs
- 99.0%
Air-quality risk 2/10 · Minimal
- Unhealthy air days now
- 1 days/yr
- Unhealthy air days in 30 yrs
- 1 days/yr
Risk factors via First Street. Map © Google.
Why this score? — see what drove the D grade
The composite is a weighted blend of 9 inputs, each scored 0–100. Each bar is that input's sub-score; the figure is the points it added to the 100-point composite (weight × sub-score).
- Cash flow +15.0/30.0
- ARV discount +7.5/15.0
- 1% rule +5.0/10.0
- DSCR +5.0/10.0
- Schools +4.3/10.0
- Livability +3.9/5.0
- Condition / age +2.5/5.0
- Rent growth +1.3/5.0
- Appreciation +0.0/10.0
$5,000
🖨 Deal sheet 📄 Offer letter ✓ Due diligence
Listing remarks MLS
4/2/2 1709 SqFt. Classic front Covered Porch. Fab Kitchen w/ 42' Cabinets, Great front Den/Study or 4th Bedroom w/ California built in Bookcase and Work Station. Master Suite w/ separate Garden Tub and Shower, His & Her sinks, Large Walk in Closet. Gated Community. Covered rear Lanai. LOW HOA dues, NO CDD fees, and NO FLOOD ZONE! Located in Trinity West a private Gated Community. Zoned for top rated schools, Trinity Oaks Elementary, Seven Springs middle, and Mitchell High. Property is occupied. New AC System Feb 2017
Key facts
- 6,098 sq ft lot
- 2 garage spots
- Built 2003
Property features AI
Exterior
- Parking: 2-car garage
- Utilities: Other water source; Other sewer
- Home design: Single family residence; One level; Residential property
- Construction: Construction details: see remarks
- Exterior features: Front porch; Other roof
Interior
- Flooring: Other flooring
- Bathrooms: 2 full bathrooms
- Heating & cooling: No heating; No cooling
- Interior features: Other flooring
Neighborhood map
What this means for you Summary
Snapshot
- This is a 4-bed/2.0-bath single-family listed at $5k.
Deal economics
- At list price, monthly cash flow is $2k ($22k/yr) — positive.
- The deal already cash-flows at list — no discount required.
- Meets the 1% rule at list price ($2k rent vs $5k).
- Cap rate 438.8% vs local median 2.9% in Trinity — top-decile yield for the area; either an underpriced asset or a hidden risk that comps aren't pricing in. Stress-test before assuming the spread holds.
Location & tenants
- Location reads 78/100 on livability (#156 in FL, #2,369 nationally) — a middle-class / working-renter tenant base. Strengths: crime A+, employment A+, housing A+; Watch: cost of living D, amenities F, commute F.
- Pasco (suburban): math 50% / reading 52% proficiency, ranked #32 of 73 in FL (top 44%) — acceptable for families but not a draw, mixed tenant base, ~2y average lease.
- Market conditions: Rents falling (-4.7%/yr); 542 active listings in the ZIP; 14 comparable units currently listed for rent nearby; rentals at typical pace (median 21d on market — plan ~3-4 weeks tenant-placement turnaround); solid renter incomes; 6,765 units permitted in Pasco County in 2024 (1,250 in 5+ unit buildings).
- This rent runs 33% of the median local income ($85k/yr) — at the standard rent-burdened threshold; future hikes will face affordability resistance.
Forward outlook
- Local home prices are declining (-3.0%/yr); year-one equity from $35 of loan paydown is wiped out by about $150 of value loss. Plan a longer hold.
- Pasco County population projected at +29% by 2050 — long-run rental-demand tailwind backs the buy-and-hold thesis.
- At projected returns (-3.0% appreciation + 0.0% rent growth), your $1k cash investment doubles in ~1 year — after that, you're playing with house money.
Negotiation context
- Only 10 days on market — expect competitive offers; lowballing is unlikely to land.
- 6 sale attempts since 22y ago with the ask held roughly flat each time — persistent listings suggest the price (not the market) is what's stuck; bring a comps-based counter.
Risks & watch-outs
- Climate carrying-cost: severe wind risk, 99% chance of damaging wind over 30y; extreme-heat days projected 8→30/yr by 2055 (HVAC capex compounding) — expect insurance premiums to compound above CPI over the hold.
Questions for the listing agent
- Is there a deadline driving the sale (1031 exchange, divorce, estate, relocation)? That informs how much negotiation room exists.
- Schools are A-rated — typically a magnet for longer-tenancy family renters. What's the average tenant stay here, and is there a school-zone premium baked into asking?
- The area grade is low — what's the realistic commute time and amenity access for the typical tenant pool here? Any planned neighborhood developments (good or bad) we should know about?
- What's the average days-on-market for RENTAL listings here right now (not sales)? A rising rental-DOM trend means longer vacancies and softer asking-rent achievability than the comps imply.
- What's the recent tenant-quality profile in this submarket — average credit score on applications, eviction rate, late-payment / NSF rate, and stable-employment percentage? A property-management company in the area should have these aggregated.
- How much new for-sale + rental construction is in the pipeline within 1–3 miles? Heavy new supply typically softens prices + rents 12–24 months out; constrained supply supports both.
Investment metrics
- 1% rule
- 46.49% ✓
- Cap rate
- 438.76%
- Cash-on-cash
- 1544.52%
- DSCR
- 69.72
- GRM
- 0.2
CMA / ARV
- ARV (on-the-fly)
- $427,250
- Comps found
- 12
Show comp detail 12 sales within ~0.75 mi
| Address | Dist | Beds/Ba | Sqft | Sold | Price | $/sf | Match |
|---|---|---|---|---|---|---|---|
| 2247 Ground Squirrel Dr | 0.37mi | 3/2.5 (-1) | 1,778 (+4%) | 3mo | $175,000 | $98 | 67 |
| 2233 Egret Walk Ct | 0.50mi | 4/2.0 | 1,685 (-1%) | 12mo | $455,000 | $270 | 64 |
| 7435 Hideaway Trl | 0.54mi | 4/2.0 | 1,671 (-2%) | 13mo | $440,000 | $263 | 60 |
| 2211 Ground Squirrel Dr | 0.43mi | 3/2.0 (-1) | 1,874 (+10%) | 1mo | $430,000 | $229 | 58 |
| 7806 Jenner Ave | 0.55mi | 3/2.0 (-1) | 1,655 (-3%) | 8mo | $299,900 | $181 | 57 |
| 8377 Capstone Ranch Dr | 0.59mi | 3/2.0 (-1) | 1,873 (+10%) | 4mo | $485,000 | $259 | 48 |
| 7451 Swan Lake Dr | 0.60mi | 3/2.0 (-1) | 1,517 (-11%) | 1mo | $380,000 | $250 | 47 |
| 8460 Capstone Ranch Dr | 0.61mi | 3/2.0 (-1) | 1,873 (+10%) | 11mo | $489,900 | $262 | 41 |
| 7737 Mitchell Ranch Rd | 0.70mi | 3/2.0 (-1) | 1,494 (-13%) | 0mo | $210,000 | $141 | 41 |
| 7227 Otter Creek Dr | 0.70mi | 4/2.5 | 1,891 (+11%) | 8mo | $480,000 | $254 | 41 |
| 7320 Hideaway Trl | 0.68mi | 3/2.0 (-1) | 1,940 (+14%) | 2mo | $430,000 | $222 | 39 |
| 3204 Payne St | 0.60mi | 3/2.0 (-1) | 1,454 (-15%) | 9mo | $315,000 | $217 | 35 |
Match score weights: distance 35% · size 25% · config 20% · recency 20%. Top-matched comps best support the ARV.
Projected returns pro-forma
-3.0% appreciation · 0.0% rent growth · sell at horizon
- IRR
- —
- Equity multiple
- 77.56×
- Total profit
- $107,178
- Equity at exit
- $746
- IRR
- —
- Equity multiple
- 154.52×
- Total profit
- $214,923
- Equity at exit
- $432
Cash invested: $1,400 (down + closing). Projections, not guarantees.
Landlord ↔ Tenant lean methodology
- Overall (STATE)
- 87 Strongly Landlord-Friendly
- State Florida
- 87 Strongly Landlord-Friendly · R+3
- County
- — inherits STATE
- City
- — inherits STATE
ZIP-level market 34655
- Home prices YoY
- -22.9%
- Rents YoY
- -4.7%
- Active inventory
- 542
- Price-to-rent
- 0.2×
Monthly cashflow live
- Estimated rent
- $2,325 high interval (Pro) →
- Mortgage (P&I)
- −$26
- Tax est. 1.5%
- −$6 /mo · $75/yr
- Insurance
- −$2
- HOA
- −$0
- Vacancy / Maint / Mgmt
- −$488
- Net cashflow
- $1,802
Break-even live
UW: 25.0% down · 7.5% · 30yr · 1.5% tax · 5.0% vac · 8.0% maint · 8.0% mgmt
Financing live
Cash to close
- Down payment
- $1,250
- Closing costs
- $150
- Reserves months
- —
- Total cash needed
- —
Loan-product check · same deal, 3 products live
Conventional
25% down · 7.5% · 30yr
- Down + closing
- —
- Monthly P&I
- —
- Monthly cashflow
- —
- DSCR
- —
- Eligible?
- —
Personal DTI + credit; lowest rate.
DSCR
20% down · 8.5% · 30yr
- Down + closing
- —
- Monthly P&I
- —
- Monthly cashflow
- —
- DSCR
- —
- Eligible?
- —
No personal income docs; deal must DSCR.
Hard money
10% down · 12.0% · 12mo
- Down + closing
- —
- Monthly P&I
- —
- Monthly cashflow
- —
- DSCR
- —
- Eligible?
- —
Short-term bridge; refi at stabilization.
Rent comps 14 comps
| Address | Beds | Baths | Sqft | Rent | $/sqft | DOM | Units | Dist |
|---|---|---|---|---|---|---|---|---|
| 2527 Stanhope Dr New Port Richey, FL | 3.0 | 2.5 | 1915 | $2,500 | $1.31 | 11d | 1 | 0.31mi |
| 2421 Kokomo Way New Port Richey, FL | 3.0 | 2.5 | 2124 | $2,000 | $0.94 | 24d | 1 | 0.45mi |
| 7101 Columns Cir New Port Richey, FL | 1.0–3.0 | 1.0–2.0 | 1106 | $1,824 | $1.65 | 2d | 22 | 0.69mi |
| 8335 Birch Haven Ln New Port Richey, FL | 3.0 | 2.5 | 1634 | $2,100 | $1.29 | 17d | 1 | 0.71mi |
| 7543 Ivory Ter New Port Richey, FL | 3.0 | 2.0 | 1653 | $1,895 | $1.15 | 24d | 1 | 0.87mi |
| 3602 Murrow St New Port Richey, FL | 3.0 | 2.0 | 1283 | $2,090 | $1.63 | 5d | 1 | 0.99mi |
| 7742 Arlight Dr New Port Richey, FL | 3.0 | 2.0 | 1653 | $1,995 | $1.21 | 24d | 1 | 1.09mi |
| 3707 Mexicali St New Port Richey, FL | 3.0 | 2.0 | 1185 | $1,925 | $1.62 | 5d | 1 | 1.09mi |
| 8248 Corner Pine Way New Port Richey, FL | 3.0 | 2.5 | 1634 | $2,200 | $1.35 | 22d | 1 | 1.16mi |
| 7911 Aden Loop New Port Richey, FL | 3.0 | 2.0 | 1067 | $1,785 | $1.67 | 24d | 1 | 1.16mi |
| 7220 Exemplar Dr New Port Richey, FL | 4.0 | 2.0 | 1433 | $2,085 | $1.45 | 24d | 1 | 1.17mi |
| 7441 Carmel Ave New Port Richey, FL | 3.0 | 1.0 | 1238 | $1,875 | $1.51 | 2d | 1 | 1.18mi |
| 3427 Dellefield St New Port Richey, FL | 4.0 | 2.0 | 1529 | $2,280 | $1.49 | 20d | 1 | 1.18mi |
| 7239 Belvedere Ter New Port Richey, FL | 4.0 | 2.0 | 1200 | $2,800 | $2.33 | 17d | 1 | 1.30mi |
Listing history 20 events
-
2026-06-07days on market $5,000 Active 10 DOM
-
2026-06-04days on market $5,000 Active 7 DOM
-
2026-06-03days on market $5,000 Active 6 DOM
-
2026-06-02days on market $5,000 Active 5 DOM
-
2026-06-01days on market $5,000 Active 4 DOM
-
2026-05-31days on market $5,000 Active 3 DOM
-
2026-05-28$5,000 Active
-
2022-04-05soldstatus $369,963
-
2022-04-01soldstatus $369,963 Closed 530-char remark
Show marketing remark (530 chars)
4/2/2 1709 SqFt. Classic front Covered Porch. Fab Kitchen w/ 42' Cabinets, Great front Den/Study or 4th Bedroom w/ California built in Bookcase and Work Station. Master Suite w/ separate Garden Tub and Shower, His & Her sinks, Large Walk in Closet. Gated Community. Covered rear Lanai. LOW HOA dues, NO CDD fees, and NO FLOOD ZONE! Located in Trinity West a private Gated Community. Zoned for top rated schools, Trinity Oaks Elementary, Seven Springs middle, and Mitchell High. Property is occupied. New AC System Feb 2017
-
2022-02-05status Pending 530-char remark
Show marketing remark (530 chars)
4/2/2 1709 SqFt. Classic front Covered Porch. Fab Kitchen w/ 42' Cabinets, Great front Den/Study or 4th Bedroom w/ California built in Bookcase and Work Station. Master Suite w/ separate Garden Tub and Shower, His & Her sinks, Large Walk in Closet. Gated Community. Covered rear Lanai. LOW HOA dues, NO CDD fees, and NO FLOOD ZONE! Located in Trinity West a private Gated Community. Zoned for top rated schools, Trinity Oaks Elementary, Seven Springs middle, and Mitchell High. Property is occupied. New AC System Feb 2017
-
2022-02-01$369,963 Active 530-char remark
Show marketing remark (530 chars)
4/2/2 1709 SqFt. Classic front Covered Porch. Fab Kitchen w/ 42' Cabinets, Great front Den/Study or 4th Bedroom w/ California built in Bookcase and Work Station. Master Suite w/ separate Garden Tub and Shower, His & Her sinks, Large Walk in Closet. Gated Community. Covered rear Lanai. LOW HOA dues, NO CDD fees, and NO FLOOD ZONE! Located in Trinity West a private Gated Community. Zoned for top rated schools, Trinity Oaks Elementary, Seven Springs middle, and Mitchell High. Property is occupied. New AC System Feb 2017
-
2021-04-30historical 366-char remark
Show marketing remark (366 chars)
4/2/2 Fresh Paint and Brand New Carpet. Classic front Covered Porch. Fab Kitchen w/ 42' Cabinets, Bisk Sink w/ matching appliances. Great front Den/Study or 4th Bedroom w/ California built in Bookcase and Work Station. Master Suite w/ separate Garden Tub and Shower, His & Her sinks, Large Walk in Closet. Gated Community. Covered rear Lanai. SEE VIRTUAL TOUR
-
2018-03-10historical
-
2018-02-22status Active
-
2018-02-11historical
-
2018-01-24price $234,432
-
2018-01-10$239,932 Active
-
2012-01-03$179,000 366-char remark
Show marketing remark (366 chars)
4/2/2 Fresh Paint and Brand New Carpet. Classic front Covered Porch. Fab Kitchen w/ 42' Cabinets, Bisk Sink w/ matching appliances. Great front Den/Study or 4th Bedroom w/ California built in Bookcase and Work Station. Master Suite w/ separate Garden Tub and Shower, His & Her sinks, Large Walk in Closet. Gated Community. Covered rear Lanai. SEE VIRTUAL TOUR
-
2004-01-24$199,990
-
2003-07-02soldstatus $215,400
ⓘ Source: listings_history table (triggers on properties + properties_extension) + one-shot
backfill from property_details.listing_events for pre-trigger history.
Climate risk First Street
- Flood 1/10 Low FEMA zone X (unshaded) · 0% chance over 30 yrs
- Wildfire 3/10 Moderate
- Heat 10/10 Extreme 8 d/yr ≥108°F today · 30 d/yr by 30 yrs out
- Wind 10/10 Extreme 99% chance of damaging wind over 30 yrs
- Air quality 2/10 Low 1 unhealthy d/yr today · 1 by 30 yrs out
Nearby sold comps map
Loading sold comps map…
Walkable amenities ~0.75 mi
Loading nearby amenities…
Taxation est. · year 1
- Rental income
- $27,896
- − Mortgage interest
- −$280
- − Property taxes
- −$75
- − Insurance
- −$25
- − Repairs & maintenance
- −$2,232
- − Management
- −$2,232
- − Depreciation
- −$145
- Taxable income
- $22,907
- Est. tax owed @ 24.0%
- −$5,498
- After-tax cash flow
- $16,126/yr
For passive investors: Depreciation is non-cash, so a rental often shows a tax loss while cash-flowing — sheltering income. Rental losses are passive: they offset passive income freely, and up to $25,000/yr can offset ordinary (W-2) income if you actively participate and your MAGI is under $100k (phasing out to $0 by $150k); unused losses carry forward. On sale, claimed depreciation is recaptured at up to 25%, and gains may owe capital-gains tax (a 1031 exchange can defer both). Figures are a year-1 estimate at your 24.0% rate — not tax advice; consult a CPA.
Schools (NCES district)
- District
- Pasco
- NCES district ID
- 1201530
- Math proficiency
- 50% ▼ -10.00%
- Reading proficiency
- 52% ▼ -5.00%
- Median HH income
- $45,039
- Composite
- 43.14/100
- National rank
- #3074
- State rank
- #32 of 73 in FL
Livability — Trinity
- Score
- 78/100
- State rank
- #156
- US rank
- #2369
Category grades
Schools grade is shown separately in the Schools card above.
Census & demographics
- County
- Pasco County · 524,098 people
- Metro
- Tampa-St. Petersburg-Clearwater, FL
- Population (ZIP)
- 49,964
- Household income
- $85,470
- Rent vs Own
- Severe rent burden
- 1372.0
Population outlook (Pasco County) Hauer SSP2
- Today (2025)
- 570,045 people
- By 2030
- 605,844 · +6.3%
- By 2040
- 674,806 · +18.4%
- By 2050
- 736,022 · +29.1%
- By 2075
- 862,900 · +51.4%
- By 2100
- 906,364 · +59.0%
Race, ethnicity, and origin ACS 2023
- Neighborhood character
- Predominantly White (83%)
- Race & ethnicity
- White 83% Hispanic / Latino 9% Two or more races 7% Asian 2% Black 2%
- Hispanic origin (detail)
- Mexican 1% Puerto Rican 2% Cuban 2%
- Common ancestry
- Romanian 4% Lithuanian 2% Slovak 2%
- Foreign-born
- 12% · Canada, Vietnam, Jamaica
- Languages at home
- 87% English-only · Spanish 6% Arabic 2% Other Indo-European 2%
Political lean MEDSL · Pasco
- 2024 margin
- Strong R (+25.2) · D 36.9% · R 62.1% · Other 1.0%
- 2008→2024 swing
- -21.6pp toward R · 2008: -3.6pp · 2024: -25.2pp
- All cycles
- 2024: R+25.2 2020: R+20.1 2016: R+21.6 2012: R+6.7 2008: R+3.6
Not yet ingested
- Civics
- —
Market trends
- HPI YoY
- ▼ -82.58%
- Current HPI
- 278.3649
- Rent YoY
- ▼ -4.70%
- Metro
- Tampa-St. Petersburg-Clearwater, FL
- State GDP YoY
- ▲ 3.28%
- F500 in state
- 36
Industry mix (Fortune 500 HQ in FL)
| Industry | F500 HQs | Revenue |
|---|---|---|
| Industrial Technology | 2 | $29B |
|
||
| Insurance | 2 | $17B |
|
||
| Retail | 1 | $60B |
|
||
| Technology Distribution | 1 | $58B |
|
||
| Homebuilding | 1 | $35B |
|
||
| Technology Manufacturing | 1 | $35B |
|
||
Price history
-97.7% since first listed14 events — show timeline
- 2026-05-28 Listed $5,000 HAOR as distributed by MLS GRID
- 2022-04-05 Sold (Public Records) $369,963 Public Records
- 2022-04-01 Sold (MLS) $369,963 Stellar MLS as Distributed by MLS Grid
- 2022-02-05 Pending — Stellar MLS as Distributed by MLS Grid
- 2022-02-01 Listed $369,963 Stellar MLS as Distributed by MLS Grid
- 2021-04-30 Listing Removed — Stellar MLS as Distributed by MLS Grid
- 2018-03-10 Listing Removed — Stellar MLS as Distributed by MLS Grid
- 2018-02-22 Relisted — Stellar MLS as Distributed by MLS Grid
- 2018-02-11 Listing Removed — Stellar MLS as Distributed by MLS Grid
- 2018-01-24 Price Changed $234,432 Stellar MLS as Distributed by MLS Grid
- 2018-01-10 Listed $239,932 Stellar MLS as Distributed by MLS Grid
- 2012-01-03 Listed $179,000 Stellar MLS as Distributed by MLS Grid
- 2004-01-24 Listed $199,990 Stellar MLS as Distributed by MLS Grid
- 2003-07-02 Sold (Public Records) $215,400 Public Records
Property tax history
+10.3%/yrLatest (2025): $5,465 · -2.9% YoY. Source: county tax records.
Cash-flow waterfall
monthlySold comps — $/sqft
last 12 mo · ≤1 miLoading sold comps…