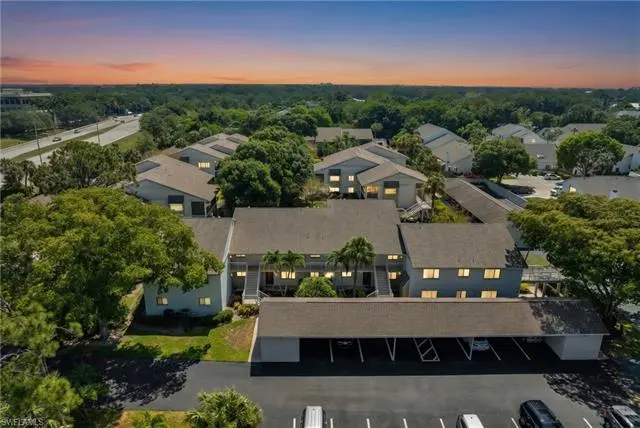
910 Vanderbilt Beach Rd #315 · Pine Ridge, FL
Flood risk 5/10 · Moderate
- FEMA flood zone
- X (shaded)
- Chance of flooding over 30 yrs
- 0.24%
- Est. flood insurance / yr
- $507 – $1,088
Fire risk 1/10 · Minimal
- Est. fire insurance / yr
- $947 – $1,759
Heat risk 10/10 · Severe
- Hot days now (above 107°F)
- 7 days/yr
- Hot days in 30 yrs
- 31 days/yr
Wind risk 10/10 · Severe
- Chance of severe wind over 30 yrs
- 99.0%
Air-quality risk 2/10 · Minimal
- Unhealthy air days now
- 2 days/yr
- Unhealthy air days in 30 yrs
- 2 days/yr
Risk factors via First Street. Map © Google.
Why this score? — see what drove the B grade
The composite is a weighted blend of 9 inputs, each scored 0–100. Each bar is that input's sub-score; the figure is the points it added to the 100-point composite (weight × sub-score).
- Cash flow +30.0/30.0
- 1% rule +10.0/10.0
- DSCR +10.0/10.0
- ARV discount +7.5/15.0
- Schools +5.0/10.0
- Rent growth +4.7/5.0
- Livability +3.4/5.0
- Condition / age +2.5/5.0
- Appreciation +0.0/10.0
$339,000
🖨 Deal sheet (PDF) 📄 Offer letter ✓ Due diligence
Listing remarks MLS
LOCATION, LOCATION, LOCATION! WALK TO RESTAURANTS, SHOPS, SILVER SPOT CINEMA, WALGREENS, OR TAKE A SHORT DRIVE TO VANDERBILT BEACH. THIS IS AN IDEAL PROPERTY FOR INVESTORS OR SOMEONE WHO IS HANDY ENOUGH TO REMODEL THE UNIT TO THEIR PERSONAL TASTE. THIS FIRST FLOOR CONDOMINIUM HAS A LARGE, GLASS ENCLOSED LANAI. UNIT OWNERS HAVE A ONE VEHICLE CARPORT AND THERE ARE PLENTY OF GUEST PARKING SPACES. THERE IS ADDITIONAL OUTSIDE STORAGE, WHICH IS A PLUS FOR CONDO LIVING. THIS COMMUNITY IS WELL CARED FOR AND HAS A DESIGNATED VEHICLE WASH AREA. THIS UNIT IS ONLY A SHORT WALK TO THE COMMUNITY POOL. THE LOCATION OFFERS SO MUCH WITH REGARD TO CONVENIENCES. THIS UNIT IS PRICED TO SELL!
Key facts
- Screened lanai
- Large walk-in closet
- Huge patio space
Tags
Property features AI
Finance
- Other: Unit is one of 6 units in the building and one of 40 units in the complex; Single-floor unit
- HOA & community: Mandatory HOA; Quarterly master HOA fee; Professional management; Community pool; Vehicle wash area; Non-gated community; HOA covers insurance, irrigation water, lawn/land maintenance, legal/accounting, manager, exterior pest control, repairs, reserve, security, sewer, street lights, street maintenance, trash removal and water
Exterior
- Parking: Detached 1-car carport
- Utilities: Central water; Central sewer; Cable available
- Home design: Residential property; Low-rise building (1-3 stories); Rear exposure facing east; Located in the Pine Ridge development
- Construction: Concrete block construction; Stucco exterior; Shingle roof; Built in 1981
- Exterior features: Courtyard; Patio
Interior
- Kitchen: Cooktop (electric); Dishwasher; Microwave; Refrigerator/Freezer
- Bedrooms: 2 bedrooms plus den
- Flooring: Tile
- Bathrooms: 2 full bathrooms; Master bathroom with shower only
- Heating & cooling: Central electric heating; Central electric cooling
- Interior features: Cable prewire; Smoke detectors; Walk-in closet; Split bedroom floor plan; Eat-in kitchen; Florida room; Glass porch; Screened lanai/porch; Laundry in residence; Unfurnished
- Laundry & utility: Washer; Dryer
Neighborhood map
What this means for you Summary
Snapshot
- This is a 2-bed/2.0-bath condo listed at $339k.
Deal economics
- At list price, monthly cash flow is $1k ($15k/yr) — positive.
- The deal already cash-flows at list — no discount required.
- Meets the 1% rule at list price ($5k rent vs $339k).
- Recommended offer: $329k (3.0% below list) — sets the bar for market timing.
- Cap rate 10.8% vs local median 3.4% in Pine Ridge — top-decile yield for the area; either an underpriced asset or a hidden risk that comps aren't pricing in. Stress-test before assuming the spread holds.
Location & tenants
- Location reads 67/100 on livability (#565 in FL) — a middle-class / working-renter tenant base. Strengths: crime A+, housing A+, cost of living A-; Watch: health & safety C-, amenities F, commute F.
- Collier (suburban): math 60% / reading 56% proficiency, ranked #16 of 73 in FL (top 22%) — acceptable for families but not a draw, mixed tenant base, ~2y average lease.
- Zoned schools: Sea Gate Elementary School (math 86% / reading 81%, grade A+, #60 of 2,144 statewide, top 3%, 703 students, 26% FRL); Pine Ridge Middle School (math 74% / reading 70%, grade A, #52 of 571 statewide, top 10%, 832 students, 31% FRL); Barron Collier High School (math 62% / reading 68%, grade B, #76 of 667 statewide, top 11%, 1,650 students, 26% FRL) — zoned schools average 27% FRL vs 55% district-wide (28 pts lower); this property's tenant base skews higher-income than the district average.
- Zoned-school proficiency averages 74% at this address vs 58% district-wide (+16 pts) — the actual schools serving this property are materially stronger than the Collier average implies; a family-tenant draw the district grade alone would hide.
- Market conditions: Rents rising fast (+8.7%/yr); 684 active listings in the ZIP; 40 comparable units currently listed for rent nearby; rentals at typical pace (median 25d on market — plan ~3-4 weeks tenant-placement turnaround); high-income renter base; 3,520 units permitted in Collier County in 2024 (959 in 5+ unit buildings).
Forward outlook
- Local home prices are declining (-3.0%/yr); year-one equity from $2k of loan paydown is wiped out by about $10k of value loss. Plan a longer hold.
- Collier County population projected at +30% by 2050 — long-run rental-demand tailwind backs the buy-and-hold thesis.
- At projected returns (-3.0% appreciation + 8.0% rent growth), your $95k cash investment doubles in ~6 years — after that, you're playing with house money.
Negotiation context
- It's been on market 31 days — a 3% lower offer ($329k) is reasonable based on typical stale-listing flexibility.
- 4 sale attempts since 5y ago with the ask held roughly flat each time — persistent listings suggest the price (not the market) is what's stuck; bring a comps-based counter.
- Current owner paid $240k; 41% above their basis — modest negotiation headroom, anchor on the comps not their cost.
Risks & watch-outs
- Climate carrying-cost: moderate flood risk; severe wind risk, 99% chance of damaging wind over 30y; extreme-heat days projected 7→31/yr by 2055 (HVAC capex compounding) — expect insurance premiums to compound above CPI over the hold.
Questions for the listing agent
- It's been on market 31 days. Have you received any prior offers? Is the seller open to a 3% concession, seller financing, or rate buy-down credit?
- What does the HOA fee cover, when was the last increase, and are there any pending special assessments or reserve-fund shortfalls?
- Any open or pending special assessments — roof, HVAC, plumbing, elevator, façade? What's the per-unit balance and payoff schedule, and is the seller paying it off at close or rolling it to the buyer?
- Is there a deadline driving the sale (1031 exchange, divorce, estate, relocation)? That informs how much negotiation room exists.
- Schools are F-rated, which usually means shorter tenancies and higher turnover. Who's the typical renter profile here, and what's been the actual vacancy rate?
- What's the average days-on-market for RENTAL listings here right now (not sales)? A rising rental-DOM trend means longer vacancies and softer asking-rent achievability than the comps imply.
- What's the recent tenant-quality profile in this submarket — average credit score on applications, eviction rate, late-payment / NSF rate, and stable-employment percentage? A property-management company in the area should have these aggregated.
- How much new apartment / multifamily construction is in the pipeline within 1–3 miles? Heavy new supply (>2% of stock underway) typically softens rents 12–24 months out; light construction supports rent growth.
Investment metrics
- 1% rule
- 1.51% ✓
- Cap rate
- 10.83%
- Cash-on-cash
- 16.21%
- DSCR
- 1.72
- GRM
- 5.5
CMA / ARV
No comps found within radius.
Projected returns pro-forma
-3.0% appreciation · 8.0% rent growth · sell at horizon
- IRR
- 13.4%
- Equity multiple
- 1.57×
- Total profit
- $54,188
- Equity at exit
- $50,546
- IRR
- 26.2%
- Equity multiple
- 3.92×
- Total profit
- $277,153
- Equity at exit
- $29,311
Cash invested: $94,920 (down + closing). Projections, not guarantees.
Landlord ↔ Tenant lean methodology
- Overall (STATE)
- 87 Strongly Landlord-Friendly
- State Florida
- 87 Strongly Landlord-Friendly · R+3
- County
- — inherits STATE
- City
- — inherits STATE
ZIP-level market 34108
- Rents YoY
- 8.7%
- Active inventory
- 684
- Price-to-rent
- 5.5×
Monthly cashflow live
- Estimated rent
- $5,132 medium interval (Pro) →
- Mortgage (P&I)
- −$1,778
- Tax from tax record
- −$235 /mo · $2,817/yr
- Insurance
- −$141
- HOA
- −$618
- Vacancy / Maint / Mgmt
- −$1,078
- Net cashflow
- $1,282
Break-even live
Sensitivity live
| Price | -10% $1,474 | -5% $1,378 | +0% $1,282 | +5% $1,186 | +10% $1,090 |
|---|---|---|---|---|---|
| Rent | -10% $877 | -5% $1,079 | +0% $1,282 | +5% $1,485 | +10% $1,688 |
| Rate | -1.0pp $1,453 | -0.5pp $1,368 | base $1,282 | +0.5pp $1,194 | +1.0pp $1,105 |
UW: 25.0% down · 7.5% · 30yr · 1.5% tax · 5.0% vac · 8.0% maint · 8.0% mgmt
Financing live
Cash to close
- Down payment
- $84,750
- Closing costs
- $10,170
- Reserves months
- —
- Total cash needed
- —
Loan-product check · same deal, 3 products live
Conventional
25% down · 7.5% · 30yr
- Down + closing
- —
- Monthly P&I
- —
- Monthly cashflow
- —
- DSCR
- —
- Eligible?
- —
Personal DTI + credit; lowest rate.
DSCR
20% down · 8.5% · 30yr
- Down + closing
- —
- Monthly P&I
- —
- Monthly cashflow
- —
- DSCR
- —
- Eligible?
- —
No personal income docs; deal must DSCR.
Hard money
10% down · 12.0% · 12mo
- Down + closing
- —
- Monthly P&I
- —
- Monthly cashflow
- —
- DSCR
- —
- Eligible?
- —
Short-term bridge; refi at stabilization.
Rent comps 40 comps
| Address | Beds | Baths | Sqft | Rent | $/sqft | DOM | Units | Dist |
|---|---|---|---|---|---|---|---|---|
| 878 Meadowland Dr Unit G Naples, FL | 2.0 | 2.0 | 1282 | $2,500 | $1.95 | 15d | 1 | 0.06mi |
| 878 Meadowland Dr Unit B Naples, FL | 3.0 | 2.5 | 1784 | $3,200 | $1.79 | 15d | 1 | 0.06mi |
| 878 Meadowland Dr Unit 4 Naples, FL | 2.0 | 2.0 | 1459 | $6,500 | $4.46 | 15d | 1 | 0.06mi |
| 840 Meadowland Dr Unit H Naples, FL | 3.0 | 2.5 | 1748 | $6,900 | $3.95 | 25d | 1 | 0.09mi |
| 840 Meadowland Dr Unit H Naples, FL | 3.0 | 2.5 | 1748 | $6,900 | $3.95 | 15d | 1 | 0.11mi |
| 833 Meadowland Dr Unit 14-3 Naples, FL | 2.0 | 2.5 | 1360 | $5,500 | $4.04 | 15d | 1 | 0.14mi |
| 820 Meadowland Dr Unit D Naples, FL | 2.0 | 2.5 | 1432 | $5,500 | $3.84 | 15d | 1 | 0.17mi |
| 823 Meadowland Dr Unit 41-2 Naples, FL | 3.0 | 2.5 | 1784 | $9,000 | $5.04 | 15d | 1 | 0.18mi |
| 823 Meadowland Dr Unit H Naples, FL | 3.0 | 2.5 | 1744 | $6,500 | $3.73 | 15d | 1 | 0.18mi |
| 9123 Strada Pl Naples, FL | 1.0–2.0 | 1.0–2.0 | 1267 | $14,000 | $11.05 | 15d | 6 | 0.25mi |
| 9115 Strada Pl Naples, FL | 1.0–2.0 | 1.5–2.0 | 1489 | $13,000 | $8.73 | 25d | 4 | 0.25mi |
| 800 Meadowland Dr Unit N Naples, FL | 2.0 | 2.5 | 1432 | $5,500 | $3.84 | 22d | 1 | 0.26mi |
| 800 Meadowland Dr Unit H Naples, FL | 2.0 | 2.5 | 1432 | $2,700 | $1.89 | 15d | 1 | 0.26mi |
| 790 Meadowland Dr Unit 29-2 Naples, FL | 2.0 | 2.5 | 1432 | $6,000 | $4.19 | 15d | 1 | 0.27mi |
| 81 Emerald Woods Dr Unit M8 Naples, FL | 2.0 | 2.0 | 1133 | $4,200 | $3.71 | 25d | 1 | 0.28mi |
| 81 Emerald Woods Dr Unit M8 Naples, FL | 2.0 | 2.0 | 1133 | $4,200 | $3.71 | 15d | 1 | 0.28mi |
| 800 L Ambiance Cir #106 Naples, FL | 3.0 | 2.0 | 1620 | $8,500 | $5.25 | 15d | 1 | 0.34mi |
| 881 Gulf Pavilion Dr #201 Naples, FL | 2.0 | 2.0 | 1516 | $7,500 | $4.95 | 25d | 1 | 0.35mi |
| 1033 Egrets Walk Cir Unit 6-101 Naples, FL | 3.0 | 2.0 | 1584 | $2,200 | $1.39 | 25d | 1 | 0.37mi |
| 400 L Ambiance Cir #104 Naples, FL | 2.0 | 2.0 | 1349 | $6,500 | $4.82 | 15d | 1 | 0.39mi |
| 400 L Ambiance Cir #204 Naples, FL | 2.0 | 2.0 | 1693 | $10,000 | $5.91 | 15d | 1 | 0.39mi |
| 500 Lambiance Cir Unit 5-104 Naples, FL | 2.0 | 2.0 | 1349 | $8,000 | $5.93 | 25d | 1 | 0.40mi |
| 65 Emerald Woods Dr Unit E8 Naples, FL | 2.0 | 2.5 | 1360 | $2,400 | $1.76 | 25d | 1 | 0.40mi |
| 61 Emerald Woods Dr Unit D2 Naples, FL | 2.0 | 2.5 | 1360 | $3,200 | $2.35 | 25d | 1 | 0.40mi |
| 840 Gulf Pavilion Dr #103 Naples, FL | 2.0 | 2.0 | 1179 | $5,500 | $4.66 | 25d | 1 | 0.40mi |
| 200 L Ambiance Cir #101 Naples, FL | 2.0 | 2.0 | 1395 | $8,500 | $6.09 | 15d | 1 | 0.40mi |
| 322 Sugar Pine Ln #322 Naples, FL | 2.0 | 2.0 | 1311 | $2,350 | $1.79 | 25d | 1 | 0.43mi |
| 834 Gulf Pavilion Dr #204 Naples, FL | 2.0 | 2.0 | 1516 | $8,000 | $5.28 | 25d | 1 | 0.43mi |
| 834 Gulf Pavilion Dr #204 Naples, FL | 2.0 | 2.0 | 1516 | $5,000 | $3.30 | 22d | 1 | 0.43mi |
| 100 Lambiance Cir Unit 1-101 Naples, FL | 2.0 | 2.0 | 1389 | $8,800 | $6.34 | 25d | 1 | 0.43mi |
| 7087 Barrington Cir #201 Naples, FL | 3.0 | 2.0 | 1663 | $6,500 | $3.91 | 25d | 1 | 0.44mi |
| 1051 Egrets Walk Cir Unit 7-201 Naples, FL | 3.0 | 2.0 | 1800 | $8,500 | $4.72 | 25d | 1 | 0.44mi |
| 1051 Egrets Walk Cir Unit 7-102 Naples, FL | 2.0 | 2.0 | 1696 | $7,250 | $4.27 | 25d | 1 | 0.44mi |
| 7095 Barrington Cir Unit 6-102 Naples, FL | 3.0 | 2.0 | 1521 | $11,500 | $7.56 | 25d | 1 | 0.47mi |
| 822 Gulf Pavilion Dr #202 Naples, FL | 2.0 | 2.0 | 1275 | $6,500 | $5.10 | 25d | 1 | 0.48mi |
| 815 Gulf Pavilion Dr #203 Naples, FL | 2.0 | 2.0 | 1179 | $3,500 | $2.97 | 25d | 1 | 0.48mi |
| 1061 Egrets Walk Cir #201 Naples, FL | 3.0 | 2.0 | 1800 | $8,500 | $4.72 | 25d | 1 | 0.48mi |
| 1190 Egrets Walk Cir #103 Naples, FL | 3.0 | 2.0 | 1507 | $8,000 | $5.31 | 25d | 1 | 0.48mi |
| 1265 Egrets Lndg #201 Naples, FL | 2.0 | 2.0 | 1800 | $7,500 | $4.17 | 25d | 1 | 0.48mi |
| 1265 Egrets Lndg #101 Naples, FL | 2.0 | 2.0 | 1584 | $3,100 | $1.96 | 25d | 1 | 0.48mi |
HOA detail condo
- Monthly dues
- $618 · $7,416/yr
- Likely covers
- pool
- Assessments
- None detected in remarks — confirm with the listing agent.
Listing history 15 events
-
2026-06-21days on market $339,000 Active 31 DOM
-
2026-06-18days on market $339,000 Active 28 DOM
-
2026-06-17days on market $339,000 Active 27 DOM
-
2026-06-16days on market $339,000 Active 26 DOM
-
2026-06-15days on market $339,000 Active 25 DOM
-
2026-06-14days on market $339,000 Active 23 DOM
-
2026-06-10days on market $339,000 Active 20 DOM
-
2026-06-09days on market $339,000 Active 19 DOM
-
2026-06-08days on market $339,000 Active 18 DOM
-
2026-06-07days on market $339,000 Active 17 DOM
-
2026-06-03days on market $339,000 Active 13 DOM
-
2026-06-02days on market $339,000 Active 12 DOM
-
2026-06-01days on market $339,000 Active 11 DOM
-
2026-05-31remarks 699-char remark
-
2026-05-31$339,000 Active 10 DOM
ⓘ Source: listings_history table (triggers on properties + properties_extension) + one-shot
backfill from property_details.listing_events for pre-trigger history.
Tax reassessment forecast FL · Resets to sale price
- Current annual tax
- $2,817 · $235/mo
- Projected year-2 tax
- $2,817 · $235/mo
- Expected delta
- $0/yr ($0/mo · -0.0%)
ⓘ Screening estimate from a state-policy table — verify with the county assessor before closing.
Climate risk First Street
- Flood 5/10 Major FEMA zone X (shaded) · 24% chance over 30 yrs
- Wildfire 1/10 Low
- Heat 10/10 Extreme 7 d/yr ≥107°F today · 31 d/yr by 30 yrs out
- Wind 10/10 Extreme 99% chance of damaging wind over 30 yrs
- Air quality 2/10 Low 2 unhealthy d/yr today · 2 by 30 yrs out
Nearby sold comps map
Loading sold comps map…
Walkable amenities ~0.75 mi
Loading nearby amenities…
Taxation est. · year 1
- Rental income
- $61,579
- − Mortgage interest
- −$18,989
- − Property taxes
- −$2,817
- − Insurance
- −$1,695
- − Repairs & maintenance
- −$4,926
- − Management
- −$4,926
- − HOA
- −$7,416
- − Depreciation
- −$9,862
- Taxable income
- $10,947
- Est. tax owed @ 24.0%
- −$2,627
- After-tax cash flow
- $12,759/yr
For passive investors: Depreciation is non-cash, so a rental often shows a tax loss while cash-flowing — sheltering income. Rental losses are passive: they offset passive income freely, and up to $25,000/yr can offset ordinary (W-2) income if you actively participate and your MAGI is under $100k (phasing out to $0 by $150k); unused losses carry forward. On sale, claimed depreciation is recaptured at up to 25%, and gains may owe capital-gains tax (a 1031 exchange can defer both). Figures are a year-1 estimate at your 24.0% rate — not tax advice; consult a CPA.
Schools (NCES district)
- District
- Collier
- NCES district ID
- 1200330
- Math proficiency
- 60% ▼ -4.00%
- Reading proficiency
- 56% ▼ -2.00%
- Median HH income
- $58,275
- Composite
- 50.23/100
- National rank
- #1892
- State rank
- #16 of 73 in FL
Livability — Pine Ridge
- Score
- 67/100
- State rank
- #565
- US rank
- #10798
Category grades
Schools grade is shown separately in the Schools card above.
Census & demographics
- Census place
- Pine Ridge, FL
- County
- Collier County · 396,295 people
- City population
- 18,514
- Metro
- Naples-Marco Island, FL
- Population (ZIP)
- 16,237
- Household income
- $119,212
- Rent vs Own
- Severe rent burden
- 237.0
Population outlook (Collier County) Hauer SSP2
- Today (2025)
- 420,858 people
- By 2030
- 450,054 · +6.9%
- By 2040
- 502,232 · +19.3%
- By 2050
- 544,932 · +29.5%
- By 2075
- 627,203 · +49.0%
- By 2100
- 659,015 · +56.6%
Race, ethnicity, and origin ACS 2023
- Neighborhood character
- Predominantly White (87%)
- Race & ethnicity
- White 87% Hispanic / Latino 8% Two or more races 7% Asian 1% Black 1%
- Hispanic origin (detail)
- Mexican 2% Cuban 3%
- Common ancestry
- Romanian 5% Lithuanian 3% Slovak 3%
- Foreign-born
- 16% · Canada, Dominican Republic, South Korea
- Languages at home
- 86% English-only · Spanish 6% Russian/Polish/Slavic 2% Other Indo-European 2%
Political lean MEDSL · Collier
- 2024 margin
- Solid R (+33.1) · D 33.1% · R 66.2%
- 2008→2024 swing
- -10.6pp toward R · 2008: -22.5pp · 2024: -33.1pp
- All cycles
- 2024: R+33.1 2020: R+24.7 2016: R+26.0 2012: R+30.1 2008: R+22.5
Not yet ingested
- Civics
- —
Market trends
- HPI YoY
- ▼ -587.97%
- Current HPI
- 275.1872
- Rent YoY
- ▲ 8.74%
- Metro
- Naples-Marco Island, FL
- State GDP YoY
- ▲ 3.28%
- F500 in state
- 36
Industry mix (Fortune 500 HQ in FL)
| Industry | F500 HQs | Revenue |
|---|---|---|
| Industrial Technology | 2 | $29B |
|
||
| Insurance | 2 | $17B |
|
||
| Retail | 1 | $60B |
|
||
| Technology Distribution | 1 | $58B |
|
||
| Homebuilding | 1 | $35B |
|
||
| Technology Manufacturing | 1 | $35B |
|
||
Price history
+298.8% since first listed11 events — show timeline
- 2026-05-21 Listed $339,000 NAPLESMLS
- 2021-05-10 Sold (Public Records) $240,000 Public Records
- 2021-05-04 Sold (MLS) $240,000 NAPLESMLS
- 2021-03-25 Pending — NAPLESMLS
- 2021-03-15 Relisted — NAPLESMLS
- 2021-03-07 Pending — NAPLESMLS
- 2021-02-25 Relisted — NAPLESMLS
- 2021-02-13 Pending — NAPLESMLS
- 2021-02-02 Listed $244,900 NAPLESMLS
- 1997-04-04 Sold (Public Records) $70,000 Public Records
- 1989-03-01 Sold (Public Records) $85,000 Public Records
Property tax history
+7.3%/yrLatest (2025): $2,817 · -5.5% YoY. Source: county tax records.
Cash-flow waterfall
monthlySold comps — $/sqft
last 12 mo · ≤1 miLoading sold comps…