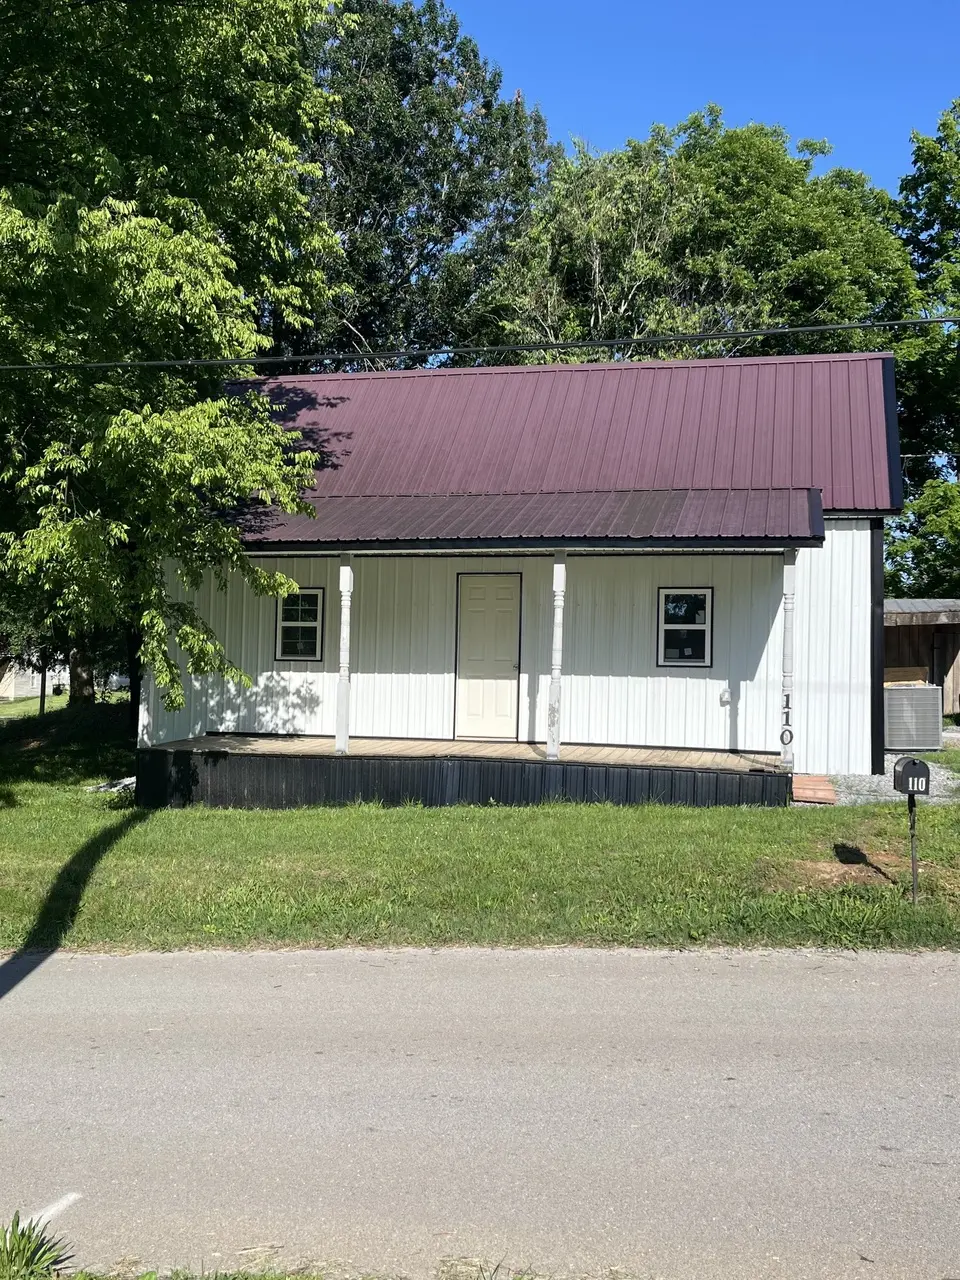
110 N Commerce St · Adams, TN
Flood risk 1/10 · Minimal
- FEMA flood zone
- X (unshaded)
- Chance of flooding over 30 yrs
- 0.0%
- Est. flood insurance / yr
- $507 – $1,088
Fire risk 1/10 · Minimal
- Est. fire insurance / yr
- $949 – $1,763
Heat risk 5/10 · Moderate
- Hot days now (above 107°F)
- 7 days/yr
- Hot days in 30 yrs
- 19 days/yr
Wind risk 4/10 · Minor
- Chance of severe wind over 30 yrs
- 10.0%
Air-quality risk 2/10 · Minimal
- Unhealthy air days now
- 0 days/yr
- Unhealthy air days in 30 yrs
- 1 days/yr
Risk factors via First Street. Map © Google.
Why this score? — see what drove the C- grade
The composite is a weighted blend of 9 inputs, each scored 0–100. Each bar is that input's sub-score; the figure is the points it added to the 100-point composite (weight × sub-score).
- Cash flow +24.2/30.0
- DSCR +7.8/10.0
- ARV discount +7.5/15.0
- 1% rule +5.0/10.0
- Livability +3.0/5.0
- Rent growth +2.5/5.0
- Condition / age +2.5/5.0
- Schools +2.2/10.0
- Appreciation +0.0/10.0
$180,000
🖨 Deal sheet (PDF) 📄 Offer letter ✓ Due diligence
Listing remarks
Charming Country Cottage and adjacent lot in the Heart of Adams, Tennessee! Welcome to this delightful 2-bedroom, 1-bath cottage nestled in the center of historic Adams, TN. Offering small-town charm and everyday convenience, this cozy home is within walking distance of local amenities, community events, and the unique attractions that make Adams such a special place to call home. Inside, you’ll find comfortable living spaces filled with warmth and character, while outside a convenient storage shed provides extra room for tools, hobbies, or seasonal items. The manageable lots offer nearly a half acre, making this property ideal for first-time homebuyers, downsizers, investors, or a
Key facts
- Manageable lot
- 0.23 acre lot
- 2 parking spots
Tags
Property features AI
Exterior
- Parking: Two open gravel parking spaces
- Utilities: Public water; Septic tank
- Home design: Single-family residence; One story; Renovated
- Construction: Aluminum siding; Metal roof
- Exterior features: Lot about 0.23 acres (approx. 71 x 144 irregular); Water available
Interior
- Kitchen: Kitchen approximately 13 x 13
- Bedrooms: Two bedrooms (both on the main level); Bedroom sizes approximately 13 x 12 and 13 x 9
- Flooring: Laminate
- Bathrooms: One full bathroom
- Heating & cooling: Central heating; Central air
- Interior features: Washer and dryer included; Laminate flooring; Central heating; Central air conditioning
- Laundry & utility: Washer hookup; Electric dryer hookup
Neighborhood map
What this means for you Summary
Snapshot
- This is a 2-bed/1.0-bath single-family listed at $180k.
Deal economics
- At list price, monthly cash flow is $361 ($4k/yr) — positive.
- The deal already cash-flows at list — no discount required.
- Meets the 1% rule at list price ($2k rent vs $180k).
- Recommended offer: $177k (1.5% below list) — sets the bar for market timing.
Location & tenants
- Location reads 59/100 on livability (#297 in TN) — a working-class tenant base; expect higher turnover. Strengths: cost of living A+, housing A+; Watch: crime F, amenities F, commute F.
- Robertson County (rural): math 22% / reading 26% proficiency, ranked #82 of 139 in TN (top 59%) — low school quality limits family demand, transient renter base, plan for 1-2y turnover.
- Zoned schools: Jo Byrns Elementary School (math 37% / reading 37%, grade F, #272 of 952 statewide, top 31%, 363 students, 0% FRL); Jo Byrns High School (math 12% / reading 17%, grade F, #250 of 332 statewide, top 76%, 559 students, 0% FRL) — zoned schools average 0% FRL vs 42% district-wide (42 pts lower); this property's tenant base skews higher-income than the district average.
- Market conditions: 40 active listings in the ZIP; 983 units permitted in Robertson County in 2024 (0 in 5+ unit buildings).
Forward outlook
- Local home prices are declining (-3.0%/yr); year-one equity from $1k of loan paydown is wiped out by about $5k of value loss. Plan a longer hold.
- Robertson County population projected at +7% by 2050 — modest demand growth; plan on rents tracking national, not racing it.
Negotiation context
- It's been on market 16 days — a 2% lower offer ($177k) is reasonable based on typical stale-listing flexibility.
- Current owner paid $55k; list at $180k implies a 227% gain — meaningful room to come down on a strong offer.
Risks & watch-outs
- Watch-outs: built in 1920 — expect roof / HVAC / electrical / plumbing capex.
- Climate carrying-cost: extreme-heat days projected 7→19/yr by 2055 (HVAC capex compounding) — expect insurance premiums to compound above CPI over the hold.
Questions for the listing agent
- Built in 1920 — when were the roof, HVAC, electrical panel, plumbing, and water heater last replaced?
- Is there a deadline driving the sale (1031 exchange, divorce, estate, relocation)? That informs how much negotiation room exists.
- Schools are F-rated, which usually means shorter tenancies and higher turnover. Who's the typical renter profile here, and what's been the actual vacancy rate?
- Crime grade is F in this area — have there been break-ins, vandalism, or insurance claims at this property in the last 3 years? What carrier currently insures it and at what premium?
- What's the average days-on-market for RENTAL listings here right now (not sales)? A rising rental-DOM trend means longer vacancies and softer asking-rent achievability than the comps imply.
- What's the recent tenant-quality profile in this submarket — average credit score on applications, eviction rate, late-payment / NSF rate, and stable-employment percentage? A property-management company in the area should have these aggregated.
- How much new for-sale + rental construction is in the pipeline within 1–3 miles? Heavy new supply typically softens prices + rents 12–24 months out; constrained supply supports both.
Investment metrics
- 1% rule
- 1.00% ✓
- Cap rate
- 8.70%
- Cash-on-cash
- 8.58%
- DSCR
- 1.38
- GRM
- 8.3
CMA / ARV
No comps found within radius.
Projected returns pro-forma
-3.0% appreciation · 3.0% rent growth · sell at horizon
- IRR
- -3.3%
- Equity multiple
- 0.88×
- Total profit
- $-6,291
- Equity at exit
- $26,839
- IRR
- 6.3%
- Equity multiple
- 1.47×
- Total profit
- $23,747
- Equity at exit
- $15,563
Cash invested: $50,400 (down + closing). Projections, not guarantees.
Landlord ↔ Tenant lean methodology
- Overall (STATE)
- 87 Strongly Landlord-Friendly
- State Tennessee
- 87 Strongly Landlord-Friendly · R+13
- County
- — inherits STATE
- City
- — inherits STATE
ZIP-level market 37010
- Home prices YoY
- -23.7%
- Active inventory
- 40
- Price-to-rent
- 8.3×
Monthly cashflow live
- Estimated rent
- $1,802 medium interval (Pro) →
- Mortgage (P&I)
- −$944
- Tax from tax record
- −$44 /mo · $526/yr
- Insurance
- −$75
- HOA
- −$0
- Vacancy / Maint / Mgmt
- −$378
- Net cashflow
- $361
Break-even live
Sensitivity live
| Price | -10% $462 | -5% $411 | +0% $361 | +5% $310 | +10% $259 |
|---|---|---|---|---|---|
| Rent | -10% $218 | -5% $289 | +0% $361 | +5% $432 | +10% $503 |
| Rate | -1.0pp $451 | -0.5pp $406 | base $361 | +0.5pp $314 | +1.0pp $266 |
UW: 25.0% down · 7.5% · 30yr · 1.5% tax · 5.0% vac · 8.0% maint · 8.0% mgmt
Financing live
Cash to close
- Down payment
- $45,000
- Closing costs
- $5,400
- Reserves months
- —
- Total cash needed
- —
Loan-product check · same deal, 3 products live
Conventional
25% down · 7.5% · 30yr
- Down + closing
- —
- Monthly P&I
- —
- Monthly cashflow
- —
- DSCR
- —
- Eligible?
- —
Personal DTI + credit; lowest rate.
DSCR
20% down · 8.5% · 30yr
- Down + closing
- —
- Monthly P&I
- —
- Monthly cashflow
- —
- DSCR
- —
- Eligible?
- —
No personal income docs; deal must DSCR.
Hard money
10% down · 12.0% · 12mo
- Down + closing
- —
- Monthly P&I
- —
- Monthly cashflow
- —
- DSCR
- —
- Eligible?
- —
Short-term bridge; refi at stabilization.
Listing history 11 events
-
2026-06-21days on market $180,000 Active 16 DOM
-
2026-06-18days on market $180,000 Active 13 DOM
-
2026-06-17days on market $180,000 Active 12 DOM
-
2026-06-16days on market $180,000 Active 11 DOM
-
2026-06-15days on market $180,000 Active 10 DOM
-
2026-06-13days on market $180,000 Active 8 DOM
-
2026-06-13days on market $180,000 Active 7 DOM
-
2026-06-09days on market $180,000 Active 4 DOM
-
2026-06-08days on market $180,000 Active 3 DOM
-
2026-06-07remarks 693-char remark
-
2026-06-07$180,000 Active 2 DOM
ⓘ Source: listings_history table (triggers on properties + properties_extension) + one-shot
backfill from property_details.listing_events for pre-trigger history.
Tax reassessment forecast TN · Resets to sale price
- Current annual tax
- $526 · $44/mo
- Projected year-2 tax
- $1,278 · $106/mo
- Expected delta
- +$752/yr (+$63/mo · 143.0%)
ⓘ Screening estimate from a state-policy table — verify with the county assessor before closing.
Climate risk First Street
- Flood 1/10 Low FEMA zone X (unshaded) · 0% chance over 30 yrs
- Wildfire 1/10 Low
- Heat 5/10 Major 7 d/yr ≥107°F today · 19 d/yr by 30 yrs out
- Wind 4/10 Moderate 10% chance of damaging wind over 30 yrs
- Air quality 2/10 Low 0 unhealthy d/yr today · 1 by 30 yrs out
Nearby sold comps map
Loading sold comps map…
Walkable amenities ~0.75 mi
Loading nearby amenities…
Taxation est. · year 1
- Rental income
- $21,620
- − Mortgage interest
- −$10,083
- − Property taxes
- −$526
- − Insurance
- −$900
- − Repairs & maintenance
- −$1,730
- − Management
- −$1,730
- − Depreciation
- −$5,236
- Taxable income
- $1,415
- Est. tax owed @ 24.0%
- −$340
- After-tax cash flow
- $3,987/yr
For passive investors: Depreciation is non-cash, so a rental often shows a tax loss while cash-flowing — sheltering income. Rental losses are passive: they offset passive income freely, and up to $25,000/yr can offset ordinary (W-2) income if you actively participate and your MAGI is under $100k (phasing out to $0 by $150k); unused losses carry forward. On sale, claimed depreciation is recaptured at up to 25%, and gains may owe capital-gains tax (a 1031 exchange can defer both). Figures are a year-1 estimate at your 24.0% rate — not tax advice; consult a CPA.
Schools (NCES district)
- District
- Robertson County
- NCES district ID
- 4703600
- Math proficiency
- 22% ▼ -11.00%
- Reading proficiency
- 26% ▼ -5.00%
- Median HH income
- $53,503
- Composite
- 21.55/100
- National rank
- #8313
- State rank
- #82 of 139 in TN
Livability — Adams
- Score
- 59/100
- State rank
- #297
- US rank
- #20566
Category grades
Schools grade is shown separately in the Schools card above.
Census & demographics
- Census place
- Adams, TN
- Population (ZIP)
- 5,143
Population outlook (Robertson County) Hauer SSP2
- Today (2025)
- 72,786 people
- By 2030
- 74,478 · +2.3%
- By 2040
- 76,948 · +5.7%
- By 2050
- 77,618 · +6.6%
- By 2075
- 77,545 · +6.5%
- By 2100
- 72,836 · +0.1%
Race, ethnicity, and origin ACS 2023
- Neighborhood character
- Predominantly White (81%)
- Race & ethnicity
- White 81% Black 8% Hispanic / Latino 8% Two or more races 4% Asian 1%
- Hispanic origin (detail)
- Mexican 3% Puerto Rican 4%
- Common ancestry
- Italian 5% Lithuanian 2% Slovak 2%
- Foreign-born
- 3% · Canada, China
- Languages at home
- 96% English-only · Spanish 4%
Political lean MEDSL · Robertson
- 2024 margin
- Solid R (+50.9) · D 24.0% · R 74.9% · Other 1.1%
- 2008→2024 swing
- -19.8pp toward R · 2008: -31.1pp · 2024: -50.9pp
- All cycles
- 2024: R+50.9 2020: R+47.0 2016: R+47.2 2012: R+35.6 2008: R+31.1
Not yet ingested
- Civics
- —
Market trends
- HPI YoY
- ▼ -86.74%
- Current HPI
- 279.909
- Rent YoY
- —
- Metro
- —
- State GDP YoY
- ▲ 2.78%
- F500 in state
- 22
Industry mix (Fortune 500 HQ in TN)
| Industry | F500 HQs | Revenue |
|---|---|---|
| Healthcare | 3 | $91B |
|
||
| Retail | 3 | $72B |
|
||
| Transportation / Logistics | 1 | $88B |
|
||
| Paper / Packaging | 1 | $19B |
|
||
| Insurance | 1 | $13B |
|
||
| Energy | 1 | $12B |
|
||
Price history
+1614.3% since first listed5 events — show timeline
- 2026-06-05 Listed $180,000 REALTRACS as Distributed by MLS Grid
- 2023-11-22 Sold (Public Records) $55,000 Public Records
- 2011-02-18 Sold (Public Records) $65,800 Public Records
- 1997-12-31 Sold (Public Records) $16,000 Public Records
- 1979-01-01 Sold (Public Records) $10,500 Public Records
Property tax history
+5.7%/yrLatest (2025): $526 · +0.0% YoY. Source: county tax records.
Cash-flow waterfall
monthlySold comps — $/sqft
last 12 mo · ≤1 miLoading sold comps…