422 Darby Ter · Darby, PA
Flood risk 1/10 · Minimal
- FEMA flood zone
- X (unshaded)
- Chance of flooding over 30 yrs
- 0.0%
- Est. flood insurance / yr
- $473 – $860
Fire risk 1/10 · Minimal
- Est. fire insurance / yr
- $511 – $949
Heat risk 7/10 · Major
- Hot days now (above 103°F)
- 7 days/yr
- Hot days in 30 yrs
- 15 days/yr
Wind risk 6/10 · Moderate
- Chance of severe wind over 30 yrs
- 27.0%
Air-quality risk 4/10 · Minor
- Unhealthy air days now
- 3 days/yr
- Unhealthy air days in 30 yrs
- 6 days/yr
Risk factors via First Street. Map © Google.
Why this score? — see what drove the D- grade
The composite is a weighted blend of 9 inputs, each scored 0–100. Each bar is that input's sub-score; the figure is the points it added to the 100-point composite (weight × sub-score).
- Cash flow +14.6/30.0
- Rent growth +5.0/5.0
- DSCR +4.4/10.0
- 1% rule +4.2/10.0
- Livability +3.7/5.0
- Condition / age +2.5/5.0
- Schools +1.7/10.0
- ARV discount +0.0/15.0
- Appreciation +0.0/10.0
$174,900
🖨 Deal sheet (PDF) 📄 Offer letter ✓ Due diligence
Listing remarks MLS
Calling on all First-Time Home Buyers and/or Savvy Investors. This home will make a great starter home for the First-Time Home Buyer or an excellent addition to your investment portfolio 404 Darby Terrance just sold a few months ago for $150,000. Property is situated on a quiet block and a short walk away from public transportation and shopping is within 15 minutes. Come see it today!!
Key facts
- Built 1940
- Listed 16 days
Property features AI
Exterior
- Parking: On-street parking
- Utilities: Public water; Public sewer; Natural gas service
- Home design: Interior townhouse/rowhouse; Brick construction
- Construction: Brick exterior; Brick/mortar foundation; Above grade and below grade structures
- Exterior features: Full basement; Two or more access exits
Interior
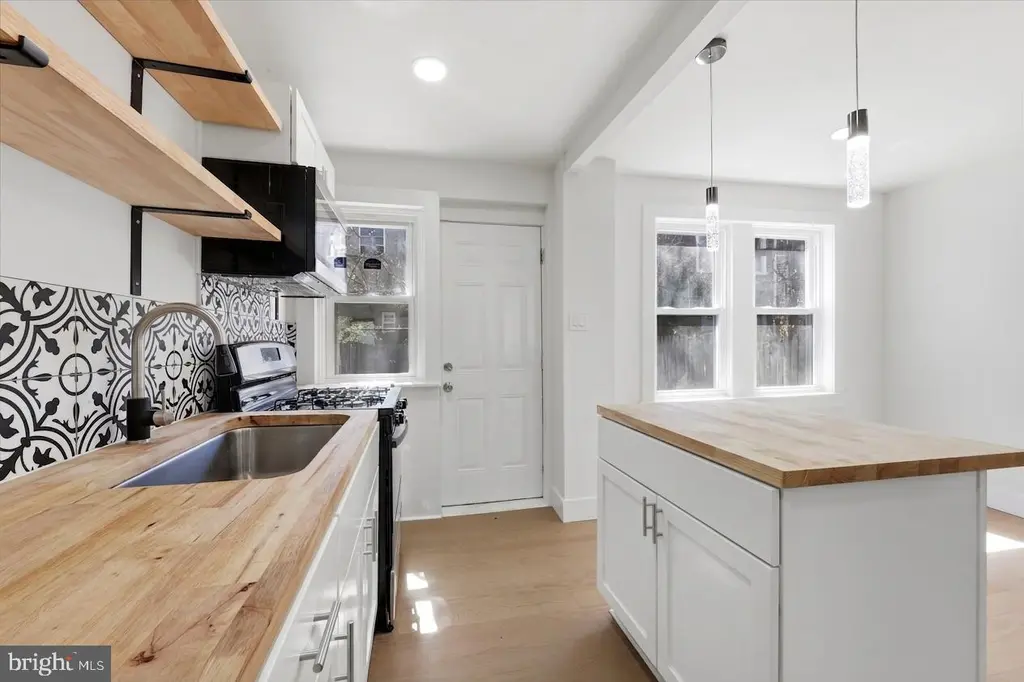
- Kitchen: Kitchen island; Upgraded countertops
- Bedrooms: Three bedrooms on the upper level
- Bathrooms: One full bathroom
- Heating & cooling: 90% forced air heating (natural gas); Central heating; Central air conditioning (natural gas); Natural gas hot water
- Interior features: Kitchen island; Dining area; Recessed lighting; Upgraded countertops; Electric fireplace
Neighborhood map
What this means for you Summary
Snapshot
- This is a 3-bed/1.0-bath townhouse listed at $175k.
Deal economics
- At list price, monthly cash flow is $40 ($485/yr) — positive.
- The deal already cash-flows at list — no discount required.
- To meet the 1% rule (rent ≥ 1% of price), the offer needs to be $160k (8.4% below list).
- Recommended offer: $160k (8.4% below list) — sets the bar for 1% rule.
Location & tenants
- Location reads 74/100 on livability (#485 in PA, #4,468 nationally) — a middle-class / working-renter tenant base. Strengths: commute A+, cost of living A+, housing A+; Watch: amenities D+, employment D, crime F.
- William Penn SD (suburban): math 11% / reading 28% proficiency, ranked #491 of 539 in PA (top 91%) — low school quality limits family demand, transient renter base, plan for 1-2y turnover; 69% free/reduced lunch — lower-income household profile, screen leases tightly.
- Zoned schools: Walnut Street El Sch (math 8% / reading 17%, grade F, #1,362 of 1,518 statewide, top 92%, 303 students, 100% FRL); Penn Wood Ms (math 5% / reading 28%, grade F, #463 of 512 statewide, top 91%, 683 students, 100% FRL); Penn Wood Hs (math 25% / reading 15%, grade F, #387 of 437 statewide, top 89%, 1,170 students, 95% FRL) — zoned schools average 98% FRL vs 69% district-wide (30 pts higher); higher-poverty schools than district average — tighter screening recommended.
- Market conditions: Rents rising fast (+13.1%/yr); 101 active listings in the ZIP; 18 comparable units currently listed for rent nearby; rentals at typical pace (median 27d on market — plan ~3-4 weeks tenant-placement turnaround); 299 units permitted in Delaware County in 2024 (5 in 5+ unit buildings).
- This rent runs 41% of the median local income ($46k/yr) — at the standard rent-burdened threshold; future hikes will face affordability resistance.
Forward outlook
- Local home prices are declining (-3.0%/yr); year-one equity from $1k of loan paydown is wiped out by about $5k of value loss. Plan a longer hold.
Negotiation context
- It's been on market 16 days — a 2% lower offer ($172k) is reasonable based on typical stale-listing flexibility.
- 11 sale attempts since 27y ago with the ask held roughly flat each time — persistent listings suggest the price (not the market) is what's stuck; bring a comps-based counter.
- Current owner paid $77k; list at $175k implies a 127% gain — meaningful room to come down on a strong offer.
Risks & watch-outs
- Watch-outs: built in 1940 — expect roof / HVAC / electrical / plumbing capex.
- Climate carrying-cost: major wind risk, 27% chance of damaging wind over 30y; extreme-heat days projected 7→15/yr by 2055 (HVAC capex compounding) — expect insurance premiums to compound above CPI over the hold.
Questions for the listing agent
- Built in 1940 — when were the roof, HVAC, electrical panel, plumbing, and water heater last replaced?
- Is there a deadline driving the sale (1031 exchange, divorce, estate, relocation)? That informs how much negotiation room exists.
- Schools are F-rated, which usually means shorter tenancies and higher turnover. Who's the typical renter profile here, and what's been the actual vacancy rate?
- Crime grade is F in this area — have there been break-ins, vandalism, or insurance claims at this property in the last 3 years? What carrier currently insures it and at what premium?
- The area grade is low — what's the realistic commute time and amenity access for the typical tenant pool here? Any planned neighborhood developments (good or bad) we should know about?
- What's the average days-on-market for RENTAL listings here right now (not sales)? A rising rental-DOM trend means longer vacancies and softer asking-rent achievability than the comps imply.
- What's the recent tenant-quality profile in this submarket — average credit score on applications, eviction rate, late-payment / NSF rate, and stable-employment percentage? A property-management company in the area should have these aggregated.
- How much new for-sale + rental construction is in the pipeline within 1–3 miles? Heavy new supply typically softens prices + rents 12–24 months out; constrained supply supports both.
Investment metrics
- 1% rule
- 0.92% ✗
- Cap rate
- 6.57%
- Cash-on-cash
- 0.99%
- DSCR
- 1.04
- GRM
- 9.1
CMA / ARV
- ARV (on-the-fly)
- $145,200
- Comps found
- 12
Show comp detail 12 sales within ~0.75 mi
| Address | Dist | Beds/Ba | Sqft | Sold | Price | $/sf | Match |
|---|---|---|---|---|---|---|---|
| 421 Darby Ter | 0.02mi | 3/1.0 | 968 (0%) | 5mo | $66,000 | $68 | 95 |
| 422 Darby Ter | 0.00mi | 3/1.0 | 1,006 (+4%) | 1mo | $185,000 | $184 | 93 |
| 318 Fern St | 0.13mi | 2/1.0 (-1) | 952 (-2%) | 2mo | $105,000 | $110 | 85 |
| 224 N 2nd St | 0.25mi | 3/1.0 | 992 (+2%) | 2mo | $190,000 | $192 | 83 |
| 443 Darby Ter | 0.03mi | 3/1.0 | 1,064 (+10%) | 4mo | $120,500 | $113 | 78 |
| 2120 S Lloyd St | 0.40mi | 2/1.0 (-1) | 896 (-7%) | 1mo | $70,000 | $78 | 63 |
| 606 Colwyn | 0.42mi | 2/1.5 (-1) | 896 (-7%) | 1mo | $120,000 | $134 | 60 |
| 456 S 2nd St | 0.49mi | 3/1.0 | 1,072 (+11%) | 2mo | $189,000 | $176 | 58 |
| 219 Laurel Rd | 0.60mi | 2/1.0 (-1) | 1,068 (+10%) | 2mo | $160,000 | $150 | 48 |
| 2426 S Rosella St | 0.57mi | 3/1.5 | 1,090 (+13%) | 3mo | $237,500 | $218 | 48 |
| 7353 Buist Ave | 0.72mi | 3/1.0 | 1,096 (+13%) | 4mo | $115,000 | $105 | 41 |
| 2604 S Berbro St | 0.74mi | 3/2.5 | 1,088 (+12%) | 5mo | $240,000 | $221 | 35 |
Match score weights: distance 35% · size 25% · config 20% · recency 20%. Top-matched comps best support the ARV.
Projected returns pro-forma
-3.0% appreciation · 8.0% rent growth · sell at horizon
- IRR
- -9.2%
- Equity multiple
- 0.65×
- Total profit
- $-17,267
- Equity at exit
- $26,078
- IRR
- 6.0%
- Equity multiple
- 1.55×
- Total profit
- $26,953
- Equity at exit
- $15,122
Cash invested: $48,972 (down + closing). Projections, not guarantees.
Landlord ↔ Tenant lean methodology
- Overall (STATE)
- 62 Landlord-Friendly
- State Pennsylvania
- 62 Landlord-Friendly · EVEN
- County
- — inherits STATE
- City
- — inherits STATE
ZIP-level market 19023
- Rents YoY
- 13.1%
- Active inventory
- 101
- Price-to-rent
- 9.1×
Monthly cashflow live
- Estimated rent
- $1,602 high interval (Pro) →
- Mortgage (P&I)
- −$917
- Tax from tax record
- −$235 /mo · $2,823/yr
- Insurance
- −$73
- HOA
- −$0
- Lot rent
- −$0
- Vacancy / Maint / Mgmt
- −$336
- Net cashflow
- $40
Break-even live
Sensitivity live
| Price | -10% $139 | -5% $90 | +0% $40 | +5% $-9 | +10% $-59 |
|---|---|---|---|---|---|
| Rent | -10% $-86 | -5% $-23 | +0% $40 | +5% $104 | +10% $167 |
| Rate | -1.0pp $128 | -0.5pp $85 | base $40 | +0.5pp $-5 | +1.0pp $-51 |
UW: 25.0% down · 7.5% · 30yr · 1.5% tax · 5.0% vac · 8.0% maint · 8.0% mgmt
Financing live
Cash to close
- Down payment
- $43,725
- Closing costs
- $5,247
- Reserves months
- —
- Total cash needed
- —
Loan-product check · same deal, 3 products live
Conventional
25% down · 7.5% · 30yr
- Down + closing
- —
- Monthly P&I
- —
- Monthly cashflow
- —
- DSCR
- —
- Eligible?
- —
Personal DTI + credit; lowest rate.
DSCR
20% down · 8.5% · 30yr
- Down + closing
- —
- Monthly P&I
- —
- Monthly cashflow
- —
- DSCR
- —
- Eligible?
- —
No personal income docs; deal must DSCR.
Hard money
10% down · 12.0% · 12mo
- Down + closing
- —
- Monthly P&I
- —
- Monthly cashflow
- —
- DSCR
- —
- Eligible?
- —
Short-term bridge; refi at stabilization.
Rent comps 18 comps
| Address | Beds | Baths | Sqft | Rent | $/sqft | DOM | Units | Dist |
|---|---|---|---|---|---|---|---|---|
| 300 N Front St Darby, PA | 2.0 | 1.0 | 850 | $1,395 | $1.64 | 46d | 1 | 0.28mi |
| 700 Pine St Unit 2F Darby, PA | 2.0 | 1.0 | 1100 | $1,250 | $1.14 | 20d | 1 | 0.43mi |
| 909 Springfield Rd Unit D Darby, PA | 4.0 | 1.0 | 900 | $1,600 | $1.78 | 46d | 1 | 0.56mi |
| 957 Springfield Rd Unit 1 Darby, PA | 2.0 | 1.0 | 600 | $1,400 | $2.33 | 20d | 1 | 0.69mi |
| 601 Poplar St Sharon Hill, PA | 1.0–2.0 | 1.0 | 787 | $1,599 | $2.03 | 17d | 5 | 0.77mi |
| 1300 Main St Unit Basement Darby, PA | 2.0 | 1.0 | 800 | $1,450 | $1.81 | 13d | 1 | 0.78mi |
| 1300 Main St Unit Basement Darby, PA | 2.0 | 1.0 | 1000 | $1,450 | $1.45 | 26d | 1 | 0.78mi |
| 37 Concord Rd Darby, PA | 3.0 | 1.0 | 1120 | $1,795 | $1.60 | 46d | 1 | 0.92mi |
| 810 Rundale Ave Lansdowne, PA | 2.0 | 1.0 | 868 | $1,500 | $1.73 | 26d | 1 | 0.93mi |
| 826 Guenther Ave Lansdowne, PA | 2.0 | 1.0–2.0 | 800 | $1,699 | $2.12 | 26d | 1 | 1.10mi |
| 608 Yeadon Ave Unit 2nd Floor Yeadon, PA | 2.0 | 1.0 | 1000 | $1,400 | $1.40 | 15d | 1 | 1.22mi |
| 608 Yeadon Ave Unit 1st Floor Yeadon, PA | 2.0 | 1.0 | 1000 | $1,400 | $1.40 | 20d | 1 | 1.22mi |
| 504 S Lansdowne Ave Lansdowne, PA | 2.0 | 1.0 | 815 | $1,545 | $1.90 | 1d | 4 | 1.24mi |
| 112 Juliana Ter Darby, PA | 3.0 | 1.0 | 1020 | $2,350 | $2.30 | 46d | 1 | 1.25mi |
| 112 Juliana Ter Darby, PA | 3.0 | 1.0 | 1020 | $2,450 | $2.40 | 26d | 1 | 1.25mi |
| 1037 Laurel Rd Sharon Hill, PA | 2.0 | 1.0 | 655 | $1,195 | $1.82 | 46d | 1 | 1.38mi |
| 146 S Lansdowne Ave Apt A9 Lansdowne, PA | 2.0 | 1.0 | 950 | $1,469 | $1.55 | 1d | 1 | 1.40mi |
| 1012 Burnside Rd Sharon Hill, PA | 2.0 | 1.0 | 655 | $1,295 | $1.98 | 46d | 1 | 1.42mi |
Listing history 32 events
-
2026-05-01status Pending
-
2026-04-20status Active
-
2026-04-16historical
-
2026-04-12$174,900 Active
-
2026-03-25historical $174,900
-
2025-09-24soldstatus $77,000
-
2025-09-04soldstatus $77,000 Closed 389-char remark
Show marketing remark (389 chars)
Calling on all First-Time Home Buyers and/or Savvy Investors. This home will make a great starter home for the First-Time Home Buyer or an excellent addition to your investment portfolio 404 Darby Terrance just sold a few months ago for $150,000. Property is situated on a quiet block and a short walk away from public transportation and shopping is within 15 minutes. Come see it today!!
-
2025-07-20status Pending 389-char remark
Show marketing remark (389 chars)
Calling on all First-Time Home Buyers and/or Savvy Investors. This home will make a great starter home for the First-Time Home Buyer or an excellent addition to your investment portfolio 404 Darby Terrance just sold a few months ago for $150,000. Property is situated on a quiet block and a short walk away from public transportation and shopping is within 15 minutes. Come see it today!!
-
2025-06-29$79,900 Active 389-char remark
Show marketing remark (389 chars)
Calling on all First-Time Home Buyers and/or Savvy Investors. This home will make a great starter home for the First-Time Home Buyer or an excellent addition to your investment portfolio 404 Darby Terrance just sold a few months ago for $150,000. Property is situated on a quiet block and a short walk away from public transportation and shopping is within 15 minutes. Come see it today!!
-
2019-05-03soldstatus $45,000
-
2019-03-01historical
-
2018-11-14$45,000 Active
-
2018-03-30historical
-
2017-11-17$50,000 Active
-
2011-09-16soldstatus $10,000
-
2011-09-16soldstatus $10,000
-
2011-07-06historical
-
2011-05-15$11,500
-
2011-05-15$11,500
-
2008-02-28historical
-
2007-08-01$69,900
-
2007-03-01soldstatus $35,000
-
2007-02-10soldstatus $35,000
-
2006-05-31$35,000
-
2004-06-11soldstatus $29,680
-
2004-06-11soldstatus $53,000
-
2003-01-21soldstatus $16,000
-
2002-11-04historical
-
2002-10-30$16,000
-
1999-12-02soldstatus $11,000
-
1999-10-29historical
-
1999-10-28$11,000
ⓘ Source: listings_history table (triggers on properties + properties_extension) + one-shot
backfill from property_details.listing_events for pre-trigger history.
Tax reassessment forecast PA · Partial reset (capped growth)
- Current annual tax
- $2,823 · $235/mo
- Projected year-2 tax
- $2,823 · $235/mo
- Expected delta
- $0/yr ($0/mo · 0.0%)
ⓘ Screening estimate from a state-policy table — verify with the county assessor before closing.
Climate risk First Street
- Flood 1/10 Low FEMA zone X (unshaded) · 0% chance over 30 yrs
- Wildfire 1/10 Low
- Heat 7/10 Severe 7 d/yr ≥103°F today · 15 d/yr by 30 yrs out
- Wind 6/10 Major 27% chance of damaging wind over 30 yrs
- Air quality 4/10 Moderate 3 unhealthy d/yr today · 6 by 30 yrs out
Nearby sold comps map
Loading sold comps map…
Walkable amenities ~0.75 mi
Loading nearby amenities…
Taxation est. · year 1
- Rental income
- $19,226
- − Mortgage interest
- −$9,797
- − Property taxes
- −$2,823
- − Insurance
- −$874
- − Repairs & maintenance
- −$1,538
- − Management
- −$1,538
- − Depreciation
- −$5,088
- Taxable loss
- −$2,433
- Est. tax savings @ 24.0%
- +$584
- After-tax cash flow
- $1,069/yr
For passive investors: Depreciation is non-cash, so a rental often shows a tax loss while cash-flowing — sheltering income. Rental losses are passive: they offset passive income freely, and up to $25,000/yr can offset ordinary (W-2) income if you actively participate and your MAGI is under $100k (phasing out to $0 by $150k); unused losses carry forward. On sale, claimed depreciation is recaptured at up to 25%, and gains may owe capital-gains tax (a 1031 exchange can defer both). Figures are a year-1 estimate at your 24.0% rate — not tax advice; consult a CPA.
Schools (NCES district)
- District
- William Penn SD
- NCES district ID
- 4226390
- Math proficiency
- 11% ▼ -3.00%
- Reading proficiency
- 28% ▼ -7.00%
- Median HH income
- $48,543
- Composite
- 17.29/100
- National rank
- #9086
- State rank
- #491 of 539 in PA
Livability — Darby
- Score
- 74/100
- State rank
- #485
- US rank
- #4468
Category grades
Schools grade is shown separately in the Schools card above.
Census & demographics
- Census place
- Darby, PA
- County
- Delaware County · 399,863 people
- Metro
- Philadelphia-Camden-Wilmington, PA-NJ-DE-MD
- Population (ZIP)
- 22,247
- Household income
- $46,463
- Rent vs Own
- Severe rent burden
- 1468.0
Population outlook (Delaware County) Hauer SSP2
- Today (2025)
- 577,490 people
- By 2030
- 581,243 · +0.6%
- By 2040
- 584,700 · +1.2%
- By 2050
- 586,581 · +1.6%
- By 2075
- 598,706 · +3.7%
- By 2100
- 590,823 · +2.3%
Race, ethnicity, and origin ACS 2023
- Neighborhood character
- Predominantly Black (76%)
- Race & ethnicity
- Black 76% White 15% Two or more races 5% Hispanic / Latino 3% Asian 2%
- Common ancestry
- Swiss 5% Hispanic 1% Romanian 1%
- Foreign-born
- 18% · Canada
- Languages at home
- 84% English-only · French/Haitian/Cajun 4% Spanish 3% Other Asian/Pacific 1%
Political lean MEDSL · Delaware
- 2024 margin
- Strong D (+23.7) · D 61.4% · R 37.6% · Other 1.0%
- 2008→2024 swing
- +2.3pp toward D · 2008: 21.4pp · 2024: 23.7pp
- All cycles
- 2024: D+23.7 2020: D+26.7 2016: D+22.0 2012: D+21.8 2008: D+21.4
Not yet ingested
- Civics
- —
Market trends
- HPI YoY
- ▼ -190.50%
- Current HPI
- 277.7034
- Rent YoY
- ▲ 13.10%
- Metro
- Philadelphia-Camden-Wilmington, PA-NJ-DE-MD
- State GDP YoY
- ▲ 1.68%
- F500 in state
- 34
Industry mix (Fortune 500 HQ in PA)
| Industry | F500 HQs | Revenue |
|---|---|---|
| Healthcare | 2 | $309B |
|
||
| Insurance | 2 | $27B |
|
||
| Telecommunications / Media | 1 | $124B |
|
||
| Industrial Distribution | 1 | $22B |
|
||
| Financial Services | 1 | $20B |
|
||
| Chemicals / Materials | 1 | $18B |
|
||
Price history
+1490.0% since first listed32 events — show timeline
- 2026-05-01 Pending — BRIGHT MLS
- 2026-04-20 Relisted — BRIGHT MLS
- 2026-04-16 Listing Removed — BRIGHT MLS
- 2026-04-12 Listed $174,900 BRIGHT MLS
- 2026-03-25 Coming Soon $174,900 BRIGHT MLS
- 2025-09-24 Sold (Public Records) $77,000 Public Records
- 2025-09-04 Sold (MLS) $77,000 BRIGHT MLS
- 2025-07-20 Pending — BRIGHT MLS
- 2025-06-29 Listed $79,900 BRIGHT MLS
- 2019-05-03 Sold (Public Records) $45,000 Public Records
- 2019-03-01 Listing Removed — BRIGHT MLS
- 2018-11-14 Listed $45,000 BRIGHT MLS
- 2018-03-30 Listing Removed — BRIGHT MLS
- 2017-11-17 Listed $50,000 BRIGHT MLS
- 2011-09-16 Sold (MLS) $10,000 BRIGHT MLS
- 2011-09-16 Sold (MLS) $10,000 TREND
- 2011-07-06 Listing Removed — BRIGHT MLS
- 2011-05-15 Listed $11,500 BRIGHT MLS
- 2011-05-15 Listed $11,500 TREND
- 2008-02-28 Listing Removed — BRIGHT MLS
- 2007-08-01 Listed $69,900 BRIGHT MLS
- 2007-03-01 Sold (Public Records) $35,000 Public Records
- 2007-02-10 Sold (MLS) $35,000 BRIGHT MLS
- 2006-05-31 Listed $35,000 BRIGHT MLS
- 2004-06-11 Sold (Public Records) $53,000 Public Records
- 2004-06-11 Sold (Public Records) $29,680 Public Records
- 2003-01-21 Sold (MLS) $16,000 BRIGHT MLS
- 2002-11-04 Listing Removed — BRIGHT MLS
- 2002-10-30 Listed $16,000 BRIGHT MLS
- 1999-12-02 Sold (MLS) $11,000 BRIGHT MLS
- 1999-10-29 Listing Removed — BRIGHT MLS
- 1999-10-28 Listed $11,000 BRIGHT MLS
Property tax history
+1.5%/yrLatest (2026): $2,823 · -0.5% YoY. Source: county tax records.
Cash-flow waterfall
monthlySold comps — $/sqft
last 12 mo · ≤1 miLoading sold comps…