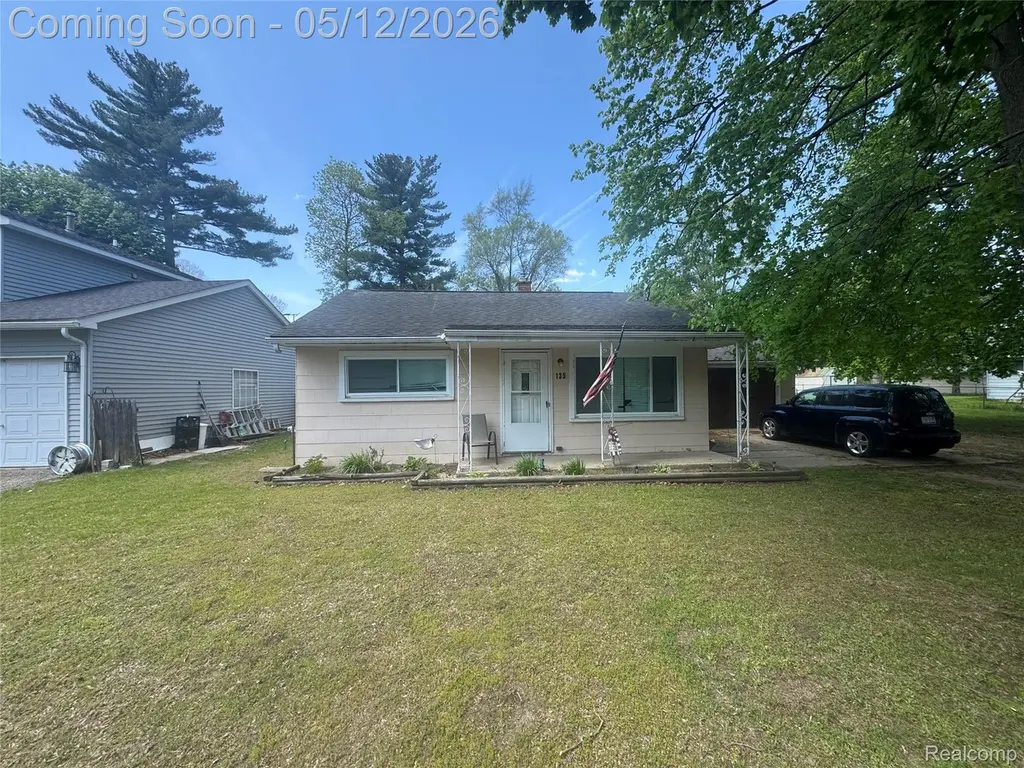
135 Hershey Blvd · Orchard Lake Village, MI
Flood risk 4/10 · Minor
- FEMA flood zone
- X (unshaded)
- Chance of flooding over 30 yrs
- 0.22%
- Est. flood insurance / yr
- $473 – $860
Fire risk 1/10 · Minimal
- Est. fire insurance / yr
- $784 – $1,456
Heat risk 2/10 · Minimal
- Hot days now (above 96°F)
- 7 days/yr
- Hot days in 30 yrs
- 15 days/yr
Wind risk 2/10 · Minimal
- Chance of severe wind over 30 yrs
- —
Air-quality risk 3/10 · Minor
- Unhealthy air days now
- 2 days/yr
- Unhealthy air days in 30 yrs
- 4 days/yr
Risk factors via First Street. Map © Google.
Why this score? — see what drove the C grade
The composite is a weighted blend of 9 inputs, each scored 0–100. Each bar is that input's sub-score; the figure is the points it added to the 100-point composite (weight × sub-score).
- Cash flow +19.3/30.0
- ARV discount +15.0/15.0
- 1% rule +6.4/10.0
- DSCR +6.1/10.0
- Livability +3.2/5.0
- Schools +3.0/10.0
- Rent growth +2.5/5.0
- Condition / age +2.5/5.0
- Appreciation +0.0/10.0
$124,900
🖨 Deal sheet 📄 Offer letter ✓ Due diligence
Listing remarks MLS
Investor special. 2 bedroom, 1 bath home with garage. Cash terms only. All dimensions are approximate. Buyer/buyers agent to verify all dimensions. Sold as-is, seller will make no repairs. Solid structure with water/sewer connections. Great end user and/or flip possibility.
Key facts
- 0.31 acre lot
- Garage
- Built 1954
Property features AI
Finance
- Other: Lot approximately 0.31 acres (80 x 129.73)
- Financial info: Annual property tax listed (amount available in listing materials)
- HOA & community: Subdivision: Crescent Lake Country Club
Exterior
- Parking: Attached garage (1 car)
- Utilities: Public water; Public sewer
- Home design: Single-family residence; One story; Ground-level entry; Facing direction not specified
- Construction: Aluminum siding; Slab foundation; Built using standard residential construction
- Exterior features: Front porch; Paved road access
Interior
- Bathrooms: 1 full bathroom
- Heating & cooling: Forced air heating (natural gas); No central cooling
- Interior features: Crawl space basement; Total of 4 rooms
Neighborhood map
What this means for you Summary
Snapshot
- This is a 2-bed/1.0-bath single-family listed at $125k.
Deal economics
- At list price, monthly cash flow is $136 ($2k/yr) — positive.
- The deal already cash-flows at list — no discount required.
- Meets the 1% rule at list price ($1k rent vs $125k).
- Cap rate 7.6% vs local median 3.4% in Orchard Lake Village — top-decile yield for the area; either an underpriced asset or a hidden risk that comps aren't pricing in. Stress-test before assuming the spread holds.
Location & tenants
- Location reads 65/100 on livability (#465 in MI) — a middle-class / working-renter tenant base. Strengths: crime A+, employment A+, housing A+; Watch: amenities F, commute F, cost of living F.
- Waterford School District (suburban): math 26% / reading 42% proficiency, ranked #285 of 540 in MI (top 53%) — families likely to look elsewhere, expect single-tenant / working-renter base with shorter leases.
- Market conditions: 99 active listings in the ZIP; 8 comparable units currently listed for rent nearby; rentals leasing fast (median 5d on market — plan ~1-2 weeks tenant-placement turnaround); 2,614 units permitted in Oakland County in 2024 (721 in 5+ unit buildings).
Forward outlook
- Local home prices are declining (-3.0%/yr); year-one equity from $864 of loan paydown is wiped out by about $4k of value loss. Plan a longer hold.
- Oakland County population projected at +10% by 2050 — modest demand growth; plan on rents tracking national, not racing it.
Negotiation context
- Only 3 days on market — expect competitive offers; lowballing is unlikely to land.
- 2 sale attempts with the ask held roughly flat each time — persistent listings suggest the price (not the market) is what's stuck; bring a comps-based counter.
- Current owner paid $55k; list at $125k implies a 128% gain — meaningful room to come down on a strong offer.
Risks & watch-outs
- Watch-outs: property tax is 2.7% of price; built in 1954 — expect roof / HVAC / electrical / plumbing capex.
Questions for the listing agent
- Built in 1954 — when were the roof, HVAC, electrical panel, plumbing, and water heater last replaced?
- Property tax is high relative to price — has the assessment been appealed recently, and will the sale trigger a re-assessment?
- Is there a deadline driving the sale (1031 exchange, divorce, estate, relocation)? That informs how much negotiation room exists.
- Schools are B-rated — typically a magnet for longer-tenancy family renters. What's the average tenant stay here, and is there a school-zone premium baked into asking?
- What's the average days-on-market for RENTAL listings here right now (not sales)? A rising rental-DOM trend means longer vacancies and softer asking-rent achievability than the comps imply.
- What's the recent tenant-quality profile in this submarket — average credit score on applications, eviction rate, late-payment / NSF rate, and stable-employment percentage? A property-management company in the area should have these aggregated.
- How much new for-sale + rental construction is in the pipeline within 1–3 miles? Heavy new supply typically softens prices + rents 12–24 months out; constrained supply supports both.
Investment metrics
- 1% rule
- 1.14% ✓
- Cap rate
- 7.60%
- Cash-on-cash
- 4.68%
- DSCR
- 1.21
- GRM
- 7.3
CMA / ARV
- ARV (on-the-fly)
- $191,880
- Comps found
- 12
Show comp detail 12 sales within ~0.75 mi
| Address | Dist | Beds/Ba | Sqft | Sold | Price | $/sf | Match |
|---|---|---|---|---|---|---|---|
| 135 Hershey Blvd | 0.00mi | 2/1.0 | 984 (0%) | 1mo | $124,900 | $127 | 99 |
| 5458 Vincent Ave | 0.28mi | 3/1.0 (+1) | 1,008 (+2%) | 5mo | $160,000 | $159 | 74 |
| 5496 Elizabeth Lake Rd | 0.21mi | 3/1.0 (+1) | 960 (-2%) | 11mo | $225,000 | $234 | 72 |
| 261 Hershey Blvd | 0.15mi | 3/1.5 (+1) | 1,118 (+14%) | 7mo | $265,000 | $237 | 57 |
| 1274 Nancywood Dr | 0.61mi | 3/1.0 (+1) | 936 (-5%) | 2mo | $320,000 | $342 | 57 |
| 5581 Savoy Dr | 0.36mi | 3/1.0 (+1) | 912 (-7%) | 13mo | $86,000 | $94 | 55 |
| 5570 Elizabeth Lake Rd | 0.28mi | 1/1.0 (-1) | 918 (-7%) | 19mo | $160,000 | $174 | 55 |
| 4935 Pontiac Lake Rd | 0.49mi | 2/1.0 | 1,096 (+11%) | 5mo | $198,000 | $181 | 54 |
| 5515 Oster Dr | 0.40mi | 2/1.5 | 1,105 (+12%) | 11mo | $215,000 | $195 | 50 |
| 5820 Eldridge Dr | 0.68mi | 3/1.0 (+1) | 1,004 (+2%) | 18mo | $210,000 | $209 | 45 |
| 5470 Vincent Ave | 0.28mi | 2/1.5 | 1,126 (+14%) | 21mo | $210,000 | $187 | 43 |
| 4771 Fiddle Ave | 0.61mi | 3/1.0 (+1) | 1,106 (+12%) | 5mo | $270,000 | $244 | 42 |
Match score weights: distance 35% · size 25% · config 20% · recency 20%. Top-matched comps best support the ARV.
Projected returns pro-forma
-3.0% appreciation · 3.0% rent growth · sell at horizon
- IRR
- -8.9%
- Equity multiple
- 0.67×
- Total profit
- $-11,460
- Equity at exit
- $18,623
- IRR
- 0.7%
- Equity multiple
- 1.05×
- Total profit
- $1,605
- Equity at exit
- $10,799
Cash invested: $34,972 (down + closing). Projections, not guarantees.
Landlord ↔ Tenant lean methodology
- Overall (STATE)
- 62 Landlord-Friendly
- State Michigan
- 62 Landlord-Friendly · EVEN
- County
- — inherits STATE
- City
- — inherits STATE
ZIP-level market 48327
- Active inventory
- 99
- Price-to-rent
- 7.3×
Monthly cashflow live
- Estimated rent
- $1,429 high interval (Pro) →
- Mortgage (P&I)
- −$655
- Tax from tax record
- −$285 /mo · $3,423/yr
- Insurance
- −$52
- HOA
- −$0
- Vacancy / Maint / Mgmt
- −$300
- Net cashflow
- $136
Break-even live
UW: 25.0% down · 7.5% · 30yr · 1.5% tax · 5.0% vac · 8.0% maint · 8.0% mgmt
Financing live
Cash to close
- Down payment
- $31,225
- Closing costs
- $3,747
- Reserves months
- —
- Total cash needed
- —
Loan-product check · same deal, 3 products live
Conventional
25% down · 7.5% · 30yr
- Down + closing
- —
- Monthly P&I
- —
- Monthly cashflow
- —
- DSCR
- —
- Eligible?
- —
Personal DTI + credit; lowest rate.
DSCR
20% down · 8.5% · 30yr
- Down + closing
- —
- Monthly P&I
- —
- Monthly cashflow
- —
- DSCR
- —
- Eligible?
- —
No personal income docs; deal must DSCR.
Hard money
10% down · 12.0% · 12mo
- Down + closing
- —
- Monthly P&I
- —
- Monthly cashflow
- —
- DSCR
- —
- Eligible?
- —
Short-term bridge; refi at stabilization.
Rent comps 8 comps
| Address | Beds | Baths | Sqft | Rent | $/sqft | DOM | Units | Dist |
|---|---|---|---|---|---|---|---|---|
| 5331 Highland Rd Waterford, MI | 2.0 | 1.0 | 900 | $1,075 | $1.19 | 3d | 1 | 0.81mi |
| 1490 Nancywood Dr Waterford Township, MI | 1.0 | 1.0 | 612 | $900 | $1.47 | 15d | 1 | 0.82mi |
| 1494 Nancywood Dr Waterford Township, MI | 1.0 | 1.0 | 612 | $925 | $1.51 | 43d | 1 | 0.82mi |
| 125 Edge Waterford Twp, MI | 1.0–2.0 | 1.0 | 605 | $1,223 | $2.02 | 1d | 53 | 0.94mi |
| 131 Doremus Ave Waterford, MI | 3.0 | 1.0 | 1072 | $1,800 | $1.68 | 24d | 1 | 0.98mi |
| 1643 Alma Ave Waterford, MI | 2.0 | 1.0 | 706 | $1,500 | $2.12 | 5d | 1 | 1.04mi |
| 5278 Rosamond Ln Waterford Twp, MI | 1.0–2.0 | 1.0–1.5 | 988 | $1,514 | $1.53 | 1d | 16 | 1.34mi |
| 170 Leslie Ln Waterford Twp, MI | 1.0–2.0 | 1.0 | 875 | $1,310 | $1.50 | 2d | 5 | 1.42mi |
Listing history 7 events
-
2026-05-14status Pending 274-char remark
Show marketing remark (274 chars)
Investor special. 2 bedroom, 1 bath home with garage. Cash terms only. All dimensions are approximate. Buyer/buyers agent to verify all dimensions. Sold as-is, seller will make no repairs. Solid structure with water/sewer connections. Great end user and/or flip possibility.
-
2026-05-14status Pending
Show marketing remark (274 chars)
Investor special. 2 bedroom, 1 bath home with garage. Cash terms only. All dimensions are approximate. Buyer/buyers agent to verify all dimensions. Sold as-is, seller will make no repairs. Solid structure with water/sewer connections. Great end user and/or flip possibility.
-
2026-05-12$124,900 Active 274-char remark
Show marketing remark (274 chars)
Investor special. 2 bedroom, 1 bath home with garage. Cash terms only. All dimensions are approximate. Buyer/buyers agent to verify all dimensions. Sold as-is, seller will make no repairs. Solid structure with water/sewer connections. Great end user and/or flip possibility.
-
2026-05-12$124,900 Active
Show marketing remark (274 chars)
Investor special. 2 bedroom, 1 bath home with garage. Cash terms only. All dimensions are approximate. Buyer/buyers agent to verify all dimensions. Sold as-is, seller will make no repairs. Solid structure with water/sewer connections. Great end user and/or flip possibility.
-
2026-05-11historical $124,900 274-char remark
Show marketing remark (274 chars)
Investor special. 2 bedroom, 1 bath home with garage. Cash terms only. All dimensions are approximate. Buyer/buyers agent to verify all dimensions. Sold as-is, seller will make no repairs. Solid structure with water/sewer connections. Great end user and/or flip possibility.
-
1989-06-23soldstatus $54,900
-
1976-08-01soldstatus $23,500
ⓘ Source: listings_history table (triggers on properties + properties_extension) + one-shot
backfill from property_details.listing_events for pre-trigger history.
Tax reassessment forecast MI · Partial reset (capped growth)
- Current annual tax
- $3,423 · $285/mo
- Projected year-2 tax
- $3,423 · $285/mo
- Expected delta
- $0/yr ($0/mo · 0.0%)
ⓘ Screening estimate from a state-policy table — verify with the county assessor before closing.
Climate risk First Street
- Flood 4/10 Moderate FEMA zone X (unshaded) · 22% chance over 30 yrs
- Wildfire 1/10 Low
- Heat 2/10 Low 7 d/yr ≥96°F today · 15 d/yr by 30 yrs out
- Wind 2/10 Low
- Air quality 3/10 Moderate 2 unhealthy d/yr today · 4 by 30 yrs out
Nearby sold comps map
Loading sold comps map…
Walkable amenities ~0.75 mi
Loading nearby amenities…
Taxation est. · year 1
- Rental income
- $17,142
- − Mortgage interest
- −$6,996
- − Property taxes
- −$3,423
- − Insurance
- −$624
- − Repairs & maintenance
- −$1,371
- − Management
- −$1,371
- − Depreciation
- −$3,633
- Taxable loss
- −$278
- Est. tax savings @ 24.0%
- +$67
- After-tax cash flow
- $1,702/yr
For passive investors: Depreciation is non-cash, so a rental often shows a tax loss while cash-flowing — sheltering income. Rental losses are passive: they offset passive income freely, and up to $25,000/yr can offset ordinary (W-2) income if you actively participate and your MAGI is under $100k (phasing out to $0 by $150k); unused losses carry forward. On sale, claimed depreciation is recaptured at up to 25%, and gains may owe capital-gains tax (a 1031 exchange can defer both). Figures are a year-1 estimate at your 24.0% rate — not tax advice; consult a CPA.
Schools (NCES district)
- District
- Waterford School District
- NCES district ID
- 2635310
- Math proficiency
- 26% ▼ -5.00%
- Reading proficiency
- 42% ▼ -1.00%
- Median HH income
- $55,581
- Composite
- 29.99/100
- National rank
- #6364
- State rank
- #285 of 540 in MI
Livability — Orchard Lake Village
- Score
- 65/100
- State rank
- #465
- US rank
- #13055
Category grades
Schools grade is shown separately in the Schools card above.
Census & demographics
- County
- Oakland County · 1,009,092 people
- City population
- 17,043
- Metro
- Detroit-Warren-Dearborn, MI
- Population (ZIP)
- 20,960
- Household income
- $74,788
- Rent vs Own
- Severe rent burden
- 574.0
Population outlook (Oakland County) Hauer SSP2
- Today (2025)
- 1,335,747 people
- By 2030
- 1,375,100 · +2.9%
- By 2040
- 1,435,385 · +7.5%
- By 2050
- 1,469,250 · +10.0%
- By 2075
- 1,531,946 · +14.7%
- By 2100
- 1,450,485 · +8.6%
Race, ethnicity, and origin ACS 2023
- Neighborhood character
- Predominantly White (81%)
- Race & ethnicity
- White 81% Two or more races 7% Hispanic / Latino 6% Black 6% Asian 3%
- Hispanic origin (detail)
- Mexican 5%
- Common ancestry
- Romanian 11% Subsaharan African 5% Slovak 4%
- Foreign-born
- 7% · Canada
- Languages at home
- 90% English-only · Russian/Polish/Slavic 4% Spanish 2% Other Asian/Pacific 1%
Political lean MEDSL · Oakland
- 2024 margin
- D (+10.6) · D 54.4% · R 43.8% · Other 1.9%
- 2008→2024 swing
- -3.9pp toward R · 2008: 14.5pp · 2024: 10.6pp
- All cycles
- 2024: D+10.6 2020: D+14.1 2016: D+8.1 2012: D+8.1 2008: D+14.5
Not yet ingested
- Civics
- —
Market trends
- HPI YoY
- ▼ -226.28%
- Current HPI
- 201.2139
- Rent YoY
- —
- Metro
- Detroit-Warren-Dearborn, MI
- State GDP YoY
- ▲ 1.37%
- F500 in state
- 28
Industry mix (Fortune 500 HQ in MI)
| Industry | F500 HQs | Revenue |
|---|---|---|
| Automotive Parts | 3 | $48B |
|
||
| Automotive | 2 | $372B |
|
||
| Chemicals | 1 | $45B |
|
||
| Automotive Retail | 1 | $29B |
|
||
| Healthcare / Medical Devices | 1 | $23B |
|
||
| Automotive Technology | 1 | $20B |
|
||
Price history
+431.5% since first listed7 events — show timeline
- 2026-05-14 Pending — MiRealSource-MiMLS
- 2026-05-14 Pending — REALCOMP
- 2026-05-12 Listed $124,900 MiRealSource-MiMLS
- 2026-05-12 Listed $124,900 REALCOMP
- 2026-05-11 Coming Soon $124,900 MiRealSource-MiMLS
- 1989-06-23 Sold (Public Records) $54,900 Public Records
- 1976-08-01 Sold (Public Records) $23,500 Public Records
Property tax history
+4.8%/yrLatest (2025): $3,423 · +41.4% YoY. Source: county tax records.
Cash-flow waterfall
monthlySold comps — $/sqft
last 12 mo · ≤1 miLoading sold comps…