963 W Granite Dr · Rolling Hills, CA
Flood risk 1/10 · Minimal
- FEMA flood zone
- X (unshaded)
- Chance of flooding over 30 yrs
- 0.0%
- Est. flood insurance / yr
- $507 – $1,088
Fire risk 9/10 · Severe
- Est. fire insurance / yr
- $659 – $1,223
Heat risk 7/10 · Major
- Hot days now (above 106°F)
- 4 days/yr
- Hot days in 30 yrs
- 10 days/yr
Wind risk 1/10 · Minimal
- Chance of severe wind over 30 yrs
- —
Air-quality risk 10/10 · Severe
- Unhealthy air days now
- 44 days/yr
- Unhealthy air days in 30 yrs
- 51 days/yr
Risk factors via First Street. Map © Google.
Why this score? — see what drove the D- grade
The composite is a weighted blend of 9 inputs, each scored 0–100. Each bar is that input's sub-score; the figure is the points it added to the 100-point composite (weight × sub-score).
- ARV discount +15.0/15.0
- Cash flow +7.5/30.0
- Schools +4.2/10.0
- Livability +2.8/5.0
- Rent growth +2.5/5.0
- Condition / age +2.5/5.0
- 1% rule +2.2/10.0
- DSCR +1.6/10.0
- Appreciation +0.0/10.0
$470,000
🖨 Deal sheet 📄 Offer letter ✓ Due diligence
Listing remarks MLS
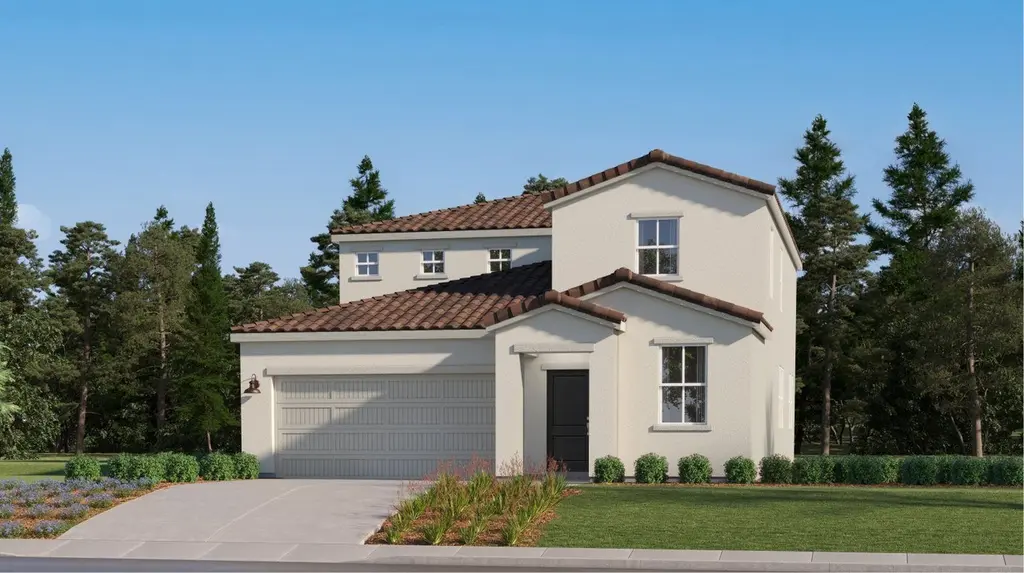
This new two-story home is ready for modern lifestyles. An open-concept layout combines the kitchen, living and dining areas for enhanced multitasking and transitions with a secluded office on the first floor. A bedroom at the back boasts convenient access to a spacious and flexible family room. On the second level are four additional bedrooms, including the lavish owner's suite toward the back of the home, offering direct access to a spa-inspired bathroom and generous walk-in closet.
Key facts
- Secluded office
- Flexible family room
- Open-concept layout
Tags
Neighborhood map
What this means for you Summary
Snapshot
- This is a 5-bed/3.5-bath single-family listed at $470k.
Deal economics
- At list price, monthly cash flow is $-580 ($-7k/yr) — negative.
- To cash-flow at today's rent, offer at most $386k (17.9% below list).
- To meet the 1% rule (rent ≥ 1% of price), the offer needs to be $338k (28.2% below list).
- Recommended offer: $338k (28.2% below list) — sets the bar for 1% rule.
- Cap rate 4.8% vs local median 3.4% in Rolling Hills — top-decile yield for the area; either an underpriced asset or a hidden risk that comps aren't pricing in. Stress-test before assuming the spread holds.
Location & tenants
- Location reads 56/100 on livability (#809 in CA) — a working-class tenant base; expect higher turnover. Strengths: crime A+, employment A+; Watch: schools D+, housing D, amenities F.
- Golden Valley Unified (town): math 38% / reading 55% proficiency, ranked #151 of 517 in CA (top 29%) — families likely to look elsewhere, expect single-tenant / working-renter base with shorter leases.
- Market conditions: 420 active listings in the ZIP; 5 comparable units currently listed for rent nearby; rentals at typical pace (median 24d on market — plan ~3-4 weeks tenant-placement turnaround); 40% of comp listings sitting > 30 days — soft ceiling on asking rent; high-income renter base; 1,346 units permitted in Madera County in 2024 (8 in 5+ unit buildings).
- This rent runs 30% of the median local income ($133k/yr) — at the standard rent-burdened threshold; future hikes will face affordability resistance.
Forward outlook
- Local home prices are declining (-3.0%/yr); year-one equity from $3k of loan paydown is wiped out by about $14k of value loss. Plan a longer hold.
- Madera County population projected at +6% by 2050 — modest demand growth; plan on rents tracking national, not racing it.
Negotiation context
- It's been on market 105 days — a 9% lower offer ($428k) is reasonable based on typical stale-listing flexibility.
Risks & watch-outs
- Climate carrying-cost: severe wildfire risk; extreme-heat days projected 4→10/yr by 2055 (HVAC capex compounding) — expect insurance premiums to compound above CPI over the hold.
Questions for the listing agent
- What do current leases actually rent for vs. the listed asking? Can we see a recent rent roll and the last 12 months of T-12 income?
- It's been on market 105 days. Have you received any prior offers? Is the seller open to a 28% concession, seller financing, or rate buy-down credit?
- Why hasn't it sold? Are there any deal-killer items the seller is aware of (foundation, flood, title, zoning, code violations)?
- Is there a deadline driving the sale (1031 exchange, divorce, estate, relocation)? That informs how much negotiation room exists.
- Schools are D-rated, which usually means shorter tenancies and higher turnover. Who's the typical renter profile here, and what's been the actual vacancy rate?
- The area grade is low — what's the realistic commute time and amenity access for the typical tenant pool here? Any planned neighborhood developments (good or bad) we should know about?
- What's the average days-on-market for RENTAL listings here right now (not sales)? A rising rental-DOM trend means longer vacancies and softer asking-rent achievability than the comps imply.
- What's the recent tenant-quality profile in this submarket — average credit score on applications, eviction rate, late-payment / NSF rate, and stable-employment percentage? A property-management company in the area should have these aggregated.
- How much new for-sale + rental construction is in the pipeline within 1–3 miles? Heavy new supply typically softens prices + rents 12–24 months out; constrained supply supports both.
Investment metrics
- 1% rule
- 0.72% ✗
- Cap rate
- 4.81%
- Cash-on-cash
- -5.29%
- DSCR
- 0.76
- GRM
- 11.6
CMA / ARV
- ARV (median comp)
- $569,065
- List price
- $470,000
- Delta
- -17.41%
- Verdict
- UNDERPRICED
- Comps
- 20 within 1.0 mi
Show comp detail 12 sales within ~0.75 mi
| Address | Dist | Beds/Ba | Sqft | Sold | Price | $/sf | Match |
|---|---|---|---|---|---|---|---|
| 1235 Traverse S | 0.35mi | 4/3.0 (-1) | 2,436 (-4%) | 6mo | $552,550 | $227 | 65 |
| 1264 Cathedral Ct S | 0.44mi | 4/3.0 (-1) | 2,436 (-4%) | 3mo | $560,548 | $230 | 64 |
| 846 Traverse Dr S | 0.58mi | 4/3.0 (-1) | 2,508 (-1%) | 3mo | $592,690 | $236 | 62 |
| 1276 Catherdral Ct S | 0.48mi | 4/3.0 (-1) | 2,436 (-4%) | 3mo | $541,950 | $222 | 61 |
| 856 Traverse Dr S | 0.57mi | 4/3.0 (-1) | 2,430 (-4%) | 1mo | $567,900 | $234 | 59 |
| 1158 Magnolia Ct W | 0.38mi | 4/3.0 (-1) | 2,436 (-4%) | 13mo | $525,950 | $216 | 58 |
| 1234 Talus Way S | 0.59mi | 4/3.0 (-1) | 2,436 (-4%) | 2mo | $551,216 | $226 | 57 |
| 1268 Traverse Dr S | 0.41mi | 4/3.0 (-1) | 2,436 (-4%) | 13mo | $541,560 | $222 | 57 |
| 1186 Magnolia Ct W | 0.43mi | 4/3.0 (-1) | 2,436 (-4%) | 13mo | $553,066 | $227 | 55 |
| 1124 Sophie Dr W | 0.71mi | 4/3.0 (-1) | 2,652 (+5%) | 1mo | $792,400 | $299 | 52 |
| 1039 Compass Dr W | 0.60mi | 4/2.5 (-1) | 2,240 (-12%) | 2mo | $479,999 | $214 | 42 |
| 946 Talus Way S | 0.75mi | 4/3.5 (-1) | 2,782 (+10%) | 10mo | $770,100 | $277 | 36 |
Match score weights: distance 35% · size 25% · config 20% · recency 20%. Top-matched comps best support the ARV.
Projected returns pro-forma
-3.0% appreciation · 3.0% rent growth · sell at horizon
- IRR
- -25.3%
- Equity multiple
- 0.14×
- Total profit
- $-113,069
- Equity at exit
- $70,079
- IRR
- -21.4%
- Equity multiple
- -0.11×
- Total profit
- $-145,842
- Equity at exit
- $40,637
Cash invested: $131,600 (down + closing). Projections, not guarantees.
Landlord ↔ Tenant lean methodology
- Overall (STATE)
- 18 Strongly Tenant-Friendly
- State California
- 18 Strongly Tenant-Friendly · D+13
- County
- — inherits STATE
- City
- — inherits STATE
ZIP-level market 93636
- Active inventory
- 420
- Price-to-rent
- 11.6×
Monthly cashflow live
- Estimated rent
- $3,377 high interval (Pro) →
- Mortgage (P&I)
- −$2,465
- Tax est. 1.5%
- −$588 /mo · $7,050/yr
- Insurance
- −$196
- HOA
- −$0
- Vacancy / Maint / Mgmt
- −$709
- Net cashflow
- $-580
Break-even live
UW: 25.0% down · 7.5% · 30yr · 1.5% tax · 5.0% vac · 8.0% maint · 8.0% mgmt
Financing live
Cash to close
- Down payment
- $117,500
- Closing costs
- $14,100
- Reserves months
- —
- Total cash needed
- —
Loan-product check · same deal, 3 products live
Conventional
25% down · 7.5% · 30yr
- Down + closing
- —
- Monthly P&I
- —
- Monthly cashflow
- —
- DSCR
- —
- Eligible?
- —
Personal DTI + credit; lowest rate.
DSCR
20% down · 8.5% · 30yr
- Down + closing
- —
- Monthly P&I
- —
- Monthly cashflow
- —
- DSCR
- —
- Eligible?
- —
No personal income docs; deal must DSCR.
Hard money
10% down · 12.0% · 12mo
- Down + closing
- —
- Monthly P&I
- —
- Monthly cashflow
- —
- DSCR
- —
- Eligible?
- —
Short-term bridge; refi at stabilization.
Rent comps 5 comps
| Address | Beds | Baths | Sqft | Rent | $/sqft | DOM | Units | Dist |
|---|---|---|---|---|---|---|---|---|
| 1027 Deerhorn Dr W Madera, CA | 4.0 | 2.0 | 1755 | $2,695 | $1.54 | 44d | 1 | 0.64mi |
| 997 Pioneer Dr W Madera, CA | 4.0 | 3.0 | 2103 | $2,950 | $1.40 | 44d | 1 | 0.66mi |
| 391 Maclure Ave W Madera, CA | 4.0 | 2.0 | 2000 | $2,895 | $1.45 | 10d | 1 | 1.25mi |
| 493 S Crescent Ln Madera, CA | 4.0 | 2.0 | 2000 | $2,895 | $1.45 | 2d | 1 | 1.30mi |
| 463 S Crescent Ln Madera, CA | 5.0 | 3.0 | 2480 | $3,200 | $1.29 | 24d | 1 | 1.30mi |
Listing history 16 events
-
2026-06-18days on market $470,000 Active 105 DOM
-
2026-06-17days on market $470,000 Active 104 DOM
-
2026-06-16days on market $470,000 Active 103 DOM
-
2026-06-15days on market $470,000 Active 102 DOM
-
2026-06-13days on market $470,000 Active 100 DOM
-
2026-06-13days on market $470,000 Active 99 DOM
-
2026-06-10days on market $470,000 Active 97 DOM
-
2026-06-09days on market $470,000 Active 96 DOM
-
2026-06-08days on market $470,000 Active 95 DOM
-
2026-06-07days on market $470,000 Active 94 DOM
-
2026-06-05days on market $470,000 Active 91 DOM
-
2026-06-03days on market $470,000 Active 90 DOM
-
2026-06-02days on market $470,000 Active 89 DOM
-
2026-06-01days on market $470,000 Active 88 DOM
-
2026-05-31days on market $470,000 Active 87 DOM
-
2026-03-05$470,000 Active 489-char remark
Show marketing remark (489 chars)
This new two-story home is ready for modern lifestyles. An open-concept layout combines the kitchen, living and dining areas for enhanced multitasking and transitions with a secluded office on the first floor. A bedroom at the back boasts convenient access to a spacious and flexible family room. On the second level are four additional bedrooms, including the lavish owner's suite toward the back of the home, offering direct access to a spa-inspired bathroom and generous walk-in closet.
ⓘ Source: listings_history table (triggers on properties + properties_extension) + one-shot
backfill from property_details.listing_events for pre-trigger history.
Climate risk First Street
- Flood 1/10 Low FEMA zone X (unshaded) · 0% chance over 30 yrs
- Wildfire 9/10 Extreme
- Heat 7/10 Severe 4 d/yr ≥106°F today · 10 d/yr by 30 yrs out
- Wind 1/10 Low
- Air quality 10/10 Extreme 44 unhealthy d/yr today · 51 by 30 yrs out
Nearby sold comps map
Loading sold comps map…
Walkable amenities ~0.75 mi
Loading nearby amenities…
Taxation est. · year 1
- Rental income
- $40,523
- − Mortgage interest
- −$26,327
- − Property taxes
- −$7,050
- − Insurance
- −$2,350
- − Repairs & maintenance
- −$3,242
- − Management
- −$3,242
- − Depreciation
- −$13,673
- Taxable loss
- −$15,361
- Est. tax savings @ 24.0%
- +$3,687
- After-tax cash flow
- $-3,277/yr
For passive investors: Depreciation is non-cash, so a rental often shows a tax loss while cash-flowing — sheltering income. Rental losses are passive: they offset passive income freely, and up to $25,000/yr can offset ordinary (W-2) income if you actively participate and your MAGI is under $100k (phasing out to $0 by $150k); unused losses carry forward. On sale, claimed depreciation is recaptured at up to 25%, and gains may owe capital-gains tax (a 1031 exchange can defer both). Figures are a year-1 estimate at your 24.0% rate — not tax advice; consult a CPA.
Schools (NCES district)
- District
- Golden Valley Unified
- NCES district ID
- 0600068
- Math proficiency
- 38% ▼ -8.00%
- Reading proficiency
- 55% ▼ -5.00%
- Median HH income
- $74,067
- Composite
- 42.12/100
- National rank
- #3313
- State rank
- #151 of 517 in CA
Livability — Rolling Hills
- Score
- 56/100
- State rank
- #809
- US rank
- #22874
Category grades
Schools grade is shown separately in the Schools card above.
Census & demographics
- County
- Madera County · 133,170 people
- Metro
- Madera, CA
- Population (ZIP)
- 15,294
- Household income
- $133,274
- Rent vs Own
- Severe rent burden
- 66.0
Population outlook (Madera County) Hauer SSP2
- Today (2025)
- 157,915 people
- By 2030
- 159,604 · +1.1%
- By 2040
- 163,454 · +3.5%
- By 2050
- 167,071 · +5.8%
- By 2075
- 171,182 · +8.4%
- By 2100
- 162,781 · +3.1%
Race, ethnicity, and origin ACS 2023
- Neighborhood character
- Diverse neighborhood (Simpson 0.60)
- Race & ethnicity
- White 48% Hispanic / Latino 41% Two or more races 20% Native American 5% Asian 4%
- Hispanic origin (detail)
- Mexican 38%
- Common ancestry
- Italian 6% Russian 3% Slovak 1%
- Foreign-born
- 11% · Canada, Vietnam
- Languages at home
- 75% English-only · Spanish 23% Other Indo-European 1% Other Asian/Pacific 1%
Political lean MEDSL · Madera
- 2024 margin
- Strong R (+20.8) · D 38.4% · R 59.2% · Other 2.4%
- 2008→2024 swing
- -7.5pp toward R · 2008: -13.3pp · 2024: -20.8pp
- All cycles
- 2024: R+20.8 2020: R+11.6 2016: R+17.3 2012: R+19.4 2008: R+13.3
Not yet ingested
- Civics
- —
Market trends
- HPI YoY
- ▼ -345.88%
- Current HPI
- 303.0675
- Rent YoY
- —
- Metro
- Madera, CA
- State GDP YoY
- ▲ 3.21%
- F500 in state
- 116
Industry mix (Fortune 500 HQ in CA)
| Industry | F500 HQs | Revenue |
|---|---|---|
| Technology | 27 | $1,492B |
|
||
| Financial Services | 3 | $174B |
|
||
| Retail | 3 | $44B |
|
||
| Insurance | 3 | $26B |
|
||
| Media / Entertainment | 2 | $115B |
|
||
| Pharmaceuticals / Biotech | 2 | $62B |
|
||
Price history
1 event — show timeline
- 2026-03-05 Listed $470,000 Zillow
Cash-flow waterfall
monthlySold comps — $/sqft
last 12 mo · ≤1 miLoading sold comps…