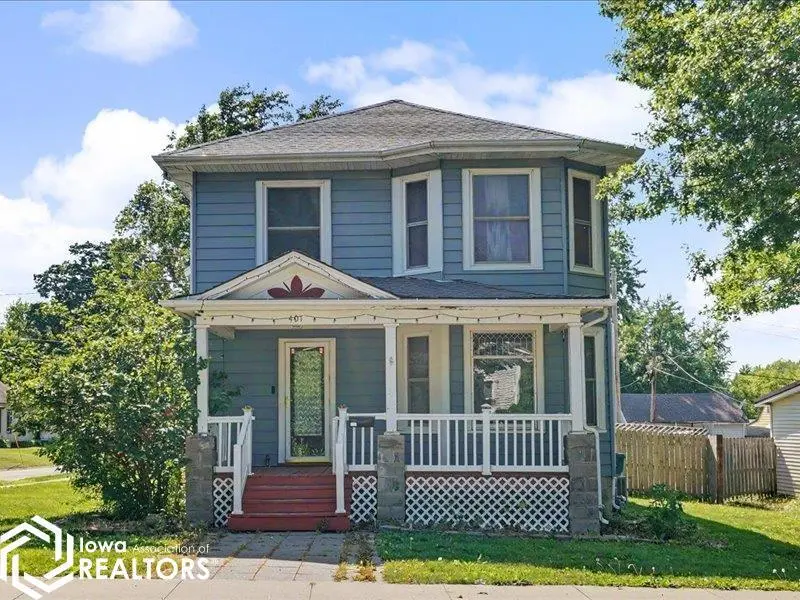
401 N Walnut St N · New London, IA
Flood risk 1/10 · Minimal
- FEMA flood zone
- X (unshaded)
- Chance of flooding over 30 yrs
- 0.0%
- Est. flood insurance / yr
- $473 – $860
Fire risk 3/10 · Minor
- Est. fire insurance / yr
- $902 – $1,676
Heat risk 3/10 · Minor
- Hot days now (above 106°F)
- 7 days/yr
- Hot days in 30 yrs
- 15 days/yr
Wind risk 2/10 · Minimal
- Chance of severe wind over 30 yrs
- —
Air-quality risk 2/10 · Minimal
- Unhealthy air days now
- 1 days/yr
- Unhealthy air days in 30 yrs
- 2 days/yr
Risk factors via First Street. Map © Google.
Why this score? — see what drove the C- grade
The composite is a weighted blend of 9 inputs, each scored 0–100. Each bar is that input's sub-score; the figure is the points it added to the 100-point composite (weight × sub-score).
- ARV discount +15.0/15.0
- Cash flow +10.4/30.0
- Appreciation +6.2/10.0
- Schools +5.5/10.0
- Livability +3.8/5.0
- 1% rule +3.5/10.0
- DSCR +3.0/10.0
- Rent growth +2.5/5.0
- Condition / age +2.5/5.0
$142,500
🖨 Deal sheet (PDF) 📄 Offer letter ✓ Due diligence
Listing remarks
Welcome to your cozy new haven right in the heart of New London, a move-in-ready, character-filled two-story home that wraps you in comfort the moment you step inside. The main level radiates warmth with its sunlit, inviting living spaces, beautifully grounded by original natural woodwork, vintage pocket doors, and elegant glass French doors that lead into an intimate dining room made for memorable gatherings. Upstairs, three peaceful bedrooms provide a quiet escape with plenty of closet space, while the enclosed back porch transforms into the ultimate snug retreat for movie nights, complete with a built-in projector. There is a generous 24x24 detached garage and all appliances staying, thi
Key facts
- Natural woodwork
- Enclosed back porch
- Built-in projector
Tags
Property features AI
Exterior
- Parking: Detached 2-car garage
- Utilities: Public water; Public sewer
- Home design: Two-story single-family home; Residential property
- Construction: Vinyl siding
- Exterior features: Lot dimensions approximately 60 x 120
Interior
- Bathrooms: 2 full bathrooms
- Heating & cooling: Central air conditioning; Forced-air heating
- Interior features: Basement present
Neighborhood map
What this means for you Summary
Snapshot
- This is a 3-bed/2.0-bath single-family listed at $142k.
Deal economics
- At list price, monthly cash flow is $-75 ($-895/yr) — negative.
- To cash-flow at today's rent, offer at most $129k (9.2% below list).
- To meet the 1% rule (rent ≥ 1% of price), the offer needs to be $121k (15.4% below list).
- Recommended offer: $121k (15.4% below list) — sets the bar for 1% rule.
Location & tenants
- Location reads 76/100 on livability (#188 in IA, #3,417 nationally) — a middle-class / working-renter tenant base. Strengths: crime A+, cost of living A+, housing A+; Watch: employment D+, amenities F, commute F.
- New London Community School District (rural): math 63% / reading 68% proficiency, ranked #194 of 289 in IA (top 67%) — acceptable for families but not a draw, mixed tenant base, ~2y average lease.
- Zoned schools: Clark Elementary School (math 62% / reading 62%, grade B, #363 of 616 statewide, top 62%, 289 students, 39% FRL); New London Jr-Sr High School (math 63% / reading 72%, grade B, #186 of 336 statewide, top 57%, 303 students, 40% FRL).
- Market conditions: 13 active listings in the ZIP; 30 units permitted in Henry County in 2024 (8 in 5+ unit buildings).
Forward outlook
- In year one you build about $4k of equity ($985 loan paydown + $4k appreciation (2.5% local appreciation)).
- Henry County population projected to shrink 9% by 2050 — rents likely to lag national; underwrite the cash flow, not the appreciation.
- At projected returns (2.5% appreciation + 3.0% rent growth), your $40k cash investment doubles in ~8 years — after that, you're playing with house money.
- By year 8, paydown + projected appreciation supports a ~$33k cash-out refi (75% LTV) — recoverable capital for the next deal without selling this one.
Negotiation context
- It's been on market 24 days — a 2% lower offer ($140k) is reasonable based on typical stale-listing flexibility.
- 5 sale attempts since 9y ago; this cycle's ask has dropped $8k (5%) from the opening price — seller is motivated, your offer sets the floor, not the list.
- Current owner paid $100k; 42% above their basis — modest negotiation headroom, anchor on the comps not their cost.
Risks & watch-outs
- Watch-outs: built in 1900 — expect roof / HVAC / electrical / plumbing capex.
Questions for the listing agent
- What do current leases actually rent for vs. the listed asking? Can we see a recent rent roll and the last 12 months of T-12 income?
- Built in 1900 — when were the roof, HVAC, electrical panel, plumbing, and water heater last replaced?
- Is there a deadline driving the sale (1031 exchange, divorce, estate, relocation)? That informs how much negotiation room exists.
- Schools are B-rated — typically a magnet for longer-tenancy family renters. What's the average tenant stay here, and is there a school-zone premium baked into asking?
- What's the average days-on-market for RENTAL listings here right now (not sales)? A rising rental-DOM trend means longer vacancies and softer asking-rent achievability than the comps imply.
- What's the recent tenant-quality profile in this submarket — average credit score on applications, eviction rate, late-payment / NSF rate, and stable-employment percentage? A property-management company in the area should have these aggregated.
- How much new for-sale + rental construction is in the pipeline within 1–3 miles? Heavy new supply typically softens prices + rents 12–24 months out; constrained supply supports both.
Investment metrics
- 1% rule
- 0.85% ✗
- Cap rate
- 5.66%
- Cash-on-cash
- -2.24%
- DSCR
- 0.90
- GRM
- 9.9
CMA / ARV
- ARV (on-the-fly)
- $210,328
- Comps found
- 7
Show comp detail 7 sales within ~0.75 mi
| Address | Dist | Beds/Ba | Sqft | Sold | Price | $/sf | Match |
|---|---|---|---|---|---|---|---|
| 202 N Pine St | 0.16mi | 2/1.5 (-1) | 1,604 (-7%) | 10mo | $195,000 | $122 | 66 |
| 106 E Wilson St | 0.33mi | 3/2.0 | 1,560 (-10%) | 14mo | $116,000 | $74 | 57 |
| 501 Sunset | 0.66mi | 3/2.0 | 1,672 (-3%) | 15mo | $384,130 | $230 | 51 |
| 409 S Chestnut St | 0.57mi | 2/1.5 (-1) | 1,565 (-9%) | 4mo | $126,500 | $81 | 48 |
| 502 S Elm St | 0.62mi | 3/1.5 | 1,939 (+12%) | 3mo | $164,000 | $85 | 46 |
| 106 Hickory Cir. Cir | 0.65mi | 3/2.5 | 1,640 (-5%) | 22mo | $357,900 | $218 | 41 |
| 307 Cottonwood St | 0.60mi | 2/1.0 (-1) | 1,512 (-12%) | 14mo | $195,000 | $129 | 31 |
Match score weights: distance 35% · size 25% · config 20% · recency 20%. Top-matched comps best support the ARV.
Projected returns pro-forma
2.46% appreciation · 3.0% rent growth · sell at horizon
- IRR
- 3.8%
- Equity multiple
- 1.21×
- Total profit
- $8,437
- Equity at exit
- $59,795
- IRR
- 7.3%
- Equity multiple
- 2.05×
- Total profit
- $41,889
- Equity at exit
- $88,953
Cash invested: $39,900 (down + closing). Projections, not guarantees.
Landlord ↔ Tenant lean methodology
- Overall (STATE)
- 83 Strongly Landlord-Friendly
- State Iowa
- 83 Strongly Landlord-Friendly · R+6
- County
- — inherits STATE
- City
- — inherits STATE
ZIP-level market 52645
- Home prices YoY
- 1.3%
- Active inventory
- 13
- Price-to-rent
- 9.9×
Monthly cashflow live
- Estimated rent
- $1,205 medium interval (Pro) →
- Mortgage (P&I)
- −$747
- Tax from tax record
- −$220 /mo · $2,642/yr
- Insurance
- −$59
- HOA
- −$0
- Vacancy / Maint / Mgmt
- −$253
- Net cashflow
- $-75
Break-even live
Sensitivity live
| Price | -10% $6 | -5% $-34 | +0% $-75 | +5% $-115 | +10% $-155 |
|---|---|---|---|---|---|
| Rent | -10% $-170 | -5% $-122 | +0% $-75 | +5% $-27 | +10% $21 |
| Rate | -1.0pp $-3 | -0.5pp $-38 | base $-75 | +0.5pp $-112 | +1.0pp $-149 |
UW: 25.0% down · 7.5% · 30yr · 1.5% tax · 5.0% vac · 8.0% maint · 8.0% mgmt
Financing live
Cash to close
- Down payment
- $35,625
- Closing costs
- $4,275
- Reserves months
- —
- Total cash needed
- —
Loan-product check · same deal, 3 products live
Conventional
25% down · 7.5% · 30yr
- Down + closing
- —
- Monthly P&I
- —
- Monthly cashflow
- —
- DSCR
- —
- Eligible?
- —
Personal DTI + credit; lowest rate.
DSCR
20% down · 8.5% · 30yr
- Down + closing
- —
- Monthly P&I
- —
- Monthly cashflow
- —
- DSCR
- —
- Eligible?
- —
No personal income docs; deal must DSCR.
Hard money
10% down · 12.0% · 12mo
- Down + closing
- —
- Monthly P&I
- —
- Monthly cashflow
- —
- DSCR
- —
- Eligible?
- —
Short-term bridge; refi at stabilization.
Listing history 31 events
-
2026-06-21days on market $142,500 Active 24 DOM
-
2026-06-21days on market $142,500 Active 23 DOM
-
2026-06-18price $142,500 Active 21 DOM
-
2026-06-18days on market $150,000 Active 21 DOM
-
2026-06-17days on market $150,000 Active 20 DOM
-
2026-06-16days on market $150,000 Active 19 DOM
-
2026-06-15days on market $150,000 Active 18 DOM
-
2026-06-13days on market $150,000 Active 16 DOM
-
2026-06-12days on market $150,000 Active 15 DOM
-
2026-06-09days on market $150,000 Active 12 DOM
-
2026-06-08days on market $150,000 Active 11 DOM
-
2026-06-07days on market $150,000 Active 10 DOM
-
2026-06-05days on market $150,000 Active 8 DOM
-
2026-06-04days on market $150,000 Active 6 DOM
-
2026-06-02days on market $150,000 Active 5 DOM
-
2026-06-01days on market $150,000 Active 4 DOM
-
2026-05-31days on market $150,000 Active 3 DOM
-
2026-05-31days on market $150,000 Active 2 DOM
-
2026-05-28$150,000 Active
-
2025-11-12price $158,000
-
2025-10-20price $163,500
-
2025-09-25price $168,000
-
2025-09-11$173,000 Active
-
2022-01-11soldstatus $100,000
-
2021-03-10$117,000
-
2017-11-29soldstatus $110,000
-
2017-11-26soldstatus $110,000
-
2017-11-09price $119,000
-
2017-07-13$110,000
-
2017-01-13$119,000
-
2011-11-21soldstatus $97,000
ⓘ Source: listings_history table (triggers on properties + properties_extension) + one-shot
backfill from property_details.listing_events for pre-trigger history.
Tax reassessment forecast IA · Partial reset (capped growth)
- Current annual tax
- $2,642 · $220/mo
- Projected year-2 tax
- $2,642 · $220/mo
- Expected delta
- $0/yr ($0/mo · 0.0%)
ⓘ Screening estimate from a state-policy table — verify with the county assessor before closing.
Climate risk First Street
- Flood 1/10 Low FEMA zone X (unshaded) · 0% chance over 30 yrs
- Wildfire 3/10 Moderate
- Heat 3/10 Moderate 7 d/yr ≥106°F today · 15 d/yr by 30 yrs out
- Wind 2/10 Low
- Air quality 2/10 Low 1 unhealthy d/yr today · 2 by 30 yrs out
Nearby sold comps map
Loading sold comps map…
Walkable amenities ~0.75 mi
Loading nearby amenities…
Taxation est. · year 1
- Rental income
- $14,464
- − Mortgage interest
- −$7,982
- − Property taxes
- −$2,642
- − Insurance
- −$712
- − Repairs & maintenance
- −$1,157
- − Management
- −$1,157
- − Depreciation
- −$4,145
- Taxable loss
- −$3,332
- Est. tax savings @ 24.0%
- +$800
- After-tax cash flow
- $-95/yr
For passive investors: Depreciation is non-cash, so a rental often shows a tax loss while cash-flowing — sheltering income. Rental losses are passive: they offset passive income freely, and up to $25,000/yr can offset ordinary (W-2) income if you actively participate and your MAGI is under $100k (phasing out to $0 by $150k); unused losses carry forward. On sale, claimed depreciation is recaptured at up to 25%, and gains may owe capital-gains tax (a 1031 exchange can defer both). Figures are a year-1 estimate at your 24.0% rate — not tax advice; consult a CPA.
Schools (NCES district)
- District
- New London Community School District
- NCES district ID
- 1920460
- Math proficiency
- 63% ▲ 2.00%
- Reading proficiency
- 68% ▲ 5.00%
- Median HH income
- $46,710
- Composite
- 55.31/100
- National rank
- #1260
- State rank
- #194 of 289 in IA
Livability — New London
- Score
- 76/100
- State rank
- #188
- US rank
- #3417
Category grades
Schools grade is shown separately in the Schools card above.
Census & demographics
- Census place
- New London, IA
- Population (ZIP)
- 3,472
Population outlook (Henry County) Hauer SSP2
- Today (2025)
- 19,583 people
- By 2030
- 19,271 · -1.6%
- By 2040
- 18,505 · -5.5%
- By 2050
- 17,796 · -9.1%
- By 2075
- 16,821 · -14.1%
- By 2100
- 15,549 · -20.6%
Race, ethnicity, and origin ACS 2023
- Neighborhood character
- Predominantly White (94%)
- Race & ethnicity
- White 94% Two or more races 3% Hispanic / Latino 3%
- Common ancestry
- Portuguese 5% Iranian 2% Lithuanian 2%
- Foreign-born
- 0%
- Languages at home
- 99% English-only · Spanish 1% Other Indo-European 1%
Political lean MEDSL · Henry
- 2024 margin
- Solid R (+36.0) · D 31.3% · R 67.3% · Other 1.5%
- 2008→2024 swing
- -30.9pp toward R · 2008: -5.0pp · 2024: -36.0pp
- All cycles
- 2024: R+36.0 2020: R+32.4 2016: R+30.9 2012: R+6.0 2008: R+5.0
Not yet ingested
- Civics
- —
Market trends
- HPI YoY
- ▲ 2.46%
- Current HPI
- 197.8445
- Rent YoY
- —
- Metro
- —
- State GDP YoY
- ▲ 2.48%
- F500 in state
- 4
Industry mix (Fortune 500 HQ in IA)
| Industry | F500 HQs | Revenue |
|---|---|---|
| Financial Services | 1 | $16B |
|
||
| Retail / Convenience | 1 | $15B |
|
||
Price history
+54.6% since first listed13 events — show timeline
- 2026-05-28 Listed $150,000 IAR
- 2025-11-12 Price Changed $158,000 IAR
- 2025-10-20 Price Changed $163,500 IAR
- 2025-09-25 Price Changed $168,000 IAR
- 2025-09-11 Listed $173,000 IAR
- 2022-01-11 Sold (Public Records) $100,000 Public Records
- 2021-03-10 Listed $117,000 IAR
- 2017-11-29 Sold (Public Records) $110,000 Public Records
- 2017-11-26 Sold (MLS) $110,000 ICAARMLS
- 2017-11-09 Price Changed $119,000 ICAARMLS
- 2017-07-13 Listed $110,000 ICAARMLS
- 2017-01-13 Listed $119,000 ICAARMLS
- 2011-11-21 Sold (Public Records) $97,000 Public Records
Property tax history
+3.1%/yrLatest (2025): $2,642 · +5.3% YoY. Source: county tax records.
Cash-flow waterfall
monthlySold comps — $/sqft
last 12 mo · ≤1 miLoading sold comps…