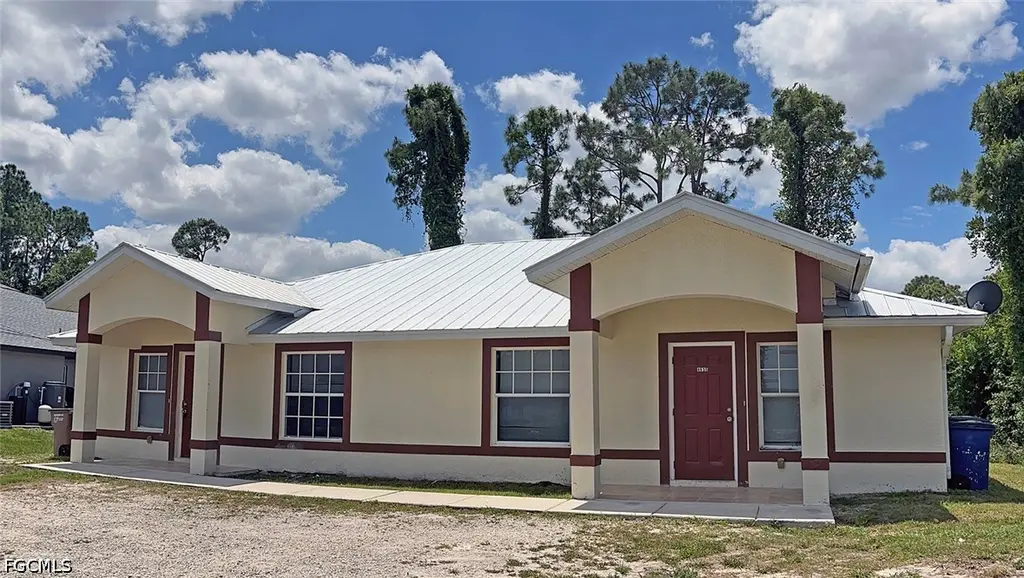
 Duplex
4653-4655 29th St SW · Lehigh Acres, FL
Flood risk 1/10 · Minimal
- FEMA flood zone
- X (unshaded)
- Chance of flooding over 30 yrs
- 0.0%
- Est. flood insurance / yr
- $507 – $1,088
Fire risk 5/10 · Moderate
- Est. fire insurance / yr
- $947 – $1,759
Heat risk 10/10 · Severe
- Hot days now (above 107°F)
- 7 days/yr
- Hot days in 30 yrs
- 29 days/yr
Wind risk 10/10 · Severe
- Chance of severe wind over 30 yrs
- 99.0%
Air-quality risk 2/10 · Minimal
- Unhealthy air days now
- 1 days/yr
- Unhealthy air days in 30 yrs
- 1 days/yr
Risk factors via First Street. Map © Google.
Why this score? — see what drove the C grade
The composite is a weighted blend of 9 inputs, each scored 0–100. Each bar is that input's sub-score; the figure is the points it added to the 100-point composite (weight × sub-score).
- Cash flow +20.3/30.0
- ARV discount +13.8/15.0
- DSCR +6.5/10.0
- 1% rule +5.0/10.0
- Schools +4.1/10.0
- Livability +3.0/5.0
- Condition / age +2.5/5.0
- Appreciation +0.8/10.0
- Rent growth +0.8/5.0
$349,000
🖨 Deal sheet 📄 Offer letter ✓ Due diligence
Multi-family units
County records classify this as Multi-Family (2-4 Unit). Listing-text estimate: 2 units. confirmed
Listing remarks MLS
INVESTORS OPPORTUNITY. FAIRLY WELL MAINTAINED. CLOSE TO SHOPPING, AND GREAT ACCESS TO FORT MYERS.
Key facts
- Tile floor
- Metal roof
- Ac units
Tags
Neighborhood map
What this means for you Summary
Snapshot
- This is a 2 × 2-bed/2.0-bath units multifamily listed at $349k.
Deal economics
- At list price, monthly cash flow is $449 ($5k/yr) — positive. Per door: $225/mo.
- The deal already cash-flows at list — no discount required.
- Meets the 1% rule at list price ($3k rent vs $349k).
- Cap rate 7.8% vs local median 4.7% in Lehigh Acres — top-decile yield for the area; either an underpriced asset or a hidden risk that comps aren't pricing in. Stress-test before assuming the spread holds.
Location & tenants
- Location reads 59/100 on livability (#826 in FL) — a working-class tenant base; expect higher turnover. Strengths: cost of living A+, housing A+; Watch: crime C-, employment D+, schools D-.
- Lee (suburban): math 47% / reading 50% proficiency, ranked #42 of 73 in FL (top 58%) — families likely to look elsewhere, expect single-tenant / working-renter base with shorter leases.
- Market conditions: Rents falling (-7.0%/yr); 292 active listings in the ZIP; 40 comparable units currently listed for rent nearby; rentals at typical pace (median 24d on market — plan ~3-4 weeks tenant-placement turnaround); 15,411 units permitted in Lee County in 2024 (4,686 in 5+ unit buildings).
- At $3,494/mo this rent would consume 69% of the median local household income ($61k/yr) (locally 1142% of renters already pay >50% of income on rent) — very limited rent-growth headroom before tenants either downsize or default.
Forward outlook
- Local home prices are declining (-3.0%/yr); year-one equity from $2k of loan paydown is wiped out by about $10k of value loss. Plan a longer hold.
- Lee County population projected at +44% by 2050 — long-run rental-demand tailwind backs the buy-and-hold thesis.
Negotiation context
- Only 6 days on market — expect competitive offers; lowballing is unlikely to land.
- Current owner paid $56k; list at $349k implies a 523% gain — meaningful room to come down on a strong offer.
Risks & watch-outs
- Climate carrying-cost: severe wind risk, 99% chance of damaging wind over 30y; moderate wildfire risk; extreme-heat days projected 7→29/yr by 2055 (HVAC capex compounding) — expect insurance premiums to compound above CPI over the hold.
Questions for the listing agent
- Can we see the unit-by-unit rent roll, current vacancy, and any below-market leases? What's the average tenancy length?
- What capital expenditures (roof, boiler, parking lot, exteriors) have been made in the last 5 years, and what's planned in the next 2?
- Is there a deadline driving the sale (1031 exchange, divorce, estate, relocation)? That informs how much negotiation room exists.
- Schools are D-rated, which usually means shorter tenancies and higher turnover. Who's the typical renter profile here, and what's been the actual vacancy rate?
- What's the average days-on-market for RENTAL listings here right now (not sales)? A rising rental-DOM trend means longer vacancies and softer asking-rent achievability than the comps imply.
- What's the recent tenant-quality profile in this submarket — average credit score on applications, eviction rate, late-payment / NSF rate, and stable-employment percentage? A property-management company in the area should have these aggregated.
- How much new apartment / multifamily construction is in the pipeline within 1–3 miles? Heavy new supply (>2% of stock underway) typically softens rents 12–24 months out; light construction supports rent growth.
Investment metrics
- 1% rule
- 1.00% ✓
- Cap rate
- 7.84%
- Cash-on-cash
- 5.51%
- DSCR
- 1.25
- GRM
- 8.3
CMA / ARV
- ARV (on-the-fly)
- $405,360
- Comps found
- 4
Show comp detail 4 sales within ~0.75 mi
| Address | Dist | Beds/Ba | Sqft | Sold | Price | $/sf | Match |
|---|---|---|---|---|---|---|---|
| 4653-4655 29th St SW | 0.00mi | 4/4.0 | 2,252 (0%) | 0mo | $349,000 | $155 | 100 |
| 4645/4647 30th St SW | 0.07mi | 4/4.0 | 2,280 (+1%) | 13mo | $450,000 | $197 | 84 |
| 4613/4615 29th St SW | 0.19mi | 4/4.0 | 2,512 (+12%) | 0mo | $419,000 | $167 | 72 |
| 1533/1535 Hightower Ave S | 0.65mi | 4/4.0 | 2,470 (+10%) | 12mo | $445,000 | $180 | 44 |
Match score weights: distance 35% · size 25% · config 20% · recency 20%. Top-matched comps best support the ARV.
Projected returns pro-forma
-3.0% appreciation · 0.0% rent growth · sell at horizon
- IRR
- -11.1%
- Equity multiple
- 0.61×
- Total profit
- $-38,201
- Equity at exit
- $52,037
- IRR
- -6.6%
- Equity multiple
- 0.63×
- Total profit
- $-36,045
- Equity at exit
- $30,175
Cash invested: $97,720 (down + closing). Projections, not guarantees.
Landlord ↔ Tenant lean methodology
- Overall (STATE)
- 87 Strongly Landlord-Friendly
- State Florida
- 87 Strongly Landlord-Friendly · R+3
- County
- — inherits STATE
- City
- — inherits STATE
ZIP-level market 33973
- Home prices YoY
- -3.4%
- Rents YoY
- -7.0%
- Active inventory
- 292
- Price-to-rent
- 16.6×
Monthly cashflow live
- Estimated rent
- $3,494 high interval (Pro) →
- Mortgage (P&I)
- −$1,830
- Tax from tax record
- −$336 /mo · $4,027/yr
- Insurance
- −$145
- HOA
- −$0
- Vacancy / Maint / Mgmt
- −$734
- Net cashflow
- $449
Break-even live
2-unit breakdown (identical units grouped — click to expand)
| Units | Beds | Baths | Est. rent |
|---|---|---|---|
| 2× units | 2 | 2 | $3,494 |
| #1 | 2 | 2 | $1,747 |
| #2 | 2 | 2 | $1,747 |
| Total (2 units) | $3,494 | ||
UW: 25.0% down · 7.5% · 30yr · 1.5% tax · 5.0% vac · 8.0% maint · 8.0% mgmt
Financing live
Cash to close
- Down payment
- $87,250
- Closing costs
- $10,470
- Reserves months
- —
- Total cash needed
- —
Loan-product check · same deal, 3 products live
Conventional
25% down · 7.5% · 30yr
- Down + closing
- —
- Monthly P&I
- —
- Monthly cashflow
- —
- DSCR
- —
- Eligible?
- —
Personal DTI + credit; lowest rate.
DSCR
20% down · 8.5% · 30yr
- Down + closing
- —
- Monthly P&I
- —
- Monthly cashflow
- —
- DSCR
- —
- Eligible?
- —
No personal income docs; deal must DSCR.
Hard money
10% down · 12.0% · 12mo
- Down + closing
- —
- Monthly P&I
- —
- Monthly cashflow
- —
- DSCR
- —
- Eligible?
- —
Short-term bridge; refi at stabilization.
Rent comps 40 comps
| Address | Beds | Baths | Sqft | Rent | $/sqft | DOM | Units | Dist |
|---|---|---|---|---|---|---|---|---|
| 4719 28th St SW Lehigh Acres, FL | 3.0 | 2.0 | 2000 | $1,850 | $0.93 | 23d | 1 | 0.14mi |
| 4720 29th St SW Unit 4722 Lehigh Acres, FL | 3.0 | 2.0 | 2394 | $2,400 | $1.00 | 23d | 1 | 0.15mi |
| 4660 26th St SW Unit 4662 Lehigh Acres, FL | 3.0 | 2.0 | 2246 | $1,700 | $0.76 | 19d | 1 | 0.18mi |
| 10575 Timber Creek Dr Fort Myers, FL | 3.0 | 3.0 | 2434 | $10,000 | $4.11 | 23d | 1 | 0.29mi |
| 4646 24th St SW Lehigh Acres, FL | 3.0 | 2.0 | 1600 | $1,600 | $1.00 | 23d | 1 | 0.30mi |
| 4614 25th St SW Lehigh Acres, FL | 3.0 | 2.0 | 2328 | $1,300 | $0.56 | 21d | 1 | 0.31mi |
| 10849 Timber Creek Dr Fort Myers, FL | 5.0 | 4.5 | 3357 | $4,000 | $1.19 | 23d | 1 | 0.41mi |
| 4734 22nd St SW Lehigh Acres, FL | 3.0 | 2.0 | 2349 | $1,850 | $0.79 | 23d | 1 | 0.43mi |
| 10525 Timber Creek Dr Fort Myers, FL | 4.0 | 3.0 | 2032 | $3,100 | $1.53 | 3d | 1 | 0.51mi |
| 10525 Timber Creek Dr Fort Myers, FL | 4.0 | 3.0 | 2032 | $3,100 | $1.53 | 14d | 1 | 0.51mi |
| 10798 Timber Creek Dr Fort Myers, FL | 3.0 | 3.0 | 2650 | $8,500 | $3.21 | 23d | 1 | 0.53mi |
| 4800 15th St SW Lehigh Acres, FL | 3.0 | 2.0 | 2522 | $1,800 | $0.71 | 21d | 1 | 0.53mi |
| 4806 24th St SW Lehigh Acres, FL | 3.0 | 2.0 | 2252 | $1,650 | $0.73 | 10d | 1 | 0.56mi |
| 4806 24th St SW Lehigh Acres, FL | 3.0 | 2.0 | 2252 | $1,650 | $0.73 | 3d | 1 | 0.56mi |
| 4743 14th St SW Lehigh Acres, FL | 3.0 | 2.0 | 2340 | $1,700 | $0.73 | 23d | 1 | 0.61mi |
| 4816 24th St SW Lehigh Acres, FL | 3.0 | 2.0 | 1730 | $1,800 | $1.04 | 23d | 1 | 0.62mi |
| 4816 24th St SW Lehigh Acres, FL | 3.0 | 2.0 | 1730 | $1,800 | $1.04 | 15d | 1 | 0.62mi |
| 4818 24th St SW Lehigh Acres, FL | 3.0 | 2.0 | 1730 | $1,800 | $1.04 | 23d | 1 | 0.62mi |
| 4541 21st St SW Lehigh Acres, FL | 3.0 | 2.0 | 2228 | $1,695 | $0.76 | 23d | 1 | 0.62mi |
| 14279 Winding Cedar Way Fort Myers, FL | 4.0 | 3.0 | 2032 | $3,000 | $1.48 | 2d | 1 | 0.64mi |
| 4822 24th St SW Lehigh Acres, FL | 3.0 | 2.0 | 1730 | $1,800 | $1.04 | 23d | 1 | 0.64mi |
| 4449 26th St SW Lehigh Acres, FL | 3.0 | 2.0 | 2242 | $1,900 | $0.85 | 23d | 1 | 0.69mi |
| 4713 13th St SW Lehigh Acres, FL | 3.0 | 2.0 | 2320 | $1,600 | $0.69 | 3d | 1 | 0.69mi |
| 2431 Paul Ave S Lehigh Acres, FL | 3.0 | 2.0 | 2600 | $2,000 | $0.77 | 23d | 1 | 0.72mi |
| 11171 Canopy Loop Fort Myers, FL | 3.0 | 3.0 | 2434 | $3,000 | $1.23 | 13d | 1 | 0.73mi |
| 11127 Canopy Loop Fort Myers, FL | 3.0 | 3.0 | 2434 | $3,275 | $1.35 | 23d | 1 | 0.74mi |
| 11336 Canopy Loop Unit 1545819P Fort Myers, FL | 3.0 | 3.0 | 2443 | $4,682 | $1.92 | 15d | 1 | 0.77mi |
| 2271 Eaton Lake Ct Lehigh Acres, FL | 3.0 | 2.0 | 1740 | $2,300 | $1.32 | 23d | 1 | 0.79mi |
| 11091 Canopy Loop Fort Myers, FL | 4.0 | 3.0 | 2032 | $3,300 | $1.62 | 3d | 1 | 0.80mi |
| 11348 Canopy Loop Fort Myers, FL | 3.0 | 3.0 | 2434 | $3,300 | $1.36 | 3d | 1 | 0.81mi |
| 11028 Lakeland Cir Fort Myers, FL | 4.0 | 2.0 | 2136 | $2,550 | $1.19 | 23d | 1 | 0.87mi |
| 4501 15th St SW Unit 4501 Lehigh Acres, FL | 3.0 | 2.0 | 2383 | $1,800 | $0.76 | 23d | 1 | 0.89mi |
| 13802 Pine Lodge Ln Fort Myers, FL | 4.0 | 3.0 | 2606 | $4,500 | $1.73 | 23d | 1 | 0.89mi |
| 11380 Canopy Loop Fort Myers, FL | 3.0 | 3.0 | 2420 | $3,300 | $1.36 | 14d | 1 | 0.90mi |
| 1578 Gretchen Ave S Lehigh Acres, FL | 3.0 | 2.0 | 1728 | $2,000 | $1.16 | 23d | 1 | 0.90mi |
| 4518 14th St SW Lehigh Acres, FL | 3.0 | 2.0 | 2376 | $2,000 | $0.84 | 23d | 1 | 0.90mi |
| 13846 Pine Lodge Ln Fort Myers, FL | 4.0 | 3.0 | 2032 | $3,500 | $1.72 | 23d | 1 | 0.91mi |
| 13856 Pine Lodge Ln Fort Myers, FL | 4.0 | 3.0 | 2032 | $3,200 | $1.57 | 3d | 1 | 0.92mi |
| 14158 Gardeners Way Fort Myers, FL | 3.0 | 2.5 | 1871 | $2,600 | $1.39 | 2d | 1 | 0.94mi |
| 11081 Lakeland Cir Fort Myers, FL | 4.0 | 2.0 | 2136 | $2,600 | $1.22 | 23d | 1 | 0.97mi |
Listing history 9 events
-
2026-04-28status Pending
-
2026-04-22$349,000 Active
-
2013-11-27price $48,900 97-char remark
Show marketing remark (111 chars)
brand new duplex for sale. Quality construction! Tile floors in entire home. A must see! Don't wait to build!
-
2013-11-27price $299,900 111-char remark
Show marketing remark (111 chars)
brand new duplex for sale. Quality construction! Tile floors in entire home. A must see! Don't wait to build!
-
2010-01-29soldstatus $56,000
-
2009-05-20soldstatus $50,000
-
2009-05-15soldstatus $50,000 97-char remark
Show marketing remark (97 chars)
INVESTORS OPPORTUNITY. FAIRLY WELL MAINTAINED. CLOSE TO SHOPPING, AND GREAT ACCESS TO FORT MYERS.
-
2006-03-16soldstatus $305,000
-
2006-02-28soldstatus $305,000 111-char remark
Show marketing remark (111 chars)
brand new duplex for sale. Quality construction! Tile floors in entire home. A must see! Don't wait to build!
ⓘ Source: listings_history table (triggers on properties + properties_extension) + one-shot
backfill from property_details.listing_events for pre-trigger history.
Tax reassessment forecast FL · Resets to sale price
- Current annual tax
- $4,027 · $336/mo
- Projected year-2 tax
- $4,027 · $336/mo
- Expected delta
- $0/yr ($0/mo · 0.0%)
ⓘ Screening estimate from a state-policy table — verify with the county assessor before closing.
Climate risk First Street
- Flood 1/10 Low FEMA zone X (unshaded) · 0% chance over 30 yrs
- Wildfire 5/10 Major
- Heat 10/10 Extreme 7 d/yr ≥107°F today · 29 d/yr by 30 yrs out
- Wind 10/10 Extreme 99% chance of damaging wind over 30 yrs
- Air quality 2/10 Low 1 unhealthy d/yr today · 1 by 30 yrs out
Nearby sold comps map
Loading sold comps map…
Walkable amenities ~0.75 mi
Loading nearby amenities…
Taxation est. · year 1
- Rental income
- $41,928
- − Mortgage interest
- −$19,549
- − Property taxes
- −$4,027
- − Insurance
- −$1,745
- − Repairs & maintenance
- −$3,354
- − Management
- −$3,354
- − Depreciation
- −$10,153
- Taxable loss
- −$255
- Est. tax savings @ 24.0%
- +$61
- After-tax cash flow
- $5,450/yr
For passive investors: Depreciation is non-cash, so a rental often shows a tax loss while cash-flowing — sheltering income. Rental losses are passive: they offset passive income freely, and up to $25,000/yr can offset ordinary (W-2) income if you actively participate and your MAGI is under $100k (phasing out to $0 by $150k); unused losses carry forward. On sale, claimed depreciation is recaptured at up to 25%, and gains may owe capital-gains tax (a 1031 exchange can defer both). Figures are a year-1 estimate at your 24.0% rate — not tax advice; consult a CPA.
Schools (NCES district)
- District
- Lee
- NCES district ID
- 1201080
- Math proficiency
- 47% ▼ -11.00%
- Reading proficiency
- 50% ▼ -4.00%
- Median HH income
- $49,518
- Composite
- 41.49/100
- National rank
- #3458
- State rank
- #42 of 73 in FL
Livability — Lehigh Acres
- Score
- 59/100
- State rank
- #826
- US rank
- #20055
Category grades
Schools grade is shown separately in the Schools card above.
Census & demographics
- Census place
- Lehigh Acres, FL
- County
- Lee County · 788,662 people
- City population
- 130,638
- Metro
- Cape Coral-Fort Myers, FL
- Population (ZIP)
- 14,392
- Household income
- $60,530
- Rent vs Own
- Severe rent burden
- 1142.0
Population outlook (Lee County) Hauer SSP2
- Today (2025)
- 871,946 people
- By 2030
- 955,468 · +9.6%
- By 2040
- 1,113,587 · +27.7%
- By 2050
- 1,256,891 · +44.1%
- By 2075
- 1,560,270 · +78.9%
- By 2100
- 1,726,848 · +98.0%
Race, ethnicity, and origin ACS 2023
- Neighborhood character
- Diverse neighborhood (Simpson 0.67)
- Race & ethnicity
- Hispanic / Latino 41% Black 36% Two or more races 21% White 18%
- Hispanic origin (detail)
- Mexican 21% Puerto Rican 7% Cuban 4% Dominican 1%
- Common ancestry
- Hispanic 14% Russian 1% Estonian 1%
- Foreign-born
- 23% · Canada, China
- Languages at home
- 54% English-only · Spanish 31% French/Haitian/Cajun 13% Other Indo-European 1%
Political lean MEDSL · Lee
- 2024 margin
- Strong R (+28.4) · D 35.5% · R 63.9%
- 2008→2024 swing
- -18.0pp toward R · 2008: -10.4pp · 2024: -28.4pp
- All cycles
- 2024: R+28.4 2020: R+19.2 2016: R+20.4 2012: R+16.6 2008: R+10.4
Not yet ingested
- Civics
- —
Market trends
- HPI YoY
- ▼ -8.43%
- Current HPI
- 237.694
- Rent YoY
- ▼ -6.99%
- Metro
- Cape Coral-Fort Myers, FL
- State GDP YoY
- ▲ 3.28%
- F500 in state
- 36
Industry mix (Fortune 500 HQ in FL)
| Industry | F500 HQs | Revenue |
|---|---|---|
| Industrial Technology | 2 | $29B |
|
||
| Insurance | 2 | $17B |
|
||
| Retail | 1 | $60B |
|
||
| Technology Distribution | 1 | $58B |
|
||
| Homebuilding | 1 | $35B |
|
||
| Technology Manufacturing | 1 | $35B |
|
||
Price history
+14.4% since first listed9 events — show timeline
- 2026-04-28 Pending — FORTMLS
- 2026-04-22 Listed $349,000 FORTMLS
- 2013-11-27 Price Changed $299,900 FORTMLS
- 2013-11-27 Price Changed $48,900 FORTMLS
- 2010-01-29 Sold (MLS) $56,000 FORTMLS
- 2009-05-20 Sold (Public Records) $50,000 Public Records
- 2009-05-15 Sold (MLS) $50,000 FORTMLS
- 2006-03-16 Sold (Public Records) $305,000 Public Records
- 2006-02-28 Sold (MLS) $305,000 FORTMLS
Property tax history
+9.1%/yrLatest (2025): $4,027 · +10.3% YoY. Source: county tax records.
Cash-flow waterfall
monthlySold comps — $/sqft
last 12 mo · ≤1 miLoading sold comps…