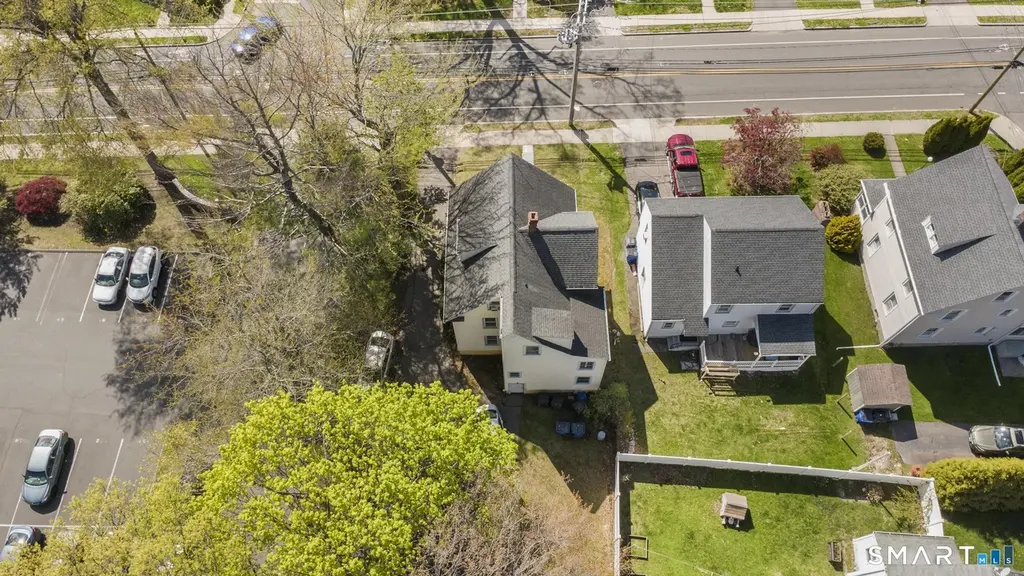
 Triplex
86 Oakwood Ave · West Hartford, CT
Flood risk 1/10 · Minimal
- FEMA flood zone
- X (unshaded)
- Chance of flooding over 30 yrs
- 0.0%
- Est. flood insurance / yr
- $473 – $860
Fire risk 1/10 · Minimal
- Est. fire insurance / yr
- $829 – $1,539
Heat risk 5/10 · Moderate
- Hot days now (above 97°F)
- 7 days/yr
- Hot days in 30 yrs
- 16 days/yr
Wind risk 6/10 · Moderate
- Chance of severe wind over 30 yrs
- 27.0%
Air-quality risk 3/10 · Minor
- Unhealthy air days now
- 3 days/yr
- Unhealthy air days in 30 yrs
- 4 days/yr
Risk factors via First Street. Map © Google.
Why this score? — see what drove the B+ grade
The composite is a weighted blend of 9 inputs, each scored 0–100. Each bar is that input's sub-score; the figure is the points it added to the 100-point composite (weight × sub-score).
- Cash flow +28.1/30.0
- ARV discount +15.0/15.0
- DSCR +10.0/10.0
- 1% rule +8.3/10.0
- Schools +5.6/10.0
- Livability +4.0/5.0
- Rent growth +3.8/5.0
- Condition / age +2.5/5.0
- Appreciation +0.0/10.0
$425,000
🖨 Deal sheet (PDF) 📄 Offer letter ✓ Due diligence
Multi-family units
County records classify this as Multi-Family (2-4 Unit). Listing-text estimate: 3 units. confirmed
Listing remarks
Incredible 3-Unit Value-Add Opportunity in the Heart of West Hartford! Unleash the full potential of 86 Oakwood Avenue, a rare triple-decker perfectly positioned for savvy investors or those looking to house hack their way to financial freedom. Located in a high-demand, high-rent growth pocket of West Hartford, this property offers a massive upside for a value-add strategy. Close to Restaurants, Whole Foods, Blue Back Square, Transit, With all units featuring a 1 Bed / 1 Bath layout, this is the ideal setup to modernize and stabilize at top-tier market rents. Property Highlights: - Unit Mix: Three spacious 1-Bedroom, 1-Bathroom units. Character & Bones: Beautiful hardwood floors. - E
Key facts
- Triple-decker
- High-demand location
- 7,405 sq ft lot
Tags
Property features AI
Finance
- Financial info: Assessed value noted
Exterior
- Utilities: Public water connected; Public sewer connected; Hot water system (other)
- Home design: Multi-family property (3-family)
- Construction: Frame construction; Concrete foundation
- Exterior features: Level lot; Vinyl siding; Asphalt shingle roof
Interior
- Bedrooms: 3 bedrooms
- Bathrooms: 3 full bathrooms
- Heating & cooling: Hot water heat (natural gas); Wall unit cooling
- Interior features: 11 total rooms; Full unfinished basement; Walk-up attic
Neighborhood map
What this means for you Summary
Snapshot
- This is a 3 × 1-bed/1-bath units multifamily listed at $425k.
Deal economics
- At list price, monthly cash flow is $1k ($16k/yr) — positive. Per door: $447/mo.
- The deal already cash-flows at list — no discount required.
- Meets the 1% rule at list price ($6k rent vs $425k).
- Recommended offer: $419k (1.5% below list) — sets the bar for market timing.
- Cap rate 10.1% vs local median 3.3% in West Hartford — top-decile yield for the area; either an underpriced asset or a hidden risk that comps aren't pricing in. Stress-test before assuming the spread holds.
Location & tenants
- Location reads 79/100 on livability (#27 in CT, #1,989 nationally) — a middle-class / working-renter tenant base. Strengths: employment A+, housing A+, crime B+; Watch: amenities F, cost of living F.
- West Hartford School District (urban): math 56% / reading 67% proficiency, ranked #39 of 153 in CT (top 26%) — acceptable for families but not a draw, mixed tenant base, ~2y average lease; only 16% free/reduced lunch — higher-income household profile.
- Zoned schools: Smith School (math 57% / reading 62%, grade B-, #159 of 553 statewide, top 31%, 344 students, 47% FRL); King Philip Middle School (math 53% / reading 69%, grade B+, #41 of 175 statewide, top 25%, 815 students, 26% FRL); Hall High School (math 62% / reading 82%, grade B+, #14 of 194 statewide, top 8%, 1,408 students, 20% FRL) — zoned schools average 31% FRL vs 16% district-wide (15 pts higher); higher-poverty schools than district average — tighter screening recommended.
- Market conditions: Rents rising fast (+5.4%/yr); 39 active listings in the ZIP; 19 comparable units currently listed for rent nearby; rentals at typical pace (median 25d on market — plan ~3-4 weeks tenant-placement turnaround); 47% of comp listings sitting > 30 days — soft ceiling on asking rent; solid renter incomes; 1,867 units permitted in Capitol Planning Region in 2024 (1,399 in 5+ unit buildings).
- At $5,632/mo this rent would consume 68% of the median local household income ($100k/yr) (locally 652% of renters already pay >50% of income on rent) — very limited rent-growth headroom before tenants either downsize or default.
Forward outlook
- Local home prices are declining (-3.0%/yr); year-one equity from $3k of loan paydown is wiped out by about $13k of value loss. Plan a longer hold.
- At projected returns (-3.0% appreciation + 5.4% rent growth), your $119k cash investment doubles in ~8 years — after that, you're playing with house money.
Negotiation context
- It's been on market 15 days — a 2% lower offer ($419k) is reasonable based on typical stale-listing flexibility.
Risks & watch-outs
- Watch-outs: built in 1898 — expect roof / HVAC / electrical / plumbing capex.
- Climate carrying-cost: major wind risk, 27% chance of damaging wind over 30y; extreme-heat days projected 7→16/yr by 2055 (HVAC capex compounding) — expect insurance premiums to compound above CPI over the hold.
Questions for the listing agent
- Can we see the unit-by-unit rent roll, current vacancy, and any below-market leases? What's the average tenancy length?
- What capital expenditures (roof, boiler, parking lot, exteriors) have been made in the last 5 years, and what's planned in the next 2?
- Built in 1898 — when were the roof, HVAC, electrical panel, plumbing, and water heater last replaced?
- Is there a deadline driving the sale (1031 exchange, divorce, estate, relocation)? That informs how much negotiation room exists.
- Schools are A-rated — typically a magnet for longer-tenancy family renters. What's the average tenant stay here, and is there a school-zone premium baked into asking?
- What's the average days-on-market for RENTAL listings here right now (not sales)? A rising rental-DOM trend means longer vacancies and softer asking-rent achievability than the comps imply.
- What's the recent tenant-quality profile in this submarket — average credit score on applications, eviction rate, late-payment / NSF rate, and stable-employment percentage? A property-management company in the area should have these aggregated.
- How much new apartment / multifamily construction is in the pipeline within 1–3 miles? Heavy new supply (>2% of stock underway) typically softens rents 12–24 months out; light construction supports rent growth.
Investment metrics
- 1% rule
- 1.33% ✓
- Cap rate
- 10.08%
- Cash-on-cash
- 13.52%
- DSCR
- 1.60
- GRM
- 6.3
CMA / ARV
- ARV (median comp)
- $593,177
- List price
- $425,000
- Delta
- -28.35%
- Verdict
- UNDERPRICED
- Comps
- 20 within 1.0 mi
Show comp detail 12 sales within ~0.75 mi
| Address | Dist | Beds/Ba | Sqft | Sold | Price | $/sf | Match |
|---|---|---|---|---|---|---|---|
| 169 Arnoldale Rd | 0.31mi | 4/2.0 (+1) | 2,076 (-3%) | 4mo | $550,000 | $265 | 68 |
| 45 Fairlawn St | 0.32mi | 4/2.0 (+1) | 2,236 (+4%) | 7mo | $595,000 | $266 | 63 |
| 99 Caya Ave | 0.42mi | 4/2.0 (+1) | 2,060 (-4%) | 6mo | $360,000 | $175 | 60 |
| 107 Richard St | 0.27mi | 4/2.0 (+1) | 2,184 (+2%) | 19mo | $505,000 | $231 | 59 |
| 5 Seymour Ave | 0.16mi | 4/2.0 (+1) | 2,340 (+9%) | 12mo | $530,000 | $226 | 58 |
| 395 Park Rd | 0.51mi | 3/2.0 | 2,022 (-6%) | 6mo | $400,000 | $198 | 58 |
| 21 Levesque Ave | 0.69mi | 3/2.0 | 2,167 (+1%) | 12mo | $305,000 | $141 | 52 |
| 13 Lockwood Ter | 0.40mi | 4/2.0 (+1) | 1,918 (-10%) | 3mo | $550,000 | $287 | 52 |
| 104 Vera St | 0.64mi | 4/2.0 (+1) | 2,128 (-1%) | 11mo | $575,000 | $270 | 51 |
| 29-31 Englewood Ave | 0.60mi | 4/2.0 (+1) | 2,154 (+0%) | 16mo | $490,000 | $227 | 49 |
| 33 Hugh St | 0.46mi | 4/2.0 (+1) | 2,408 (+12%) | 10mo | $600,000 | $249 | 40 |
| 73 Maplewood Ave | 0.60mi | 4/2.0 (+1) | 2,000 (-7%) | 20mo | $555,000 | $278 | 35 |
Match score weights: distance 35% · size 25% · config 20% · recency 20%. Top-matched comps best support the ARV.
Projected returns pro-forma
-3.0% appreciation · 5.37% rent growth · sell at horizon
- IRR
- 6.4%
- Equity multiple
- 1.26×
- Total profit
- $30,486
- Equity at exit
- $63,369
- IRR
- 17.9%
- Equity multiple
- 2.65×
- Total profit
- $196,526
- Equity at exit
- $36,746
Cash invested: $119,000 (down + closing). Projections, not guarantees.
Landlord ↔ Tenant lean methodology
- Overall (STATE)
- 27 Tenant-Leaning
- State Connecticut
- 27 Tenant-Leaning · D+7
- County
- — inherits STATE
- City
- — inherits STATE
ZIP-level market 06119
- Rents YoY
- 5.4%
- Active inventory
- 39
- Price-to-rent
- 18.9×
Monthly cashflow live
- Estimated rent
- $5,632 high interval (Pro) →
- Mortgage (P&I)
- −$2,229
- Tax from tax record
- −$702 /mo · $8,428/yr
- Insurance
- −$177
- HOA
- −$0
- Vacancy / Maint / Mgmt
- −$1,183
- Net cashflow
- $1,341
Break-even live
Sensitivity live
| Price | -10% $1,582 | -5% $1,461 | +0% $1,341 | +5% $1,221 | +10% $1,101 |
|---|---|---|---|---|---|
| Rent | -10% $896 | -5% $1,119 | +0% $1,341 | +5% $1,564 | +10% $1,786 |
| Rate | -1.0pp $1,555 | -0.5pp $1,449 | base $1,341 | +0.5pp $1,231 | +1.0pp $1,119 |
3-unit breakdown (identical units grouped — click to expand)
| Units | Beds | Baths | Est. rent |
|---|---|---|---|
| 3× units | 1 | 1 | $5,631 |
| #1 | 1 | 1 | $1,877 |
| #2 | 1 | 1 | $1,877 |
| #3 | 1 | 1 | $1,877 |
| Total (3 units) | $5,632 | ||
UW: 25.0% down · 7.5% · 30yr · 1.5% tax · 5.0% vac · 8.0% maint · 8.0% mgmt
Financing live
Cash to close
- Down payment
- $106,250
- Closing costs
- $12,750
- Reserves months
- —
- Total cash needed
- —
Loan-product check · same deal, 3 products live
Conventional
25% down · 7.5% · 30yr
- Down + closing
- —
- Monthly P&I
- —
- Monthly cashflow
- —
- DSCR
- —
- Eligible?
- —
Personal DTI + credit; lowest rate.
DSCR
20% down · 8.5% · 30yr
- Down + closing
- —
- Monthly P&I
- —
- Monthly cashflow
- —
- DSCR
- —
- Eligible?
- —
No personal income docs; deal must DSCR.
Hard money
10% down · 12.0% · 12mo
- Down + closing
- —
- Monthly P&I
- —
- Monthly cashflow
- —
- DSCR
- —
- Eligible?
- —
Short-term bridge; refi at stabilization.
Rent comps 19 comps
| Address | Beds | Baths | Sqft | Rent | $/sqft | DOM | Units | Dist |
|---|---|---|---|---|---|---|---|---|
| 21 Gillette St West Hartford, CT | 3.0 | 1.0 | 1400 | $2,500 | $1.79 | 4d | 1 | 0.11mi |
| 225 Whiting Ln West Hartford, CT | 2.0 | 1.0 | 1400 | $1,850 | $1.32 | 25d | 1 | 0.19mi |
| 103 Seymour Ave West Hartford, CT | 4.0 | 2.0 | 2080 | $2,500 | $1.20 | 45d | 1 | 0.30mi |
| 89 Maplewood Ave Fl 1 West Hartford, CT | 3.0 | 1.0 | 1475 | $2,400 | $1.63 | 25d | 1 | 0.56mi |
| 91 Fennbrook Rd West Hartford, CT | 3.0 | 1.5 | 1436 | $3,600 | $2.51 | 45d | 1 | 0.64mi |
| 18 Maplewood Ave Unit Second West Hartford, CT | 3.0 | 1.5 | 2050 | $2,750 | $1.34 | 45d | 1 | 0.69mi |
| 786 Farmington Ave Unit 3rd Floor West Hartford, CT | 2.0 | 1.0 | 1400 | $2,300 | $1.64 | 45d | 1 | 0.75mi |
| 852 Farmington Ave West Hartford, CT | 3.0 | 1.0 | 1648 | $2,650 | $1.61 | 25d | 1 | 0.85mi |
| 5 Bishop Rd #101 West Hartford, CT | 3.0 | 2.0 | 1408 | $3,300 | $2.34 | 13d | 1 | 0.85mi |
| 16 Thomson Rd West Hartford, CT | 3.0 | 2.0 | 2144 | $1,350 | $0.63 | 17d | 1 | 0.90mi |
| 950 Trout Brook Dr West Hartford, CT | 1.0–3.0 | 1.0–2.5 | 1071 | $6,070 | $5.67 | 45d | 1 | 0.90mi |
| 9 Bretton Rd Unit 2 West Hartford, CT | 3.0 | 1.0 | 1600 | $2,450 | $1.53 | 45d | 1 | 0.97mi |
| 85 Memorial Rd West Hartford, CT | 2.0 | 2.0 | 1315 | $5,750 | $4.37 | 45d | 2 | 1.01mi |
| 85 Memorial Rd #201 West Hartford, CT | 2.0 | 2.0 | 1402 | $6,000 | $4.28 | 25d | 1 | 1.02mi |
| 137 Dover Rd West Hartford, CT | 3.0 | 1.0 | 1450 | $2,500 | $1.72 | 45d | 1 | 1.15mi |
| 164 Whitney St Hartford, CT | 3.0 | 2.0 | 1600 | $2,800 | $1.75 | 4d | 1 | 1.29mi |
| 46 Cumberland Rd West Hartford, CT | 3.0 | 2.5 | 1740 | $3,900 | $2.24 | 45d | 1 | 1.32mi |
| 25 Stanley St West Hartford, CT | 2.0–3.0 | 2.0 | 1300 | $3,350 | $2.58 | 16d | 4 | 1.46mi |
| 25 Stanley St West Hartford, CT | 2.0 | 2.0 | 1400 | $3,200 | $2.29 | 25d | 1 | 1.46mi |
Listing history 2 events
-
2026-05-31status $425,000 Under Contract 15 DOM
-
2026-05-13$425,000 Active 1316-char remark
ⓘ Source: listings_history table (triggers on properties + properties_extension) + one-shot
backfill from property_details.listing_events for pre-trigger history.
Tax reassessment forecast CT · Partial reset (capped growth)
- Current annual tax
- $8,428 · $702/mo
- Projected year-2 tax
- $8,762 · $730/mo
- Expected delta
- +$334/yr (+$28/mo · 4.0%)
ⓘ Screening estimate from a state-policy table — verify with the county assessor before closing.
Climate risk First Street
- Flood 1/10 Low FEMA zone X (unshaded) · 0% chance over 30 yrs
- Wildfire 1/10 Low
- Heat 5/10 Major 7 d/yr ≥97°F today · 16 d/yr by 30 yrs out
- Wind 6/10 Major 27% chance of damaging wind over 30 yrs
- Air quality 3/10 Moderate 3 unhealthy d/yr today · 4 by 30 yrs out
Nearby sold comps map
Loading sold comps map…
Walkable amenities ~0.75 mi
Loading nearby amenities…
Taxation est. · year 1
- Rental income
- $67,584
- − Mortgage interest
- −$23,807
- − Property taxes
- −$8,428
- − Insurance
- −$2,125
- − Repairs & maintenance
- −$5,407
- − Management
- −$5,407
- − Depreciation
- −$12,364
- Taxable income
- $10,047
- Est. tax owed @ 24.0%
- −$2,411
- After-tax cash flow
- $13,682/yr
For passive investors: Depreciation is non-cash, so a rental often shows a tax loss while cash-flowing — sheltering income. Rental losses are passive: they offset passive income freely, and up to $25,000/yr can offset ordinary (W-2) income if you actively participate and your MAGI is under $100k (phasing out to $0 by $150k); unused losses carry forward. On sale, claimed depreciation is recaptured at up to 25%, and gains may owe capital-gains tax (a 1031 exchange can defer both). Figures are a year-1 estimate at your 24.0% rate — not tax advice; consult a CPA.
Schools (NCES district)
- District
- West Hartford School District
- NCES district ID
- 0904920
- Math proficiency
- 56% ▼ -6.00%
- Reading proficiency
- 67% ▼ -5.00%
- Median HH income
- $85,173
- Composite
- 55.64/100
- National rank
- #1228
- State rank
- #39 of 153 in CT
Livability — West Hartford
- Score
- 79/100
- State rank
- #27
- US rank
- #1989
Category grades
Schools grade is shown separately in the Schools card above.
Census & demographics
- Census place
- West Hartford, CT
- County
- Hartford County · 754,208 people
- City population
- 63,441
- Metro
- Hartford-East Hartford-Middletown, CT
- Population (ZIP)
- 14,793
- Household income
- $99,688
- Rent vs Own
- Severe rent burden
- 652.0
Population outlook (Capitol County) Hauer SSP2
- By 2040
- 1,063,519
Race, ethnicity, and origin ACS 2023
- Neighborhood character
- Predominantly White (69%)
- Race & ethnicity
- White 69% Hispanic / Latino 11% Black 11% Two or more races 8% Asian 5%
- Hispanic origin (detail)
- Mexican 2% Puerto Rican 4%
- Common ancestry
- Romanian 4% Lithuanian 3% Italian 3%
- Foreign-born
- 15% · Canada, Jamaica
- Languages at home
- 78% English-only · Spanish 9% Other Indo-European 7% Russian/Polish/Slavic 1%
Political lean MEDSL · Capitol
- 2024 margin
- Strong D (+21.9) · D 60.1% · R 38.2% · Other 1.7%
- All cycles
- 2024: D+21.9
Not yet ingested
- Civics
- —
Market trends
- HPI YoY
- ▼ -240.37%
- Current HPI
- 174.078
- Rent YoY
- ▲ 5.37%
- Metro
- Hartford-East Hartford-Middletown, CT
- State GDP YoY
- ▲ 1.06%
- F500 in state
- 38
Industry mix (Fortune 500 HQ in CT)
| Industry | F500 HQs | Revenue |
|---|---|---|
| Industrial Machinery | 4 | $38B |
|
||
| Insurance | 3 | $71B |
|
||
| Financial Services | 2 | $25B |
|
||
| Transportation / Logistics | 2 | $18B |
|
||
| Healthcare | 1 | $247B |
|
||
| Telecommunications | 1 | $55B |
|
||
Price history
2 events — show timeline
- 2026-05-30 Pending — Smart MLS
- 2026-05-13 Listed $425,000 Smart MLS
Property tax history
+2.8%/yrLatest (2025): $8,428 · +5.7% YoY. Source: county tax records.
Cash-flow waterfall
monthlySold comps — $/sqft
last 12 mo · ≤1 miLoading sold comps…