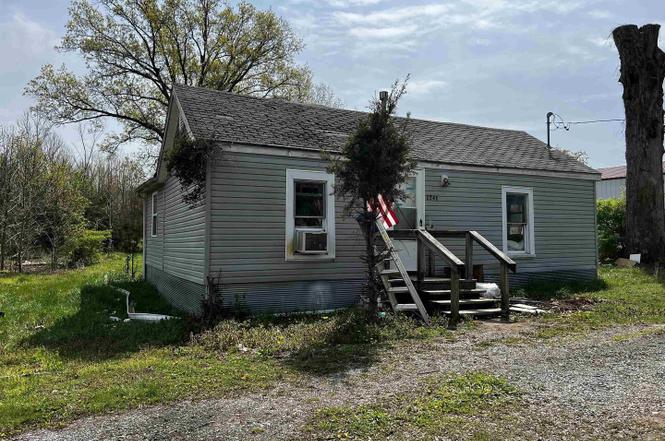
6846 E 1st St · Hanaford, IL
Flood risk 1/10 · Minimal
- FEMA flood zone
- X (unshaded)
- Chance of flooding over 30 yrs
- 0.0%
- Est. flood insurance / yr
- $507 – $1,088
Fire risk 1/10 · Minimal
- Est. fire insurance / yr
- $804 – $1,492
Heat risk 4/10 · Minor
- Hot days now (above 107°F)
- 7 days/yr
- Hot days in 30 yrs
- 20 days/yr
Wind risk 2/10 · Minimal
- Chance of severe wind over 30 yrs
- 2.0%
Air-quality risk 2/10 · Minimal
- Unhealthy air days now
- 1 days/yr
- Unhealthy air days in 30 yrs
- 2 days/yr
Risk factors via First Street. Map © Google.
Why this score? — see what drove the B grade
The composite is a weighted blend of 9 inputs, each scored 0–100. Each bar is that input's sub-score; the figure is the points it added to the 100-point composite (weight × sub-score).
- Cash flow +30.0/30.0
- DSCR +10.0/10.0
- 1% rule +9.5/10.0
- ARV discount +7.5/15.0
- Appreciation +5.0/10.0
- Livability +3.0/5.0
- Rent growth +2.5/5.0
- Condition / age +2.5/5.0
- Schools +2.0/10.0
$55,000
🖨 Deal sheet 📄 Offer letter ✓ Due diligence
Listing remarks
Tucked away on a quiet acre of land, this cozy 1-bedroom, 1-bath bungalow is full of potential and waiting for the right vision to bring it back to life. With an eat-in kitchen, a comfortable living room, and a simple, functional layout, it's the perfect blank canvas for a handyman or savvy investor. The property offers plenty of space for gardening, expansion, or simply enjoying the peace and privacy of country living. Though it needs some TLC, the bones are solid and the charm is undeniable. Whether you're looking to renovate, flip, or create your own quiet retreat, this "handyman special" is a rare opportunity at a great price. SOLD AS-IS
Key facts
- 1 acre lot
- Built 1951
- Listed 178 days
Property features AI
Exterior
- Parking: Gravel parking
- Utilities: Public water; Septic tank
- Home design: Detached single-family home; Single-story (main level living); Built before 1978
- Construction: Vinyl siding with frame construction; Property age: 71–80 years
- Exterior features: Level lot
Interior
- Kitchen: Range; Range hood; Refrigerator
- Bedrooms: 1 bedroom (main level)
- Flooring: Laminate flooring in living room, kitchen, and bedroom; Vinyl flooring in laundry room
- Bathrooms: 1 full bathroom
- Heating & cooling: Forced air heating; Propane heating
- Interior features: Egress window in basement
- Laundry & utility: Main-level laundry room; Washer; Dryer; Electric water heater
Neighborhood map
What this means for you Summary
Snapshot
- This is a 1-bed/1.0-bath single-family listed at $55k.
Deal economics
- At list price, monthly cash flow is $250 ($3k/yr) — positive.
- The deal already cash-flows at list — no discount required.
- Meets the 1% rule at list price ($798 rent vs $55k).
- Recommended offer: $48k (12.0% below list) — sets the bar for market timing.
Location & tenants
- Location reads 59/100 on livability (#1,049 in IL) — a working-class tenant base; expect higher turnover. Strengths: cost of living A+, housing A+; Watch: employment D, crime D-, amenities F.
- BentonConsolidatedHsd 103 (town): math 20% / reading 20% proficiency, ranked #727 of 919 in IL (top 79%) — low school quality limits family demand, transient renter base, plan for 1-2y turnover.
- Zoned schools: Benton Cons High School (math 17% / reading 27%, grade F, #319 of 693 statewide, top 50%, 577 students, 0% FRL).
- Market conditions: 1 active listings in the ZIP; 17 units permitted in Franklin County in 2024 (0 in 5+ unit buildings).
Forward outlook
- In year one you build about $2k of equity ($380 loan paydown + $2k appreciation (3.0% local appreciation)).
- Franklin County population projected at -16% by 2050 — secular population decline; favor cash flow + early exit over multi-decade hold.
- At projected returns (3.0% appreciation + 3.0% rent growth), your $15k cash investment doubles in ~3 years — after that, you're playing with house money.
Negotiation context
- It's been on market 178 days — a 12% lower offer ($48k) is reasonable based on typical stale-listing flexibility.
Risks & watch-outs
- Watch-outs: built in 1951 — expect roof / HVAC / electrical / plumbing capex.
Questions for the listing agent
- It's been on market 178 days. Have you received any prior offers? Is the seller open to a 12% concession, seller financing, or rate buy-down credit?
- Built in 1951 — when were the roof, HVAC, electrical panel, plumbing, and water heater last replaced?
- Why hasn't it sold? Are there any deal-killer items the seller is aware of (foundation, flood, title, zoning, code violations)?
- Is there a deadline driving the sale (1031 exchange, divorce, estate, relocation)? That informs how much negotiation room exists.
- Schools are F-rated, which usually means shorter tenancies and higher turnover. Who's the typical renter profile here, and what's been the actual vacancy rate?
- Crime grade is D in this area — have there been break-ins, vandalism, or insurance claims at this property in the last 3 years? What carrier currently insures it and at what premium?
- What's the average days-on-market for RENTAL listings here right now (not sales)? A rising rental-DOM trend means longer vacancies and softer asking-rent achievability than the comps imply.
- What's the recent tenant-quality profile in this submarket — average credit score on applications, eviction rate, late-payment / NSF rate, and stable-employment percentage? A property-management company in the area should have these aggregated.
- How much new for-sale + rental construction is in the pipeline within 1–3 miles? Heavy new supply typically softens prices + rents 12–24 months out; constrained supply supports both.
Investment metrics
- 1% rule
- 1.45% ✓
- Cap rate
- 11.76%
- Cash-on-cash
- 19.51%
- DSCR
- 1.87
- GRM
- 5.7
CMA / ARV
No comps found within radius.
Projected returns pro-forma
3.0% appreciation · 3.0% rent growth · sell at horizon
- IRR
- 25.9%
- Equity multiple
- 2.47×
- Total profit
- $22,588
- Equity at exit
- $24,730
- IRR
- 26.6%
- Equity multiple
- 4.77×
- Total profit
- $58,083
- Equity at exit
- $38,112
Cash invested: $15,400 (down + closing). Projections, not guarantees.
Landlord ↔ Tenant lean methodology
- Overall (STATE)
- 43 Moderately Tenant-Leaning
- State Illinois
- 43 Moderately Tenant-Leaning · D+7
- County
- — inherits STATE
- City
- — inherits STATE
ZIP-level market 62856
- Active inventory
- 1
- Price-to-rent
- 5.7×
Monthly cashflow live
- Estimated rent
- $798 medium interval (Pro) →
- Mortgage (P&I)
- −$288
- Tax est. 1.5%
- −$69 /mo · $825/yr
- Insurance
- −$23
- HOA
- −$0
- Vacancy / Maint / Mgmt
- −$168
- Net cashflow
- $250
Break-even live
UW: 25.0% down · 7.5% · 30yr · 1.5% tax · 5.0% vac · 8.0% maint · 8.0% mgmt
Financing live
Cash to close
- Down payment
- $13,750
- Closing costs
- $1,650
- Reserves months
- —
- Total cash needed
- —
Loan-product check · same deal, 3 products live
Conventional
25% down · 7.5% · 30yr
- Down + closing
- —
- Monthly P&I
- —
- Monthly cashflow
- —
- DSCR
- —
- Eligible?
- —
Personal DTI + credit; lowest rate.
DSCR
20% down · 8.5% · 30yr
- Down + closing
- —
- Monthly P&I
- —
- Monthly cashflow
- —
- DSCR
- —
- Eligible?
- —
No personal income docs; deal must DSCR.
Hard money
10% down · 12.0% · 12mo
- Down + closing
- —
- Monthly P&I
- —
- Monthly cashflow
- —
- DSCR
- —
- Eligible?
- —
Short-term bridge; refi at stabilization.
Listing history 25 events
-
2026-06-18days on market $55,000 Active 178 DOM
-
2026-06-17days on market $55,000 Active 177 DOM
-
2026-06-16days on market $55,000 Active 176 DOM
-
2026-06-15days on market $55,000 Active 175 DOM
-
2026-06-13days on market $55,000 Active 173 DOM
-
2026-06-12days on market $55,000 Active 172 DOM
-
2026-06-09days on market $55,000 Active 169 DOM
-
2026-06-08days on market $55,000 Active 168 DOM
-
2026-06-07days on market $55,000 Active 167 DOM
-
2026-06-07days on market $55,000 Active 166 DOM
-
2026-06-04days on market $55,000 Active 163 DOM
-
2026-06-02days on market $55,000 Active 162 DOM
-
2026-06-01days on market $55,000 Active 161 DOM
-
2026-05-31days on market $55,000 Active 160 DOM
-
2026-05-31days on market $55,000 Active 159 DOM
-
2026-05-24status Active
-
2026-05-24status Active
-
2026-05-23historical
-
2026-05-23historical
-
2026-05-05status Active
-
2026-05-01historical
-
2026-01-06historical
-
2025-07-29price
-
2025-06-09price
-
2025-04-14Active
ⓘ Source: listings_history table (triggers on properties + properties_extension) + one-shot
backfill from property_details.listing_events for pre-trigger history.
Climate risk First Street
- Flood 1/10 Low FEMA zone X (unshaded) · 0% chance over 30 yrs
- Wildfire 1/10 Low
- Heat 4/10 Moderate 7 d/yr ≥107°F today · 20 d/yr by 30 yrs out
- Wind 2/10 Low 2% chance of damaging wind over 30 yrs
- Air quality 2/10 Low 1 unhealthy d/yr today · 2 by 30 yrs out
Nearby sold comps map
Loading sold comps map…
Walkable amenities ~0.75 mi
Loading nearby amenities…
Taxation est. · year 1
- Rental income
- $9,578
- − Mortgage interest
- −$3,081
- − Property taxes
- −$825
- − Insurance
- −$275
- − Repairs & maintenance
- −$766
- − Management
- −$766
- − Depreciation
- −$1,600
- Taxable income
- $2,264
- Est. tax owed @ 24.0%
- −$543
- After-tax cash flow
- $2,462/yr
For passive investors: Depreciation is non-cash, so a rental often shows a tax loss while cash-flowing — sheltering income. Rental losses are passive: they offset passive income freely, and up to $25,000/yr can offset ordinary (W-2) income if you actively participate and your MAGI is under $100k (phasing out to $0 by $150k); unused losses carry forward. On sale, claimed depreciation is recaptured at up to 25%, and gains may owe capital-gains tax (a 1031 exchange can defer both). Figures are a year-1 estimate at your 24.0% rate — not tax advice; consult a CPA.
Schools (NCES district)
- District
- BentonConsolidatedHsd 103
- NCES district ID
- 1705970
- Math proficiency
- 20% ▬ 0.00%
- Reading proficiency
- 20% ▬ 0.00%
- Median HH income
- $35,473
- Composite
- 19.77/100
- National rank
- #13902
- State rank
- #727 of 919 in IL
Livability — Hanaford
- Score
- 59/100
- State rank
- #1049
- US rank
- #20077
Category grades
Schools grade is shown separately in the Schools card above.
Census & demographics
- Census place
- Hanaford, IL
- City population
- 327
- Population (ZIP)
- 327
Population outlook (Franklin County) Hauer SSP2
- Today (2025)
- 37,954 people
- By 2030
- 36,828 · -3.0%
- By 2040
- 34,452 · -9.2%
- By 2050
- 31,855 · -16.1%
- By 2075
- 25,171 · -33.7%
- By 2100
- 18,462 · -51.4%
Race, ethnicity, and origin ACS 2023
- Neighborhood character
- Predominantly White (95%)
- Race & ethnicity
- White 95% Two or more races 4%
- Common ancestry
- Romanian 5% German 1% Italian 1%
- Foreign-born
- 1%
- Languages at home
- 95% English-only · Arabic 4%
Political lean MEDSL · Franklin
- 2024 margin
- Solid R (+50.6) · D 24.1% · R 74.6% · Other 1.3%
- 2008→2024 swing
- -47.8pp toward R · 2008: -2.8pp · 2024: -50.6pp
- All cycles
- 2024: R+50.6 2020: R+47.5 2016: R+45.3 2012: R+16.8 2008: R+2.8
Not yet ingested
- Civics
- —
Market trends
- HPI YoY
- —
- Current HPI
- —
- Rent YoY
- —
- Metro
- —
- State GDP YoY
- ▲ 1.59%
- F500 in state
- 60
Industry mix (Fortune 500 HQ in IL)
| Industry | F500 HQs | Revenue |
|---|---|---|
| Insurance | 4 | $201B |
|
||
| Consumer Goods | 4 | $87B |
|
||
| Industrial Machinery | 3 | $64B |
|
||
| Healthcare | 2 | $55B |
|
||
| Retail / Pharmacy | 1 | $148B |
|
||
| Agriculture / Food | 1 | $86B |
|
||
Cash-flow waterfall
monthlySold comps — $/sqft
last 12 mo · ≤1 miLoading sold comps…