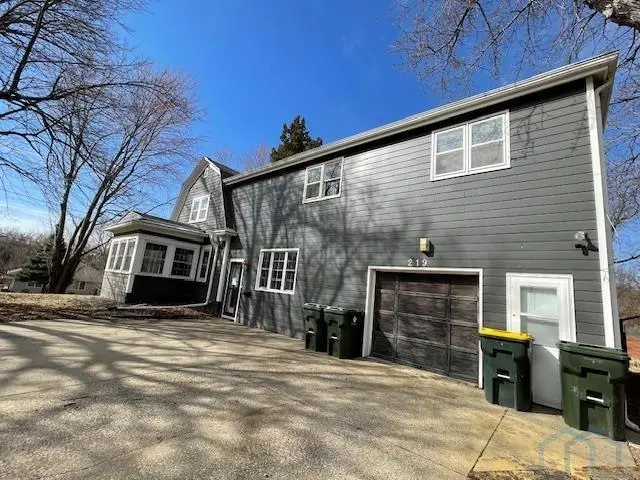
219 36th St · Sioux City, IA
Flood risk 1/10 · Minimal
- FEMA flood zone
- X (unshaded)
- Chance of flooding over 30 yrs
- 0.0%
- Est. flood insurance / yr
- $473 – $860
Fire risk 4/10 · Minor
- Est. fire insurance / yr
- $902 – $1,676
Heat risk 3/10 · Minor
- Hot days now (above 103°F)
- 7 days/yr
- Hot days in 30 yrs
- 15 days/yr
Wind risk 2/10 · Minimal
- Chance of severe wind over 30 yrs
- —
Air-quality risk 1/10 · Minimal
- Unhealthy air days now
- 0 days/yr
- Unhealthy air days in 30 yrs
- 0 days/yr
Risk factors via First Street. Map © Google.
Why this score? — see what drove the C- grade
The composite is a weighted blend of 9 inputs, each scored 0–100. Each bar is that input's sub-score; the figure is the points it added to the 100-point composite (weight × sub-score).
- ARV discount +15.0/15.0
- Cash flow +14.8/30.0
- 1% rule +5.5/10.0
- Schools +4.7/10.0
- DSCR +4.5/10.0
- Livability +3.9/5.0
- Rent growth +2.5/5.0
- Condition / age +2.5/5.0
- Appreciation +0.0/10.0
$152,500
🖨 Deal sheet 📄 Offer letter ✓ Due diligence
Listing remarks MLS
Nice house on a large corner lot. Driveway faces Grandview Blvd. Fenced Backyard, 4 bedrooms, 3 Baths, Livingroom & Family Room on the Main Floor. Formal dining room. Additional family room in the Basement. One car attached garage + plenty of additional parking space. This house is selling AS Is and needs mostly cosmetic work. This house was built prior to 1978 so Lead Base Paint potential exists. House is selling ASIS. Offers to be entered at www. vrmproperties.com using property ID 204039
Key facts
- Large corner lot
- Fenced backyard
- 0.46 acre lot
Tags
Neighborhood map
What this means for you Summary
Snapshot
- This is a 4-bed/2.5-bath single-family listed at $152k.
Deal economics
- At list price, monthly cash flow is $41 ($489/yr) — positive.
- The deal already cash-flows at list — no discount required.
- Meets the 1% rule at list price ($2k rent vs $152k).
- Recommended offer: $150k (1.5% below list) — sets the bar for market timing.
- Cap rate 6.6% vs local median 3.7% in Sioux City — top-decile yield for the area; either an underpriced asset or a hidden risk that comps aren't pricing in. Stress-test before assuming the spread holds.
Location & tenants
- Location reads 78/100 on livability (#138 in IA, #2,544 nationally) — a middle-class / working-renter tenant base. Strengths: cost of living A+, housing A+, health & safety A+; Watch: crime F, commute F.
- Sioux City Community School District (urban): math 54% / reading 57% proficiency, ranked #264 of 289 in IA (top 91%) — acceptable for families but not a draw, mixed tenant base, ~2y average lease.
- Market conditions: 120 active listings in the ZIP; solid renter incomes; 170 units permitted in Woodbury County in 2024 (90 in 5+ unit buildings).
Forward outlook
- Local home prices are declining (-3.0%/yr); year-one equity from $1k of loan paydown is wiped out by about $5k of value loss. Plan a longer hold.
Negotiation context
- It's been on market 15 days — a 2% lower offer ($150k) is reasonable based on typical stale-listing flexibility.
- 2 sale attempts with the ask held roughly flat each time — persistent listings suggest the price (not the market) is what's stuck; bring a comps-based counter.
Risks & watch-outs
- Watch-outs: property tax is 2.8% of price; built in 1923 — expect roof / HVAC / electrical / plumbing capex.
Questions for the listing agent
- Built in 1923 — when were the roof, HVAC, electrical panel, plumbing, and water heater last replaced?
- Property tax is high relative to price — has the assessment been appealed recently, and will the sale trigger a re-assessment?
- Is there a deadline driving the sale (1031 exchange, divorce, estate, relocation)? That informs how much negotiation room exists.
- Crime grade is F in this area — have there been break-ins, vandalism, or insurance claims at this property in the last 3 years? What carrier currently insures it and at what premium?
- What's the average days-on-market for RENTAL listings here right now (not sales)? A rising rental-DOM trend means longer vacancies and softer asking-rent achievability than the comps imply.
- What's the recent tenant-quality profile in this submarket — average credit score on applications, eviction rate, late-payment / NSF rate, and stable-employment percentage? A property-management company in the area should have these aggregated.
- How much new for-sale + rental construction is in the pipeline within 1–3 miles? Heavy new supply typically softens prices + rents 12–24 months out; constrained supply supports both.
Investment metrics
- 1% rule
- 1.05% ✓
- Cap rate
- 6.61%
- Cash-on-cash
- 1.14%
- DSCR
- 1.05
- GRM
- 7.9
CMA / ARV
- ARV (median comp)
- $292,993
- List price
- $152,500
- Delta
- -47.95%
- Verdict
- UNDERPRICED
- Comps
- 20 within 1.0 mi
Show comp detail 12 sales within ~0.75 mi
| Address | Dist | Beds/Ba | Sqft | Sold | Price | $/sf | Match |
|---|---|---|---|---|---|---|---|
| 3502 Pierce St | 0.22mi | 4/2.5 | 2,691 (+3%) | 5mo | $295,000 | $110 | 81 |
| 3609 Lindenwood St | 0.45mi | 4/3.0 | 2,502 (-5%) | 0mo | $374,950 | $150 | 69 |
| 3323 Jones St | 0.49mi | 3/2.5 (-1) | 2,589 (-1%) | 6mo | $220,000 | $85 | 65 |
| 3801 Pierce St | 0.27mi | 4/3.0 | 3,002 (+14%) | 5mo | $350,000 | $117 | 57 |
| 3020 Grandview Blvd | 0.65mi | 3/2.0 (-1) | 2,492 (-5%) | 1mo | $272,000 | $109 | 54 |
| 3611 Cheyenne Blvd | 0.67mi | 5/2.5 (+1) | 2,498 (-5%) | 5mo | $295,000 | $118 | 52 |
| 3246 Douglas St | 0.43mi | 4/1.5 | 2,913 (+11%) | 7mo | $262,500 | $90 | 52 |
| 3058 Stone Park Blvd | 0.62mi | 4/3.0 | 2,358 (-10%) | 3mo | $266,000 | $113 | 50 |
| 3071 Valley Dr | 0.73mi | 4/3.5 | 2,840 (+8%) | 7mo | $325,000 | $114 | 42 |
| 29 Congress Ave | 0.69mi | 4/3.0 | 2,314 (-12%) | 5mo | $215,000 | $93 | 42 |
| 11 Blackstone Ave | 0.70mi | 3/2.0 (-1) | 2,369 (-10%) | 4mo | $270,000 | $114 | 41 |
| 3640 Cheyenne Blvd | 0.71mi | 3/3.0 (-1) | 2,256 (-14%) | 2mo | $345,000 | $153 | 35 |
Match score weights: distance 35% · size 25% · config 20% · recency 20%. Top-matched comps best support the ARV.
Projected returns pro-forma
-3.0% appreciation · 3.0% rent growth · sell at horizon
- IRR
- -14.4%
- Equity multiple
- 0.49×
- Total profit
- $-21,989
- Equity at exit
- $22,738
- IRR
- -5.5%
- Equity multiple
- 0.64×
- Total profit
- $-15,283
- Equity at exit
- $13,185
Cash invested: $42,700 (down + closing). Projections, not guarantees.
Landlord ↔ Tenant lean methodology
- Overall (STATE)
- 83 Strongly Landlord-Friendly
- State Iowa
- 83 Strongly Landlord-Friendly · R+6
- County
- — inherits STATE
- City
- — inherits STATE
ZIP-level market 51104
- Home prices YoY
- -34.4%
- Active inventory
- 120
- Price-to-rent
- 7.9×
Monthly cashflow live
- Estimated rent
- $1,602 medium interval (Pro) →
- Mortgage (P&I)
- −$800
- Tax from tax record
- −$361 /mo · $4,336/yr
- Insurance
- −$64
- HOA
- −$0
- Vacancy / Maint / Mgmt
- −$336
- Net cashflow
- $41
Break-even live
UW: 25.0% down · 7.5% · 30yr · 1.5% tax · 5.0% vac · 8.0% maint · 8.0% mgmt
Financing live
Cash to close
- Down payment
- $38,125
- Closing costs
- $4,575
- Reserves months
- —
- Total cash needed
- —
Loan-product check · same deal, 3 products live
Conventional
25% down · 7.5% · 30yr
- Down + closing
- —
- Monthly P&I
- —
- Monthly cashflow
- —
- DSCR
- —
- Eligible?
- —
Personal DTI + credit; lowest rate.
DSCR
20% down · 8.5% · 30yr
- Down + closing
- —
- Monthly P&I
- —
- Monthly cashflow
- —
- DSCR
- —
- Eligible?
- —
No personal income docs; deal must DSCR.
Hard money
10% down · 12.0% · 12mo
- Down + closing
- —
- Monthly P&I
- —
- Monthly cashflow
- —
- DSCR
- —
- Eligible?
- —
Short-term bridge; refi at stabilization.
Listing history 5 events
-
2026-05-11status Pending 501-char remark
Show marketing remark (501 chars)
Nice house on a large corner lot. Driveway faces Grandview Blvd. Fenced Backyard, 4 bedrooms, 3 Baths, Livingroom & Family Room on the Main Floor. Formal dining room. Additional family room in the Basement. One car attached garage + plenty of additional parking space. This house is selling AS Is and needs mostly cosmetic work. This house was built prior to 1978 so Lead Base Paint potential exists. House is selling ASIS. Offers to be entered at www. vrmproperties.com using property ID 204039
-
2026-05-04status Active 501-char remark
Show marketing remark (501 chars)
Nice house on a large corner lot. Driveway faces Grandview Blvd. Fenced Backyard, 4 bedrooms, 3 Baths, Livingroom & Family Room on the Main Floor. Formal dining room. Additional family room in the Basement. One car attached garage + plenty of additional parking space. This house is selling AS Is and needs mostly cosmetic work. This house was built prior to 1978 so Lead Base Paint potential exists. House is selling ASIS. Offers to be entered at www. vrmproperties.com using property ID 204039
-
2026-04-23status Pending 501-char remark
Show marketing remark (501 chars)
Nice house on a large corner lot. Driveway faces Grandview Blvd. Fenced Backyard, 4 bedrooms, 3 Baths, Livingroom & Family Room on the Main Floor. Formal dining room. Additional family room in the Basement. One car attached garage + plenty of additional parking space. This house is selling AS Is and needs mostly cosmetic work. This house was built prior to 1978 so Lead Base Paint potential exists. House is selling ASIS. Offers to be entered at www. vrmproperties.com using property ID 204039
-
2026-04-14$152,500 Active 501-char remark
Show marketing remark (501 chars)
Nice house on a large corner lot. Driveway faces Grandview Blvd. Fenced Backyard, 4 bedrooms, 3 Baths, Livingroom & Family Room on the Main Floor. Formal dining room. Additional family room in the Basement. One car attached garage + plenty of additional parking space. This house is selling AS Is and needs mostly cosmetic work. This house was built prior to 1978 so Lead Base Paint potential exists. House is selling ASIS. Offers to be entered at www. vrmproperties.com using property ID 204039
-
2018-06-29soldstatus $204,000
ⓘ Source: listings_history table (triggers on properties + properties_extension) + one-shot
backfill from property_details.listing_events for pre-trigger history.
Tax reassessment forecast IA · Partial reset (capped growth)
- Current annual tax
- $4,336 · $361/mo
- Projected year-2 tax
- $4,336 · $361/mo
- Expected delta
- $0/yr ($0/mo · 0.0%)
ⓘ Screening estimate from a state-policy table — verify with the county assessor before closing.
Climate risk First Street
- Flood 1/10 Low FEMA zone X (unshaded) · 0% chance over 30 yrs
- Wildfire 4/10 Moderate
- Heat 3/10 Moderate 7 d/yr ≥103°F today · 15 d/yr by 30 yrs out
- Wind 2/10 Low
- Air quality 1/10 Low 0 unhealthy d/yr today · 0 by 30 yrs out
Nearby sold comps map
Loading sold comps map…
Walkable amenities ~0.75 mi
Loading nearby amenities…
Taxation est. · year 1
- Rental income
- $19,220
- − Mortgage interest
- −$8,542
- − Property taxes
- −$4,336
- − Insurance
- −$762
- − Repairs & maintenance
- −$1,538
- − Management
- −$1,538
- − Depreciation
- −$4,436
- Taxable loss
- −$1,932
- Est. tax savings @ 24.0%
- +$464
- After-tax cash flow
- $952/yr
For passive investors: Depreciation is non-cash, so a rental often shows a tax loss while cash-flowing — sheltering income. Rental losses are passive: they offset passive income freely, and up to $25,000/yr can offset ordinary (W-2) income if you actively participate and your MAGI is under $100k (phasing out to $0 by $150k); unused losses carry forward. On sale, claimed depreciation is recaptured at up to 25%, and gains may owe capital-gains tax (a 1031 exchange can defer both). Figures are a year-1 estimate at your 24.0% rate — not tax advice; consult a CPA.
Schools (NCES district)
- District
- Sioux City Community School District
- NCES district ID
- 1926400
- Math proficiency
- 54% ▼ -7.00%
- Reading proficiency
- 57% ▼ -2.00%
- Median HH income
- $44,967
- Composite
- 46.86/100
- National rank
- #2371
- State rank
- #264 of 289 in IA
Livability — Sioux City
- Score
- 78/100
- State rank
- #138
- US rank
- #2544
Category grades
Schools grade is shown separately in the Schools card above.
Census & demographics
- Census place
- Sioux City, IA
- County
- Woodbury County · 51,789 people
- City population
- 51,789
- Metro
- Sioux City, IA-NE-SD
- Population (ZIP)
- 23,197
- Household income
- $75,362
- Rent vs Own
- Severe rent burden
- 600.0
Population outlook (Woodbury County) Hauer SSP2
- Today (2025)
- 103,226 people
- By 2030
- 103,060 · -0.2%
- By 2040
- 102,533 · -0.7%
- By 2050
- 102,788 · -0.4%
- By 2075
- 107,227 · +3.9%
- By 2100
- 113,980 · +10.4%
Race, ethnicity, and origin ACS 2023
- Neighborhood character
- Majority White (64%)
- Race & ethnicity
- White 64% Hispanic / Latino 20% Two or more races 14% Black 5% Asian 4% Native American 2%
- Hispanic origin (detail)
- Mexican 16%
- Common ancestry
- Portuguese 4% Iranian 2% Romanian 2%
- Foreign-born
- 12% · Canada, Vietnam, United Kingdom
- Languages at home
- 80% English-only · Spanish 13% Other Asian/Pacific 2% Vietnamese 2%
Political lean MEDSL · Woodbury
- 2024 margin
- Strong R (+23.0) · D 37.8% · R 60.9% · Other 1.3%
- 2008→2024 swing
- -22.5pp toward R · 2008: -0.5pp · 2024: -23.0pp
- All cycles
- 2024: R+23.0 2020: R+15.5 2016: R+19.9 2012: R+0.2 2008: R+0.5
Not yet ingested
- Civics
- —
Market trends
- HPI YoY
- ▼ -114.54%
- Current HPI
- 218.5989
- Rent YoY
- —
- Metro
- Sioux City, IA-NE-SD
- State GDP YoY
- ▲ 2.48%
- F500 in state
- 4
Industry mix (Fortune 500 HQ in IA)
| Industry | F500 HQs | Revenue |
|---|---|---|
| Financial Services | 1 | $16B |
|
||
| Retail / Convenience | 1 | $15B |
|
||
Price history
-25.2% since first listed5 events — show timeline
- 2026-05-11 Pending — NWIA
- 2026-05-04 Relisted — NWIA
- 2026-04-23 Pending — NWIA
- 2026-04-14 Listed $152,500 NWIA
- 2018-06-29 Sold (Public Records) $204,000 Public Records
Property tax history
+8.7%/yrLatest (2025): $4,336 · +4.3% YoY. Source: county tax records.
Cash-flow waterfall
monthlySold comps — $/sqft
last 12 mo · ≤1 miLoading sold comps…