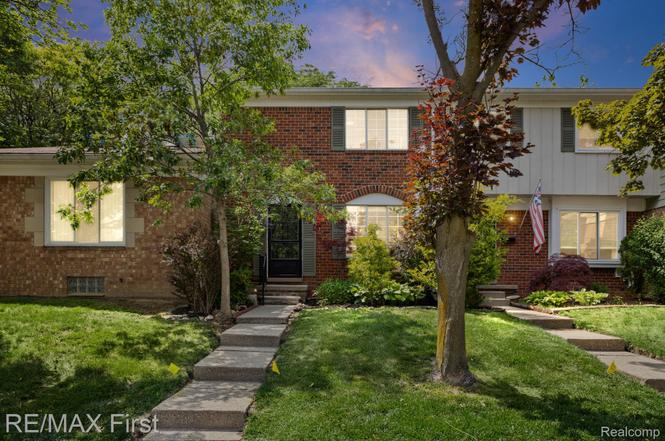
4905 Coventry St · Royal Oak, MI
Flood risk No data
- FEMA flood zone
- —
- Chance of flooding over 30 yrs
- —
- Est. flood insurance / yr
- —
Fire risk No data
- Est. fire insurance / yr
- —
Heat risk No data
- Hot days now (above threshold)
- —
- Hot days in 30 yrs
- —
Wind risk No data
- Chance of severe wind over 30 yrs
- —
Air-quality risk No data
- Unhealthy air days now
- —
- Unhealthy air days in 30 yrs
- —
Risk factors via First Street. Map © Google.
Why this score? — see what drove the D grade
The composite is a weighted blend of 9 inputs, each scored 0–100. Each bar is that input's sub-score; the figure is the points it added to the 100-point composite (weight × sub-score).
- Cash flow +12.2/30.0
- ARV discount +7.5/15.0
- 1% rule +4.9/10.0
- Schools +4.4/10.0
- Livability +4.2/5.0
- DSCR +3.6/10.0
- Rent growth +3.1/5.0
- Condition / age +2.5/5.0
- Appreciation +0.0/10.0
$269,000
🖨 Deal sheet (PDF) 📄 Offer letter ✓ Due diligence
Listing remarks MLS
Welcome to this exceptional North Royal Oak condo - where style, comfort, and convenience come together. From the moment you step inside, rich hardwood floors and an abundance of natural light set the tone for this beautifully designed home. A versatile library/study just off the foyer makes the perfect home office or reading retreat, while the open living and dining areas flow seamlessly to a private terrace - your own outdoor oasis for morning coffee or evening entertaining. The brand-new kitchen is a showstopper, featuring quartz countertops, sleek cabinetry, and all-new stainless steel appliances - all included. Upstairs, the generous primary suite offers a private en-suite bath, joined by two additional bedrooms and a second full bath. Need more space? The partially finished basement delivers flexible living and ample storage. Recent updates include a new water heater, refrigerator, stove, dishwasher, and microwave - so you can move right in and start living. And with HOA dues covering water, gas, trash, snow removal, lawn care, plus access to the community pool and clubhouse, low-maintenance living has never looked this good. Homes like this don't last - schedule your private showing today.
Key facts
- Quartz countertops
- Private terrace
- Brand new kitchen
Tags
Property features AI
Finance
- Other: Pets allowed: cats and dogs
- HOA & community: Homeowners association with monthly fee of $494; HOA covers gas, grounds maintenance, structure maintenance, sewer, snow removal, trash and water
Exterior
- Parking: No garage; Assigned parking
- Utilities: Public water; Public sewer
- Home design: Condominium (residential); Two levels; Ground-level entry with steps; Brick construction; Asphalt roof
- Construction: Brick construction; Asphalt roof; Unfinished basement
- Exterior features: Patio; Outdoor pool; Paved road access
Interior
- Kitchen: Dishwasher; Disposal; Microwave; Free‑standing refrigerator; Gas water heater
- Bathrooms: 2 full bathrooms; 1 half bathroom
- Heating & cooling: Forced air heating (natural gas); Central air conditioning
- Interior features: Unfurnished; Unfinished basement; Seven total rooms
- Laundry & utility: Washer hookup; Dryer hookup (gas)
Neighborhood map
What this means for you Summary
Snapshot
- This is a 3-bed/2.5-bath condo listed at $269k.
Deal economics
- At list price, monthly cash flow is $-55 ($-654/yr) — negative.
- To cash-flow at today's rent, offer at most $259k (3.6% below list).
- To meet the 1% rule (rent ≥ 1% of price), the offer needs to be $267k (0.6% below list).
- Recommended offer: $259k (3.6% below list) — sets the bar for cash-flow.
- Cap rate 6.0% vs local median 3.7% in Royal Oak — top-decile yield for the area; either an underpriced asset or a hidden risk that comps aren't pricing in. Stress-test before assuming the spread holds.
Location & tenants
- Location reads 83/100 on livability (#50 in MI, #1,020 nationally) — a professional / high-income tenant draw. Strengths: crime A+, commute A+, employment A+; Watch: amenities D+.
- Royal Oak Schools (suburban): math 41% / reading 59% proficiency, ranked #89 of 540 in MI (top 16%) — acceptable for families but not a draw, mixed tenant base, ~2y average lease; only 20% free/reduced lunch — higher-income household profile.
- Zoned schools: Alfred E Upton Elementary School (math 22% / reading 37%, grade F, #866 of 1,397 statewide, top 65%, 303 students, 36% FRL); Royal Oak Middle School (math 35% / reading 56%, grade D+, #161 of 493 statewide, top 33%, 1,060 students, 28% FRL); Royal Oak High School (math 49% / reading 75%, grade B-, #58 of 713 statewide, top 9%, 1,341 students, 26% FRL).
- Market conditions: Rents rising (+2.4%/yr); 259 active listings in the ZIP; 17 comparable units currently listed for rent nearby; rentals leasing fast (median 5d on market — plan ~1-2 weeks tenant-placement turnaround); solid renter incomes; 2,614 units permitted in Oakland County in 2024 (721 in 5+ unit buildings).
- This rent runs 35% of the median local income ($92k/yr) — at the standard rent-burdened threshold; future hikes will face affordability resistance.
Forward outlook
- Local home prices are declining (-3.0%/yr); year-one equity from $2k of loan paydown is wiped out by about $8k of value loss. Plan a longer hold.
- Oakland County population projected at +10% by 2050 — modest demand growth; plan on rents tracking national, not racing it.
Negotiation context
- Only 8 days on market — expect competitive offers; lowballing is unlikely to land.
- 4 sale attempts with the ask held roughly flat each time — persistent listings suggest the price (not the market) is what's stuck; bring a comps-based counter.
- Current owner paid $177k; list at $269k implies a 52% gain — meaningful room to come down on a strong offer.
Questions for the listing agent
- What do current leases actually rent for vs. the listed asking? Can we see a recent rent roll and the last 12 months of T-12 income?
- Built in 1971 — when were the roof, HVAC, electrical panel, plumbing, and water heater last replaced?
- What does the HOA fee cover, when was the last increase, and are there any pending special assessments or reserve-fund shortfalls?
- Any open or pending special assessments — roof, HVAC, plumbing, elevator, façade? What's the per-unit balance and payoff schedule, and is the seller paying it off at close or rolling it to the buyer?
- Is there a deadline driving the sale (1031 exchange, divorce, estate, relocation)? That informs how much negotiation room exists.
- Schools are B-rated — typically a magnet for longer-tenancy family renters. What's the average tenant stay here, and is there a school-zone premium baked into asking?
- The area grade is low — what's the realistic commute time and amenity access for the typical tenant pool here? Any planned neighborhood developments (good or bad) we should know about?
- What's the average days-on-market for RENTAL listings here right now (not sales)? A rising rental-DOM trend means longer vacancies and softer asking-rent achievability than the comps imply.
- What's the recent tenant-quality profile in this submarket — average credit score on applications, eviction rate, late-payment / NSF rate, and stable-employment percentage? A property-management company in the area should have these aggregated.
- How much new apartment / multifamily construction is in the pipeline within 1–3 miles? Heavy new supply (>2% of stock underway) typically softens rents 12–24 months out; light construction supports rent growth.
Investment metrics
- 1% rule
- 0.99% ✗
- Cap rate
- 6.05%
- Cash-on-cash
- -0.87%
- DSCR
- 0.96
- GRM
- 8.4
CMA / ARV
No comps found within radius.
Projected returns pro-forma
-3.0% appreciation · 2.36% rent growth · sell at horizon
- IRR
- -18.5%
- Equity multiple
- 0.36×
- Total profit
- $-48,543
- Equity at exit
- $40,109
- IRR
- -12.2%
- Equity multiple
- 0.30×
- Total profit
- $-52,738
- Equity at exit
- $23,258
Cash invested: $75,320 (down + closing). Projections, not guarantees.
Landlord ↔ Tenant lean methodology
- Overall (STATE)
- 62 Landlord-Friendly
- State Michigan
- 62 Landlord-Friendly · EVEN
- County
- — inherits STATE
- City
- — inherits STATE
ZIP-level market 48073
- Rents YoY
- 2.4%
- Active inventory
- 259
- Price-to-rent
- 8.4×
Monthly cashflow live
- Estimated rent
- $2,673 high interval (Pro) →
- Mortgage (P&I)
- −$1,411
- Tax from tax record
- −$149 /mo · $1,793/yr
- Insurance
- −$112
- HOA
- −$494
- Vacancy / Maint / Mgmt
- −$561
- Net cashflow
- $-55
Break-even live
Sensitivity live
| Price | -10% $98 | -5% $22 | +0% $-55 | +5% $-131 | +10% $-207 |
|---|---|---|---|---|---|
| Rent | -10% $-266 | -5% $-160 | +0% $-55 | +5% $51 | +10% $157 |
| Rate | -1.0pp $81 | -0.5pp $14 | base $-55 | +0.5pp $-124 | +1.0pp $-195 |
UW: 25.0% down · 7.5% · 30yr · 1.5% tax · 5.0% vac · 8.0% maint · 8.0% mgmt
Financing live
Cash to close
- Down payment
- $67,250
- Closing costs
- $8,070
- Reserves months
- —
- Total cash needed
- —
Loan-product check · same deal, 3 products live
Conventional
25% down · 7.5% · 30yr
- Down + closing
- —
- Monthly P&I
- —
- Monthly cashflow
- —
- DSCR
- —
- Eligible?
- —
Personal DTI + credit; lowest rate.
DSCR
20% down · 8.5% · 30yr
- Down + closing
- —
- Monthly P&I
- —
- Monthly cashflow
- —
- DSCR
- —
- Eligible?
- —
No personal income docs; deal must DSCR.
Hard money
10% down · 12.0% · 12mo
- Down + closing
- —
- Monthly P&I
- —
- Monthly cashflow
- —
- DSCR
- —
- Eligible?
- —
Short-term bridge; refi at stabilization.
Rent comps 17 comps
| Address | Beds | Baths | Sqft | Rent | $/sqft | DOM | Units | Dist |
|---|---|---|---|---|---|---|---|---|
| 1976 Ridge Ct Royal Oak, MI | 2.0 | 1.5 | 1929 | $2,500 | $1.30 | 3d | 1 | 0.07mi |
| 4014 Durham Rd Royal Oak, MI | 3.0 | 1.0 | 1827 | $2,400 | $1.31 | 4d | 1 | 0.94mi |
| 3054 Camden Dr Unit 3054 Troy, MI | 2.0 | 2.5 | 1400 | $2,300 | $1.64 | 26d | 1 | 1.16mi |
| 516 N Main St Clawson, MI | 2.0 | 2.0 | 1515 | $2,986 | $1.97 | 0d | 1 | 1.17mi |
| 3257 Newbury Pl Unit 20 Troy, MI | 2.0 | 3.0 | 1480 | $2,450 | $1.66 | 0d | 1 | 1.22mi |
| 3202 Camden Dr Troy, MI | 2.0 | 2.5 | 1959 | $2,300 | $1.17 | 4d | 1 | 1.24mi |
| 2711 Dorchester Rd Birmingham, MI | 4.0 | 3.0 | 2081 | $3,395 | $1.63 | 18d | 1 | 1.27mi |
| 3286 Camden Dr Troy, MI | 2.0 | 2.5 | 1550 | $2,450 | $1.58 | 25d | 1 | 1.28mi |
| 1911 Golfview Dr Troy, MI | 1.0–3.0 | 1.0–2.0 | 1300 | $2,487 | $1.91 | 0d | 18 | 1.30mi |
| 2751 Melcombe Cir Troy, MI | 1.0–3.0 | 1.0–2.5 | 1687 | $3,592 | $2.13 | 0d | 31 | 1.41mi |
| 401 S Eton St Birmingham, MI | 2.0–4.0 | 2.5 | 2277 | $7,200 | $3.16 | 6d | 2 | 1.43mi |
| 2690 Crooks Rd Troy, MI | 1.0–2.0 | 1.0–2.0 | 1259 | $2,635 | $2.09 | 0d | 1 | 1.45mi |
| 1641 Fairview Ave Royal Oak, MI | 2.0 | 1.0 | 1650 | $1,640 | $0.99 | 26d | 1 | 1.46mi |
| 3121 Ferncliff Ave Royal Oak, MI | 3.0 | 2.0 | 1700 | $3,500 | $2.06 | 0d | 1 | 1.46mi |
| 2453 Windemere Rd Birmingham, MI | 3.0 | 2.5 | 1486 | $3,200 | $2.15 | 0d | 1 | 1.47mi |
| 2194 Dorchester Rd Birmingham, MI | 3.0 | 2.0 | 1909 | $3,500 | $1.83 | 26d | 1 | 1.48mi |
| 4307 Cooper Ave Royal Oak, MI | 3.0 | 2.0 | 1679 | $2,550 | $1.52 | 19d | 1 | 1.48mi |
HOA detail condo
- Monthly dues
- $494 · $5,928/yr
- Likely covers
- watertrashgaslandscapingsnow removalpool
- Assessments
- None detected in remarks — confirm with the listing agent.
Listing history 7 events
-
2026-06-21statusdays on market $269,000 Pending 8 DOM
-
2026-06-18days on market $269,000 Active 7 DOM
-
2026-06-17days on market $269,000 Active 6 DOM
-
2026-06-16days on market $269,000 Active 5 DOM
-
2026-06-15days on market $269,000 Active 4 DOM
-
2026-06-13remarks 681-char remark
-
2026-06-13$269,000 Active 2 DOM
ⓘ Source: listings_history table (triggers on properties + properties_extension) + one-shot
backfill from property_details.listing_events for pre-trigger history.
Tax reassessment forecast MI · Partial reset (capped growth)
- Current annual tax
- $1,793 · $149/mo
- Projected year-2 tax
- $2,968 · $247/mo
- Expected delta
- +$1,175/yr (+$98/mo · 65.5%)
ⓘ Screening estimate from a state-policy table — verify with the county assessor before closing.
Nearby sold comps map
Loading sold comps map…
Walkable amenities ~0.75 mi
Loading nearby amenities…
Taxation est. · year 1
- Rental income
- $32,075
- − Mortgage interest
- −$15,068
- − Property taxes
- −$1,793
- − Insurance
- −$1,345
- − Repairs & maintenance
- −$2,566
- − Management
- −$2,566
- − HOA
- −$5,928
- − Depreciation
- −$7,825
- Taxable loss
- −$5,016
- Est. tax savings @ 24.0%
- +$1,204
- After-tax cash flow
- $550/yr
For passive investors: Depreciation is non-cash, so a rental often shows a tax loss while cash-flowing — sheltering income. Rental losses are passive: they offset passive income freely, and up to $25,000/yr can offset ordinary (W-2) income if you actively participate and your MAGI is under $100k (phasing out to $0 by $150k); unused losses carry forward. On sale, claimed depreciation is recaptured at up to 25%, and gains may owe capital-gains tax (a 1031 exchange can defer both). Figures are a year-1 estimate at your 24.0% rate — not tax advice; consult a CPA.
Schools (NCES district)
- District
- Royal Oak Schools
- NCES district ID
- 2630300
- Math proficiency
- 41% ▼ -10.00%
- Reading proficiency
- 59% ▼ -3.00%
- Median HH income
- $65,456
- Composite
- 44.19/100
- National rank
- #2853
- State rank
- #89 of 540 in MI
Livability — Royal Oak
- Score
- 83/100
- State rank
- #50
- US rank
- #1020
Category grades
Schools grade is shown separately in the Schools card above.
Census & demographics
- Census place
- Royal Oak, MI
- County
- Oakland County · 1,009,092 people
- City population
- 57,974
- Metro
- Detroit-Warren-Dearborn, MI
- Population (ZIP)
- 33,106
- Household income
- $91,627
- Rent vs Own
- Severe rent burden
- 718.0
Population outlook (Oakland County) Hauer SSP2
- Today (2025)
- 1,335,747 people
- By 2030
- 1,375,100 · +2.9%
- By 2040
- 1,435,385 · +7.5%
- By 2050
- 1,469,250 · +10.0%
- By 2075
- 1,531,946 · +14.7%
- By 2100
- 1,450,485 · +8.6%
Race, ethnicity, and origin ACS 2023
- Neighborhood character
- Predominantly White (80%)
- Race & ethnicity
- White 80% Black 8% Two or more races 6% Asian 4% Hispanic / Latino 3%
- Common ancestry
- Romanian 13% Lithuanian 4% Slovak 3%
- Foreign-born
- 7% · Canada, China
- Languages at home
- 94% English-only · Spanish 1% Chinese 1% Other Indo-European 1%
Political lean MEDSL · Oakland
- 2024 margin
- D (+10.6) · D 54.4% · R 43.8% · Other 1.9%
- 2008→2024 swing
- -3.9pp toward R · 2008: 14.5pp · 2024: 10.6pp
- All cycles
- 2024: D+10.6 2020: D+14.1 2016: D+8.1 2012: D+8.1 2008: D+14.5
Not yet ingested
- Civics
- —
Market trends
- HPI YoY
- ▼ -479.60%
- Current HPI
- 215.8425
- Rent YoY
- ▲ 2.36%
- Metro
- Detroit-Warren-Dearborn, MI
- State GDP YoY
- ▲ 1.37%
- F500 in state
- 28
Industry mix (Fortune 500 HQ in MI)
| Industry | F500 HQs | Revenue |
|---|---|---|
| Automotive Parts | 3 | $48B |
|
||
| Automotive | 2 | $372B |
|
||
| Chemicals | 1 | $45B |
|
||
| Automotive Retail | 1 | $29B |
|
||
| Healthcare / Medical Devices | 1 | $23B |
|
||
| Automotive Technology | 1 | $20B |
|
||
Price history
+686.3% since first listed12 events — show timeline
- 2026-06-11 Listed $269,000 REALCOMP
- 2026-06-11 Listed $269,000 MiRealSource-MiMLS
- 2026-05-04 Sold (Public Records) $177,000 Public Records
- 2026-04-23 Sold (MLS) $177,000 REALCOMP
- 2026-04-23 Sold (MLS) $177,000 MiRealSource-MiMLS
- 2026-02-23 Pending — MiRealSource-MiMLS
- 2026-02-23 Pending — REALCOMP
- 2026-02-17 Listed $172,000 REALCOMP
- 2026-02-16 Listed $172,000 MiRealSource-MiMLS
- 1996-07-03 Sold (Public Records) $112,000 Public Records
- 1974-08-01 Sold (Public Records) $42,500 Public Records
- 1971-12-01 Sold (Public Records) $34,210 Public Records
Property tax history
+2.0%/yrLatest (2025): $1,793 · +2.4% YoY. Source: county tax records.
Cash-flow waterfall
monthlySold comps — $/sqft
last 12 mo · ≤1 miLoading sold comps…