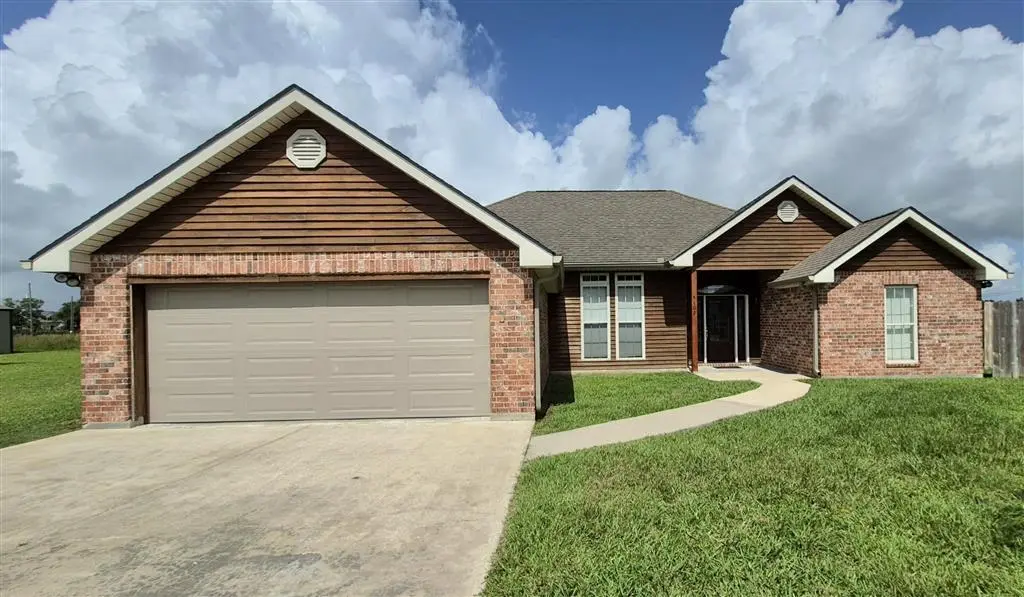
5102 Alfred Rd · Maurice, LA
Flood risk 4/10 · Minor
- FEMA flood zone
- X (unshaded)
- Chance of flooding over 30 yrs
- 0.22%
- Est. flood insurance / yr
- $507 – $1,088
Fire risk 1/10 · Minimal
- Est. fire insurance / yr
- $1,269 – $2,357
Heat risk 9/10 · Severe
- Hot days now (above 108°F)
- 7 days/yr
- Hot days in 30 yrs
- 21 days/yr
Wind risk 9/10 · Severe
- Chance of severe wind over 30 yrs
- 99.0%
Air-quality risk 1/10 · Minimal
- Unhealthy air days now
- 0 days/yr
- Unhealthy air days in 30 yrs
- 0 days/yr
Risk factors via First Street. Map © Google.
Why this score? — see what drove the D grade
The composite is a weighted blend of 9 inputs, each scored 0–100. Each bar is that input's sub-score; the figure is the points it added to the 100-point composite (weight × sub-score).
- Cash flow +12.6/30.0
- ARV discount +12.6/15.0
- Schools +3.9/10.0
- DSCR +3.8/10.0
- Livability +3.8/5.0
- 1% rule +2.8/10.0
- Rent growth +2.5/5.0
- Condition / age +2.5/5.0
- Appreciation +0.0/10.0
$249,000
🖨 Deal sheet 📄 Offer letter ✓ Due diligence
Listing remarks MLS
Located in Maurice, this move-in-ready 3-bedroom, 2-bathroom home sits on a spacious 0.45-acre lot with a fenced backyard. The open floor plan and abundance of windows provide plenty of natural light throughout the home. Granite countertops can be found in the kitchen and both bathrooms, and all kitchen appliances will remain. Recent updates include new flooring in the living and dining areas, bedrooms, and closets, plus a new AC installed in 2025, and a brand new dishwasher. The primary suite features a walk-in closet, double vanity, whirlpool tub, and separate shower. You'll also find a laundry room, enclosed garage with storage room, and an enclosed back porch overlooking the backyard. Located in the N. Vermilion High and Cecil Picard Elementary school districts. Owner is a licensed real estate agent in the State of Louisiana.
Key facts
- Double vanity
- Walk-in closet
- New flooring
Tags
Property features AI
Exterior
- Parking: Detached garage; 2 covered parking spaces; Total 2 parking spaces
- Utilities: Electric service: SLEMCO
- Home design: Single family residence
- Construction: Brick veneer; Wood siding; Brick; Frame construction; Composition roof
- Exterior features: Composition roof; Brick veneer and wood siding; Brick and frame construction
Interior
- Kitchen: Dishwasher; Disposal; Microwave; Refrigerator
- Flooring: Tile flooring; Vinyl flooring
- Bathrooms: 2 full bathrooms
- Heating & cooling: Central heating; Central air conditioning
- Interior features: Double-pane windows
Neighborhood map
What this means for you Summary
Snapshot
- This is a 3-bed/2.0-bath single-family listed at $249k.
Deal economics
- At list price, monthly cash flow is $-30 ($-357/yr) — negative.
- To cash-flow at today's rent, offer at most $244k (2.1% below list).
- To meet the 1% rule (rent ≥ 1% of price), the offer needs to be $194k (21.9% below list).
- Recommended offer: $194k (21.9% below list) — sets the bar for 1% rule.
Location & tenants
- Location reads 76/100 on livability (#15 in LA, #3,333 nationally) — a middle-class / working-renter tenant base. Strengths: crime A+, cost of living A+, housing A+; Watch: amenities F, commute F.
- Vermilion Parish (town): math 40% / reading 53% proficiency, ranked #15 of 98 in LA (top 15%) — families likely to look elsewhere, expect single-tenant / working-renter base with shorter leases.
- Zoned schools: Cecil Picard Elementary School At Maurice (math 61% / reading 68%, grade B, #40 of 646 statewide, top 7%, 845 students, 42% FRL); North Vermilion Middle School (math 47% / reading 53%, grade C, #26 of 218 statewide, top 12%, 656 students, 45% FRL); North Vermilion High School (math 57% / reading 63%, grade C+, #20 of 265 statewide, top 7%, 854 students, 44% FRL).
- Market conditions: 248 active listings in the ZIP; solid renter incomes; 228 units permitted in Vermilion Parish in 2024 (0 in 5+ unit buildings).
- This rent runs 31% of the median local income ($76k/yr) — at the standard rent-burdened threshold; future hikes will face affordability resistance.
Forward outlook
- Local home prices are declining (-3.0%/yr); year-one equity from $2k of loan paydown is wiped out by about $7k of value loss. Plan a longer hold.
- Vermilion County population projected at +10% by 2050 — modest demand growth; plan on rents tracking national, not racing it.
Negotiation context
- Only 10 days on market — expect competitive offers; lowballing is unlikely to land.
- 4 sale attempts since 14y ago with the ask held roughly flat each time — persistent listings suggest the price (not the market) is what's stuck; bring a comps-based counter.
- Current owner paid $161k; list at $249k implies a 55% gain — meaningful room to come down on a strong offer.
Risks & watch-outs
- Climate carrying-cost: severe wind risk, 99% chance of damaging wind over 30y; extreme-heat days projected 7→21/yr by 2055 (HVAC capex compounding) — expect insurance premiums to compound above CPI over the hold.
Questions for the listing agent
- What do current leases actually rent for vs. the listed asking? Can we see a recent rent roll and the last 12 months of T-12 income?
- Is there a deadline driving the sale (1031 exchange, divorce, estate, relocation)? That informs how much negotiation room exists.
- Schools are A-rated — typically a magnet for longer-tenancy family renters. What's the average tenant stay here, and is there a school-zone premium baked into asking?
- The area grade is low — what's the realistic commute time and amenity access for the typical tenant pool here? Any planned neighborhood developments (good or bad) we should know about?
- What's the average days-on-market for RENTAL listings here right now (not sales)? A rising rental-DOM trend means longer vacancies and softer asking-rent achievability than the comps imply.
- What's the recent tenant-quality profile in this submarket — average credit score on applications, eviction rate, late-payment / NSF rate, and stable-employment percentage? A property-management company in the area should have these aggregated.
- How much new for-sale + rental construction is in the pipeline within 1–3 miles? Heavy new supply typically softens prices + rents 12–24 months out; constrained supply supports both.
Investment metrics
- 1% rule
- 0.78% ✗
- Cap rate
- 6.15%
- Cash-on-cash
- -0.51%
- DSCR
- 0.98
- GRM
- 10.7
CMA / ARV
- ARV (on-the-fly)
- $280,476
- Comps found
- 3
Show comp detail 3 sales within ~0.75 mi
| Address | Dist | Beds/Ba | Sqft | Sold | Price | $/sf | Match |
|---|---|---|---|---|---|---|---|
| 5211 Baylee Rd | 0.22mi | 3/2.0 | 1,865 (-2%) | 8mo | $130,000 | $70 | 79 |
| 5003 La Premiere Dr | 0.67mi | 3/2.5 | 1,866 (-2%) | 14mo | $299,000 | $160 | 51 |
| 5009 Sage Mckenzie Ln | 0.59mi | 4/3.0 (+1) | 2,009 (+5%) | 20mo | $295,000 | $147 | 38 |
Match score weights: distance 35% · size 25% · config 20% · recency 20%. Top-matched comps best support the ARV.
Projected returns pro-forma
-3.0% appreciation · 3.0% rent growth · sell at horizon
- IRR
- -17.2%
- Equity multiple
- 0.39×
- Total profit
- $-42,308
- Equity at exit
- $37,127
- IRR
- -9.2%
- Equity multiple
- 0.43×
- Total profit
- $-39,548
- Equity at exit
- $21,529
Cash invested: $69,720 (down + closing). Projections, not guarantees.
Landlord ↔ Tenant lean methodology
- Overall (STATE)
- 90 Strongly Landlord-Friendly
- State Louisiana
- 90 Strongly Landlord-Friendly · R+12
- County
- — inherits STATE
- City
- — inherits STATE
ZIP-level market 70555
- Home prices YoY
- -29.4%
- Active inventory
- 248
- Price-to-rent
- 10.7×
Monthly cashflow live
- Estimated rent
- $1,943 medium interval (Pro) →
- Mortgage (P&I)
- −$1,306
- Tax from tax record
- −$156 /mo · $1,866/yr
- Insurance
- −$104
- HOA
- −$0
- Vacancy / Maint / Mgmt
- −$408
- Net cashflow
- $-30
Break-even live
UW: 25.0% down · 7.5% · 30yr · 1.5% tax · 5.0% vac · 8.0% maint · 8.0% mgmt
Financing live
Cash to close
- Down payment
- $62,250
- Closing costs
- $7,470
- Reserves months
- —
- Total cash needed
- —
Loan-product check · same deal, 3 products live
Conventional
25% down · 7.5% · 30yr
- Down + closing
- —
- Monthly P&I
- —
- Monthly cashflow
- —
- DSCR
- —
- Eligible?
- —
Personal DTI + credit; lowest rate.
DSCR
20% down · 8.5% · 30yr
- Down + closing
- —
- Monthly P&I
- —
- Monthly cashflow
- —
- DSCR
- —
- Eligible?
- —
No personal income docs; deal must DSCR.
Hard money
10% down · 12.0% · 12mo
- Down + closing
- —
- Monthly P&I
- —
- Monthly cashflow
- —
- DSCR
- —
- Eligible?
- —
Short-term bridge; refi at stabilization.
Listing history 9 events
-
2026-06-18days on market $249,000 Active 10 DOM
-
2026-06-17days on market $249,000 Active 9 DOM
-
2026-06-16days on market $249,000 Active 8 DOM
-
2026-06-15days on market $249,000 Active 7 DOM
-
2026-06-14days on market $249,000 Active 5 DOM
-
2026-06-13days on market $249,000 Active 4 DOM
-
2026-06-10days on market $249,000 Active 2 DOM
-
2026-06-09remarks 699-char remark
-
2026-06-09$249,000 Active 1 DOM
ⓘ Source: listings_history table (triggers on properties + properties_extension) + one-shot
backfill from property_details.listing_events for pre-trigger history.
Tax reassessment forecast LA · Resets to sale price
- Current annual tax
- $1,866 · $156/mo
- Projected year-2 tax
- $1,866 · $156/mo
- Expected delta
- $0/yr ($0/mo · 0.0%)
ⓘ Screening estimate from a state-policy table — verify with the county assessor before closing.
Climate risk First Street
- Flood 4/10 Moderate FEMA zone X (unshaded) · 22% chance over 30 yrs
- Wildfire 1/10 Low
- Heat 9/10 Extreme 7 d/yr ≥108°F today · 21 d/yr by 30 yrs out
- Wind 9/10 Extreme 99% chance of damaging wind over 30 yrs
- Air quality 1/10 Low 0 unhealthy d/yr today · 0 by 30 yrs out
Nearby sold comps map
Loading sold comps map…
Walkable amenities ~0.75 mi
Loading nearby amenities…
Taxation est. · year 1
- Rental income
- $23,321
- − Mortgage interest
- −$13,948
- − Property taxes
- −$1,866
- − Insurance
- −$1,245
- − Repairs & maintenance
- −$1,866
- − Management
- −$1,866
- − Depreciation
- −$7,244
- Taxable loss
- −$4,713
- Est. tax savings @ 24.0%
- +$1,131
- After-tax cash flow
- $774/yr
For passive investors: Depreciation is non-cash, so a rental often shows a tax loss while cash-flowing — sheltering income. Rental losses are passive: they offset passive income freely, and up to $25,000/yr can offset ordinary (W-2) income if you actively participate and your MAGI is under $100k (phasing out to $0 by $150k); unused losses carry forward. On sale, claimed depreciation is recaptured at up to 25%, and gains may owe capital-gains tax (a 1031 exchange can defer both). Figures are a year-1 estimate at your 24.0% rate — not tax advice; consult a CPA.
Schools (NCES district)
- District
- Vermilion Parish
- NCES district ID
- 2201800
- Math proficiency
- 40% ▼ -38.00%
- Reading proficiency
- 53% ▼ -32.00%
- Median HH income
- $45,115
- Composite
- 39.37/100
- National rank
- #3974
- State rank
- #15 of 98 in LA
Livability — Maurice
- Score
- 76/100
- State rank
- #15
- US rank
- #3333
Category grades
Schools grade is shown separately in the Schools card above.
Census & demographics
- County
- Vermilion Parish · 8,759 people
- City population
- 8,759
- Metro
- Lafayette, LA
- Population (ZIP)
- 8,759
- Household income
- $76,213
- Rent vs Own
- Severe rent burden
- 46.0
Population outlook (Vermilion County) Hauer SSP2
- Today (2025)
- 64,095 people
- By 2030
- 65,915 · +2.8%
- By 2040
- 68,985 · +7.6%
- By 2050
- 70,804 · +10.5%
- By 2075
- 73,897 · +15.3%
- By 2100
- 71,793 · +12.0%
Race, ethnicity, and origin ACS 2023
- Neighborhood character
- Predominantly White (82%)
- Race & ethnicity
- White 82% Black 8% Two or more races 5% Hispanic / Latino 4% Asian 3%
- Common ancestry
- Lithuanian 25% Romanian 3% Italian 1%
- Foreign-born
- 2% · Vietnam
- Languages at home
- 93% English-only · French/Haitian/Cajun 4% Vietnamese 2% Spanish 1%
Political lean MEDSL · Vermilion
- 2024 margin
- Solid R (+63.8) · D 17.6% · R 81.4% · Other 1.1%
- 2008→2024 swing
- -16.3pp toward R · 2008: -47.5pp · 2024: -63.8pp
- All cycles
- 2024: R+63.8 2020: R+61.9 2016: R+59.6 2012: R+52.8 2008: R+47.5
Not yet ingested
- Civics
- —
Market trends
- HPI YoY
- ▼ -55.61%
- Current HPI
- 133.7146
- Rent YoY
- —
- Metro
- Lafayette, LA
- State GDP YoY
- ▲ 3.29%
- F500 in state
- 10
Industry mix (Fortune 500 HQ in LA)
| Industry | F500 HQs | Revenue |
|---|---|---|
| Telecommunications | 2 | $23B |
|
||
| Utilities | 1 | $12B |
|
||
| Wholesale / Distribution | 1 | $5B |
|
||
| Advertising | 1 | $2B |
|
||
Price history
+57.0% since first listed5 events — show timeline
- 2026-06-08 Listed $249,000 AcadianaMLS
- 2026-06-08 Listed $249,000 SWLAR
- 2015-12-20 Listed $189,000 AcadianaMLS
- 2012-11-07 Sold (MLS) $161,000 AcadianaMLS
- 2012-10-04 Listed $158,600 AcadianaMLS
Property tax history
+2.1%/yrLatest (2025): $1,866 · -0.1% YoY. Source: county tax records.
Cash-flow waterfall
monthlySold comps — $/sqft
last 12 mo · ≤1 miLoading sold comps…