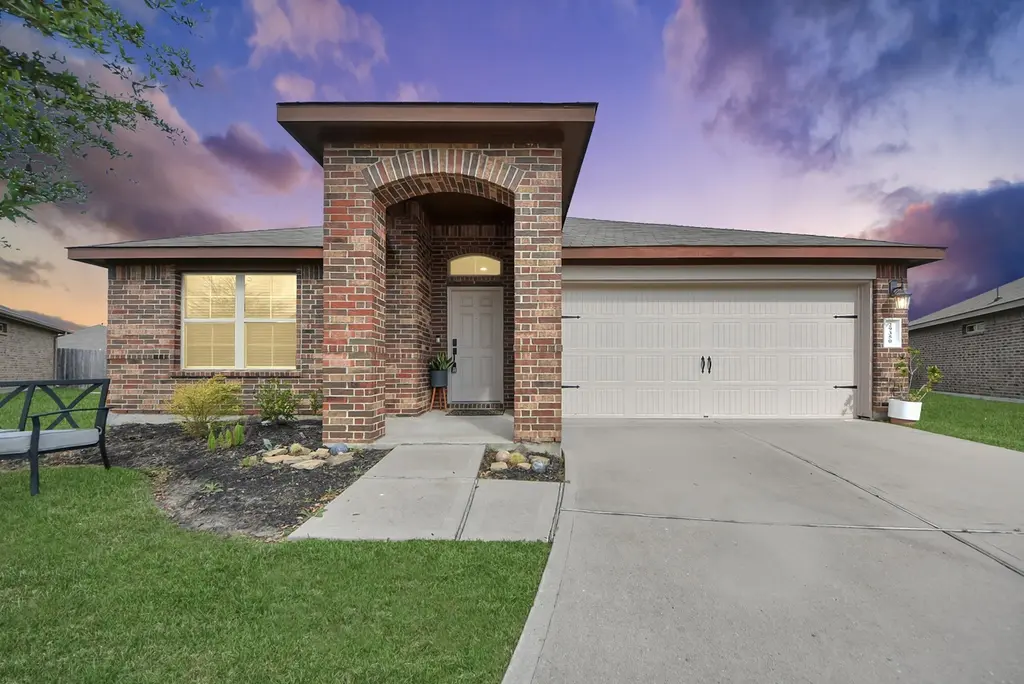
29350 Dunns Creek Ct · Katy, TX
Flood risk 6/10 · Moderate
- FEMA flood zone
- X (unshaded)
- Chance of flooding over 30 yrs
- 0.7%
- Est. flood insurance / yr
- $507 – $1,088
Fire risk 4/10 · Minor
- Est. fire insurance / yr
- $1,222 – $2,270
Heat risk 9/10 · Severe
- Hot days now (above 110°F)
- 7 days/yr
- Hot days in 30 yrs
- 22 days/yr
Wind risk 8/10 · Major
- Chance of severe wind over 30 yrs
- 99.0%
Air-quality risk 2/10 · Minimal
- Unhealthy air days now
- 1 days/yr
- Unhealthy air days in 30 yrs
- 1 days/yr
Risk factors via First Street. Map © Google.
Why this score? — see what drove the D- grade
The composite is a weighted blend of 9 inputs, each scored 0–100. Each bar is that input's sub-score; the figure is the points it added to the 100-point composite (weight × sub-score).
- ARV discount +15.0/15.0
- Cash flow +5.6/30.0
- Schools +4.6/10.0
- 1% rule +3.9/10.0
- Livability +3.8/5.0
- Condition / age +2.5/5.0
- Rent growth +1.6/5.0
- DSCR +0.0/10.0
- Appreciation +0.0/10.0
$245,000
🖨 Deal sheet (PDF) 📄 Offer letter ✓ Due diligence
Listing remarks MLS
Nestled in a quiet cul-de-sac within the master-planned community of Tamarron, 29350 Dunns Creek Ct offers an exceptional opportunity on a premium lot of over 10,000 sqft. This well-maintained home features 4 spacious bedrooms and 2 full bathrooms, designed with an open-concept layout that seamlessly connects the living, dining, and kitchen areas—perfect for both everyday living and entertaining. The generously sized backyard provides endless possibilities, whether you envision a custom pool, outdoor kitchen, or your own private retreat. Located in one of Tamarron’s most desirable sections, residents enjoy top-tier amenities including pickleball and tennis courts, scenic walking trails, and access to highly rated schools. This property offers incredible value for buyers looking to invest or settle into a growing community. Don’t miss your chance to make this home yours.
Key facts
- Custom pool
- Premium lot
- Private retreat
Tags
Neighborhood map
What this means for you Summary
Snapshot
- This is a 3-bed/2.0-bath single-family listed at $245k.
Deal economics
- At list price, monthly cash flow is $-513 ($-6k/yr) — negative.
- To cash-flow at today's rent, offer at most $177k (27.8% below list).
- To meet the 1% rule (rent ≥ 1% of price), the offer needs to be $217k (11.4% below list).
- Recommended offer: $177k (27.8% below list) — sets the bar for cash-flow.
- Cap rate 3.8% vs local median 3.0% in Katy — meaningfully above typical; check what's discounted (condition, days-on-market, listing class) to confirm the premium yield is real.
Location & tenants
- Location reads 76/100 on livability (#111 in TX, #3,613 nationally) — a middle-class / working-renter tenant base. Strengths: employment A+, cost of living A+, housing A+; Watch: crime C-, amenities D, commute F.
- Lamar CISD (suburban): math 50% / reading 53% proficiency, ranked #116 of 826 in TX (top 14%) — acceptable for families but not a draw, mixed tenant base, ~2y average lease.
- Zoned schools: Huggins El (math 61% / reading 63%, grade B, #321 of 4,322 statewide, top 8%, 893 students, 23% FRL); Briscoe J H (math 59% / reading 60%, grade B, #166 of 1,662 statewide, top 11%, 1,914 students, 38% FRL); Foster H S (math 64% / reading 74%, grade B, #141 of 1,632 statewide, top 9%, 2,388 students, 34% FRL).
- Zoned-school proficiency averages 64% at this address vs 52% district-wide (+12 pts) — the actual schools serving this property are materially stronger than the Lamar CISD average implies; a family-tenant draw the district grade alone would hide.
- Market conditions: Rents falling (-3.5%/yr); 1037 active listings in the ZIP; 13 comparable units currently listed for rent nearby; rentals leasing fast (median 7d on market — plan ~1-2 weeks tenant-placement turnaround); high-income renter base; 12,093 units permitted in Fort Bend County in 2024 (815 in 5+ unit buildings).
- This rent is only 18% of the median local income ($149k/yr) — well below the 30% rent-burden line; pricing power to push rent on renewal without tenant pushback.
Forward outlook
- Local home prices are declining (-3.0%/yr); year-one equity from $2k of loan paydown is wiped out by about $7k of value loss. Plan a longer hold.
- Fort Bend County population projected at +75% by 2050 — long-run rental-demand tailwind backs the buy-and-hold thesis.
Negotiation context
- It's been on market 77 days — a 6% lower offer ($230k) is reasonable based on typical stale-listing flexibility.
- 8 sale attempts since 6y ago; this cycle's ask has dropped $75k (23%) from the opening price — seller is motivated, your offer sets the floor, not the list.
Risks & watch-outs
- Watch-outs: property tax is 3.6% of price.
- Climate carrying-cost: major flood risk; severe wind risk, 99% chance of damaging wind over 30y; extreme-heat days projected 7→22/yr by 2055 (HVAC capex compounding) — expect insurance premiums to compound above CPI over the hold.
Questions for the listing agent
- What do current leases actually rent for vs. the listed asking? Can we see a recent rent roll and the last 12 months of T-12 income?
- It's been on market 77 days. Have you received any prior offers? Is the seller open to a 28% concession, seller financing, or rate buy-down credit?
- Property tax is high relative to price — has the assessment been appealed recently, and will the sale trigger a re-assessment?
- What does the HOA fee cover, when was the last increase, and are there any pending special assessments or reserve-fund shortfalls?
- Why hasn't it sold? Are there any deal-killer items the seller is aware of (foundation, flood, title, zoning, code violations)?
- Is there a deadline driving the sale (1031 exchange, divorce, estate, relocation)? That informs how much negotiation room exists.
- Schools are B-rated — typically a magnet for longer-tenancy family renters. What's the average tenant stay here, and is there a school-zone premium baked into asking?
- The area grade is low — what's the realistic commute time and amenity access for the typical tenant pool here? Any planned neighborhood developments (good or bad) we should know about?
- What's the average days-on-market for RENTAL listings here right now (not sales)? A rising rental-DOM trend means longer vacancies and softer asking-rent achievability than the comps imply.
- What's the recent tenant-quality profile in this submarket — average credit score on applications, eviction rate, late-payment / NSF rate, and stable-employment percentage? A property-management company in the area should have these aggregated.
- How much new for-sale + rental construction is in the pipeline within 1–3 miles? Heavy new supply typically softens prices + rents 12–24 months out; constrained supply supports both.
Investment metrics
- 1% rule
- 0.89% ✗
- Cap rate
- 3.78%
- Cash-on-cash
- -8.98%
- DSCR
- 0.60
- GRM
- 9.4
CMA / ARV
- ARV (median comp)
- $322,110
- List price
- $245,000
- Delta
- -23.94%
- Verdict
- UNDERPRICED
- Comps
- 20 within 1.0 mi
Show comp detail 12 sales within ~0.75 mi
| Address | Dist | Beds/Ba | Sqft | Sold | Price | $/sf | Match |
|---|---|---|---|---|---|---|---|
| 29103 Jacobs River Dr | 0.37mi | 4/2.0 (+1) | 1,791 (+2%) | 1mo | $279,000 | $156 | 73 |
| 3215 Zephyr Park Ln | 0.52mi | 3/2.0 | 1,685 (-4%) | 2mo | $280,000 | $166 | 69 |
| 2630 Lemonwood Ln | 0.37mi | 3/2.0 | 1,837 (+5%) | 8mo | $354,990 | $193 | 68 |
| 3014 Veeder Pass Ln | 0.13mi | 3/2.0 | 1,485 (-15%) | 2mo | $274,000 | $185 | 67 |
| 29519 Patricias Way | 0.11mi | 3/2.0 | 1,508 (-14%) | 6mo | $280,000 | $186 | 67 |
| 3227 Zephyr Park Ln | 0.53mi | 3/2.0 | 1,701 (-3%) | 8mo | $294,900 | $173 | 64 |
| 29107 Innes Park Pl | 0.35mi | 4/2.0 (+1) | 1,652 (-6%) | 10mo | $325,000 | $197 | 62 |
| 29331 Mesquite Oaks Dr | 0.44mi | 3/2.0 | 1,559 (-11%) | 3mo | $360,000 | $231 | 59 |
| 29606 Foliage Ln | 0.38mi | 3/2.0 | 1,508 (-14%) | 3mo | $284,990 | $189 | 57 |
| 29722 Cauthers Pass Ln | 0.38mi | 3/2.0 | 1,508 (-14%) | 4mo | $280,000 | $186 | 56 |
| 3939 Mcdonough Way | 0.45mi | 3/2.0 | 1,523 (-13%) | 9mo | $265,000 | $174 | 50 |
| 2930 Mcdonough | 0.43mi | 3/2.0 | 1,487 (-15%) | 11mo | $275,000 | $185 | 46 |
Match score weights: distance 35% · size 25% · config 20% · recency 20%. Top-matched comps best support the ARV.
Projected returns pro-forma
-3.0% appreciation · 0.0% rent growth · sell at horizon
- IRR
- -36.9%
- Equity multiple
- -0.14×
- Total profit
- $-78,392
- Equity at exit
- $36,530
- IRR
- -86.3%
- Equity multiple
- -0.95×
- Total profit
- $-133,474
- Equity at exit
- $21,183
Cash invested: $68,600 (down + closing). Projections, not guarantees.
Landlord ↔ Tenant lean methodology
- Overall (STATE)
- 87 Strongly Landlord-Friendly
- State Texas
- 87 Strongly Landlord-Friendly · R+5
- County
- — inherits STATE
- City
- — inherits STATE
ZIP-level market 77494
- Home prices YoY
- -32.5%
- Rents YoY
- -3.5%
- Active inventory
- 1037
- Price-to-rent
- 9.4×
Monthly cashflow live
- Estimated rent
- $2,171 high interval (Pro) →
- Mortgage (P&I)
- −$1,285
- Tax from tax record
- −$737 /mo · $8,847/yr
- Insurance
- −$102
- HOA
- −$104
- Vacancy / Maint / Mgmt
- −$456
- Net cashflow
- $-513
Break-even live
Sensitivity live
| Price | -10% $-375 | -5% $-444 | +0% $-513 | +5% $-583 | +10% $-652 |
|---|---|---|---|---|---|
| Rent | -10% $-685 | -5% $-599 | +0% $-513 | +5% $-428 | +10% $-342 |
| Rate | -1.0pp $-390 | -0.5pp $-451 | base $-513 | +0.5pp $-577 | +1.0pp $-641 |
UW: 25.0% down · 7.5% · 30yr · 1.5% tax · 5.0% vac · 8.0% maint · 8.0% mgmt
Financing live
Cash to close
- Down payment
- $61,250
- Closing costs
- $7,350
- Reserves months
- —
- Total cash needed
- —
Loan-product check · same deal, 3 products live
Conventional
25% down · 7.5% · 30yr
- Down + closing
- —
- Monthly P&I
- —
- Monthly cashflow
- —
- DSCR
- —
- Eligible?
- —
Personal DTI + credit; lowest rate.
DSCR
20% down · 8.5% · 30yr
- Down + closing
- —
- Monthly P&I
- —
- Monthly cashflow
- —
- DSCR
- —
- Eligible?
- —
No personal income docs; deal must DSCR.
Hard money
10% down · 12.0% · 12mo
- Down + closing
- —
- Monthly P&I
- —
- Monthly cashflow
- —
- DSCR
- —
- Eligible?
- —
Short-term bridge; refi at stabilization.
Rent comps 13 comps
| Address | Beds | Baths | Sqft | Rent | $/sqft | DOM | Units | Dist |
|---|---|---|---|---|---|---|---|---|
| 29202 Jarvis Bay Pass Katy, TX | 4.0 | 2.0 | 1563 | $2,200 | $1.41 | 7d | 1 | 0.25mi |
| 29655 Jordan Crossing Blvd Brookshire, TX | 1.0–3.0 | 1.0–2.0 | 1044 | $2,434 | $2.33 | 0d | 29 | 0.65mi |
| 3407 Tamarron Trce Unit BATN Katy, TX | 2.0 | 2.0 | 1053 | $1,705 | $1.62 | 26d | 1 | 0.73mi |
| 3000 Tamarron Trce Unit AATF1 Katy, TX | 2.0 | 2.0 | 1053 | $1,885 | $1.79 | 4d | 1 | 0.76mi |
| 3000 Tamarron Trce Katy, TX | 2.0 | 2.0 | 1053 | $1,885 | $1.79 | 45d | 1 | 0.76mi |
| 3615 Texas Heritage Pkwy Katy, TX | 1.0–3.0 | 1.0–2.0 | 1028 | $2,366 | $2.30 | 0d | 38 | 0.91mi |
| 2011 Texas Heritage Pkwy Katy, TX | 2.0 | 1.0–2.0 | 901 | $2,346 | $2.60 | 1d | 38 | 0.93mi |
| 3711 Daintree Park Dr Katy, TX | 3.0 | 2.0 | 1892 | $2,101 | $1.11 | 21d | 1 | 0.98mi |
| 2943 Fair Chase Dr Katy, TX | 3.0 | 2.0 | 1710 | $1,944 | $1.14 | 45d | 1 | 1.13mi |
| 9863 Willowmoor Ln Brookshire, TX | 4.0 | 2.0 | 2070 | $2,550 | $1.23 | 26d | 1 | 1.32mi |
| 3551 Shearwater St Katy, TX | 4.0 | 2.5 | 2054 | $2,500 | $1.22 | 45d | 1 | 1.35mi |
| 3230 FM 1463 Rd Katy, TX | 1.0–3.0 | 1.0–2.0 | 988 | $2,525 | $2.55 | 1d | 47 | 1.35mi |
| 29403 Cayman Canyon Way Katy, TX | 3.0–5.0 | 2.0 | 1679 | $2,132 | $1.27 | 3d | 17 | 1.49mi |
HOA detail
- Monthly dues
- $104 · $1,248/yr
- Likely covers
- pool
Listing history 33 events
-
2026-06-10days on market $245,000 Active 77 DOM
-
2026-06-08days on market $245,000 Active 76 DOM
-
2026-06-07pricedays on market $245,000 Active 75 DOM
-
2026-06-04days on market $299,900 Active 72 DOM
-
2026-06-03days on market $299,900 Active 71 DOM
-
2026-06-02days on market $299,900 Active 70 DOM
-
2026-06-01days on market $299,900 Active 69 DOM
-
2026-05-31days on market $299,900 Active 68 DOM
-
2026-05-05price $299,900 900-char remark
Show marketing remark (900 chars)
Nestled in a quiet cul-de-sac within the master-planned community of Tamarron, 29350 Dunns Creek Ct offers an exceptional opportunity on a premium lot of over 10,000 sqft. This well-maintained home features 4 spacious bedrooms and 2 full bathrooms, designed with an open-concept layout that seamlessly connects the living, dining, and kitchen areas—perfect for both everyday living and entertaining. The generously sized backyard provides endless possibilities, whether you envision a custom pool, outdoor kitchen, or your own private retreat. Located in one of Tamarron’s most desirable sections, residents enjoy top-tier amenities including pickleball and tennis courts, scenic walking trails, and access to highly rated schools. This property offers incredible value for buyers looking to invest or settle into a growing community. Don’t miss your chance to make this home yours.
-
2026-03-24$320,000 Active 900-char remark
Show marketing remark (900 chars)
Nestled in a quiet cul-de-sac within the master-planned community of Tamarron, 29350 Dunns Creek Ct offers an exceptional opportunity on a premium lot of over 10,000 sqft. This well-maintained home features 4 spacious bedrooms and 2 full bathrooms, designed with an open-concept layout that seamlessly connects the living, dining, and kitchen areas—perfect for both everyday living and entertaining. The generously sized backyard provides endless possibilities, whether you envision a custom pool, outdoor kitchen, or your own private retreat. Located in one of Tamarron’s most desirable sections, residents enjoy top-tier amenities including pickleball and tennis courts, scenic walking trails, and access to highly rated schools. This property offers incredible value for buyers looking to invest or settle into a growing community. Don’t miss your chance to make this home yours.
-
2026-03-16historical
-
2025-12-09price $345,000
-
2025-10-15$365,000 Active
-
2024-09-10soldstatus Sold
-
2024-09-10soldstatus
-
2024-07-17status Pending
-
2024-07-12status Option Pending
-
2024-06-24status Active
-
2024-06-19status Option Pending
-
2024-06-07$315,000 Active
-
2024-06-06historical
-
2024-04-26$334,950 Active
-
2024-04-25historical
-
2024-03-27$340,000 Active
-
2024-03-27historical
-
2024-03-17$350,000 Active
-
2024-03-13historical
-
2023-01-26soldstatus
-
2021-02-12soldstatus Sold
-
2021-02-12soldstatus
-
2021-01-09status Pending
-
2020-12-29status Option Pending
-
2020-12-11$249,900 Active
ⓘ Source: listings_history table (triggers on properties + properties_extension) + one-shot
backfill from property_details.listing_events for pre-trigger history.
Tax reassessment forecast TX · Resets to sale price
- Current annual tax
- $8,847 · $737/mo
- Projected year-2 tax
- $8,847 · $737/mo
- Expected delta
- $0/yr ($0/mo · 0.0%)
ⓘ Screening estimate from a state-policy table — verify with the county assessor before closing.
Climate risk First Street
- Flood 6/10 Major FEMA zone X (unshaded) · 70% chance over 30 yrs
- Wildfire 4/10 Moderate
- Heat 9/10 Extreme 7 d/yr ≥110°F today · 22 d/yr by 30 yrs out
- Wind 8/10 Severe 99% chance of damaging wind over 30 yrs
- Air quality 2/10 Low 1 unhealthy d/yr today · 1 by 30 yrs out
Nearby sold comps map
Loading sold comps map…
Walkable amenities ~0.75 mi
Loading nearby amenities…
Taxation est. · year 1
- Rental income
- $26,048
- − Mortgage interest
- −$13,724
- − Property taxes
- −$8,847
- − Insurance
- −$1,225
- − Repairs & maintenance
- −$2,084
- − Management
- −$2,084
- − HOA
- −$1,248
- − Depreciation
- −$7,127
- Taxable loss
- −$10,290
- Est. tax savings @ 24.0%
- +$2,470
- After-tax cash flow
- $-3,690/yr
For passive investors: Depreciation is non-cash, so a rental often shows a tax loss while cash-flowing — sheltering income. Rental losses are passive: they offset passive income freely, and up to $25,000/yr can offset ordinary (W-2) income if you actively participate and your MAGI is under $100k (phasing out to $0 by $150k); unused losses carry forward. On sale, claimed depreciation is recaptured at up to 25%, and gains may owe capital-gains tax (a 1031 exchange can defer both). Figures are a year-1 estimate at your 24.0% rate — not tax advice; consult a CPA.
Schools (NCES district)
- District
- Lamar CISD
- NCES district ID
- 4826580
- Math proficiency
- 50% ▼ -12.00%
- Reading proficiency
- 53% ▼ -4.00%
- Median HH income
- $75,213
- Composite
- 46.43/100
- National rank
- #2452
- State rank
- #116 of 826 in TX
Livability — Katy
- Score
- 76/100
- State rank
- #111
- US rank
- #3613
Category grades
Schools grade is shown separately in the Schools card above.
Census & demographics
- County
- Fort Bend County · 836,777 people
- City population
- 413,575
- Metro
- Houston-The Woodlands-Sugar Land, TX
- Population (ZIP)
- 140,157
- Household income
- $148,720
- Rent vs Own
- Severe rent burden
- 3390.0
Population outlook (Fort Bend County) Hauer SSP2
- Today (2025)
- 1,004,526 people
- By 2030
- 1,153,104 · +14.8%
- By 2040
- 1,453,718 · +44.7%
- By 2050
- 1,753,781 · +74.6%
- By 2075
- 2,455,772 · +144.5%
- By 2100
- 2,930,528 · +191.7%
Race, ethnicity, and origin ACS 2023
- Neighborhood character
- Highly diverse neighborhood (Simpson 0.73)
- Race & ethnicity
- White 39% Hispanic / Latino 25% Asian 24% Two or more races 18% Black 8%
- Hispanic origin (detail)
- Mexican 8% Cuban 1%
- Common ancestry
- Romanian 2% Lithuanian 2% Italian 2%
- Foreign-born
- 39% · Canada, China, Vietnam
- Languages at home
- 54% English-only · Spanish 20% Other Indo-European 8% Other Asian/Pacific 5%
Political lean MEDSL · Fort Bend
- 2024 margin
- Toss-up / Even · D 49.5% · R 47.9% · Other 2.6%
- 2008→2024 swing
- +4.0pp toward D · 2008: -2.4pp · 2024: 1.6pp
- All cycles
- 2024: D+1.6 2020: D+10.6 2016: D+6.6 2012: R+6.8 2008: R+2.4
Not yet ingested
- Civics
- —
Market trends
- HPI YoY
- ▼ -110.62%
- Current HPI
- 229.7189
- Rent YoY
- ▼ -3.53%
- Metro
- Houston-The Woodlands-Sugar Land, TX
- State GDP YoY
- ▲ 3.95%
- F500 in state
- 110
Industry mix (Fortune 500 HQ in TX)
| Industry | F500 HQs | Revenue |
|---|---|---|
| Energy | 16 | $1,198B |
|
||
| Technology | 5 | $198B |
|
||
| Engineering / Construction | 4 | $72B |
|
||
| Energy Services | 3 | $60B |
|
||
| Utilities | 3 | $41B |
|
||
| Healthcare | 2 | $330B |
|
||
Price history
+20.0% since first listed25 events — show timeline
- 2026-05-05 Price Changed $299,900 HARMLS
- 2026-03-24 Listed $320,000 HARMLS
- 2026-03-16 Listing Removed — HARMLS
- 2025-12-09 Price Changed $345,000 HARMLS
- 2025-10-15 Listed $365,000 HARMLS
- 2024-09-10 Sold (Public Records) — Public Records
- 2024-09-10 Sold (MLS) — HARMLS
- 2024-07-17 Pending — HARMLS
- 2024-07-12 Pending — HARMLS
- 2024-06-24 Relisted — HARMLS
- 2024-06-19 Pending — HARMLS
- 2024-06-07 Listed $315,000 HARMLS
- 2024-06-06 Listing Removed — HARMLS
- 2024-04-26 Listed $334,950 HARMLS
- 2024-04-25 Listing Removed — HARMLS
- 2024-03-27 Listing Removed — HARMLS
- 2024-03-27 Listed $340,000 HARMLS
- 2024-03-17 Listed $350,000 HARMLS
- 2024-03-13 Coming Soon — HARMLS
- 2023-01-26 Sold (Public Records) — Public Records
- 2021-02-12 Sold (Public Records) — Public Records
- 2021-02-12 Sold (MLS) — HARMLS
- 2021-01-09 Pending — HARMLS
- 2020-12-29 Pending — HARMLS
- 2020-12-11 Listed $249,900 HARMLS
Property tax history
+32.3%/yrLatest (2025): $8,847 · +2.2% YoY. Source: county tax records.
Cash-flow waterfall
monthlySold comps — $/sqft
last 12 mo · ≤1 miLoading sold comps…