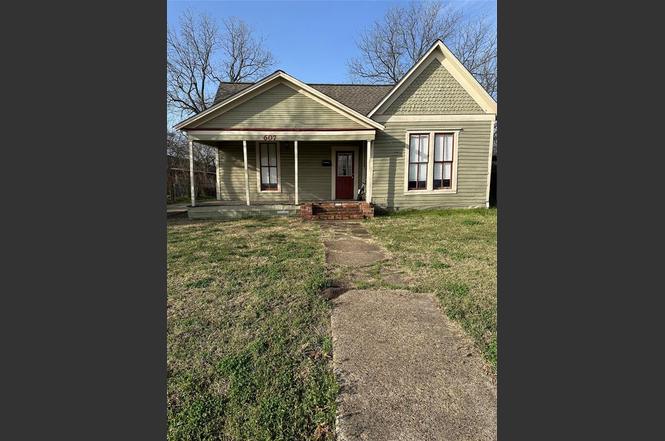
607 NW Main St · Ennis, TX
Flood risk 1/10 · Minimal
- FEMA flood zone
- X (unshaded)
- Chance of flooding over 30 yrs
- 0.0%
- Est. flood insurance / yr
- $507 – $1,088
Fire risk 4/10 · Minor
- Est. fire insurance / yr
- $1,222 – $2,270
Heat risk 7/10 · Major
- Hot days now (above 109°F)
- 7 days/yr
- Hot days in 30 yrs
- 23 days/yr
Wind risk 6/10 · Moderate
- Chance of severe wind over 30 yrs
- 27.0%
Air-quality risk 2/10 · Minimal
- Unhealthy air days now
- 0 days/yr
- Unhealthy air days in 30 yrs
- 1 days/yr
Risk factors via First Street. Map © Google.
Why this score? — see what drove the B grade
The composite is a weighted blend of 9 inputs, each scored 0–100. Each bar is that input's sub-score; the figure is the points it added to the 100-point composite (weight × sub-score).
- Cash flow +26.3/30.0
- ARV discount +15.0/15.0
- DSCR +8.9/10.0
- 1% rule +8.2/10.0
- Livability +3.6/5.0
- Schools +3.4/10.0
- Rent growth +3.2/5.0
- Condition / age +2.5/5.0
- Appreciation +0.0/10.0
$125,000
🖨 Deal sheet (PDF) 📄 Offer letter ✓ Due diligence
Listing remarks MLS
INVESTMENT Property! Very large lot with newly pored concerte driveway. Large front porch, big storage shed remains, exterior compressor is fairly recent installed. Home is SOLD in AS IS condition with no repairs from buyer. Seller is open to any and all offers but due to property condition CASH or CONV offers would work best. Close to the center of town, I-45 and major streets.
Key facts
- Large front porch
- Large backyard
- 0.25 acre lot
Tags
Property features AI
Finance
- Other: Property not attached; Will not subdivide
- Financial info: Accepts cash and conventional financing; Treat as clear loan type; No second mortgage indicated
- HOA & community: No association
Exterior
- Parking: Driveway parking
- Security: Smoke detector(s)
- Utilities: City water; City sewer; Electricity connected
- Home design: Single family residence; One story; Residential property
- Construction: Built in 1898; Composition roof; Pillar/post/pier foundation
- Exterior features: Chain link and wood fencing; Concrete driveway/sidewalk/curbs
Interior
- Kitchen: Eat-in kitchen (13 x 13); Dishwasher; Electric range; Utility in kitchen
- Bedrooms: Primary bedroom on level 1 (13 x 9); Bedroom on level 1 (11 x 12); Bedroom on level 1 (11 x 11)
- Flooring: Carpet; Tile; Wood
- Bathrooms: 1 full bathroom (9 x 5)
- Heating & cooling: Central heat (electric); Central air (electric)
- Interior features: Cable TV available; Eat-in kitchen; High speed internet available; One living area; Six total rooms; No fireplaces
- Laundry & utility: Full-size washer/dryer area; Electric dryer hookup; Laundry located in kitchen
Neighborhood map
What this means for you Summary
Snapshot
- This is a 3-bed/2.0-bath single-family listed at $125k.
Deal economics
- At list price, monthly cash flow is $323 ($4k/yr) — positive.
- The deal already cash-flows at list — no discount required.
- Meets the 1% rule at list price ($2k rent vs $125k).
- Recommended offer: $118k (6.0% below list) — sets the bar for market timing.
- Cap rate 9.4% vs local median 4.5% in Ennis — top-decile yield for the area; either an underpriced asset or a hidden risk that comps aren't pricing in. Stress-test before assuming the spread holds.
Location & tenants
- Location reads 71/100 on livability (#304 in TX) — a middle-class / working-renter tenant base. Strengths: cost of living A+, housing A+, crime B+; Watch: amenities F, commute F, health & safety F.
- Ennis ISD (rural): math 41% / reading 39% proficiency, ranked #411 of 826 in TX (top 50%) — families likely to look elsewhere, expect single-tenant / working-renter base with shorter leases; 60% free/reduced lunch — lower-income household profile, screen leases tightly.
- Zoned schools: Bowie El (math 42% / reading 42%, grade F, #1,335 of 4,322 statewide, top 33%, 434 students, 68% FRL); Ennis J H (math 41% / reading 44%, grade D-, #553 of 1,662 statewide, top 34%, 886 students, 69% FRL); Ennis H S (math 37% / reading 34%, grade F, #941 of 1,632 statewide, top 58%, 1,791 students, 64% FRL).
- Market conditions: Rents rising (+3.0%/yr); 364 active listings in the ZIP; 19 comparable units currently listed for rent nearby; rentals at typical pace (median 18d on market — plan ~3-4 weeks tenant-placement turnaround); solid renter incomes; 3,016 units permitted in Ellis County in 2024 (20 in 5+ unit buildings).
Forward outlook
- Local home prices are declining (-3.0%/yr); year-one equity from $864 of loan paydown is wiped out by about $4k of value loss. Plan a longer hold.
- Ellis County population projected at +36% by 2050 — long-run rental-demand tailwind backs the buy-and-hold thesis.
- At projected returns (-3.0% appreciation + 3.0% rent growth), your $35k cash investment doubles in ~10 years — after that, you're playing with house money.
Negotiation context
- It's been on market 67 days — a 6% lower offer ($118k) is reasonable based on typical stale-listing flexibility.
- 4 sale attempts since 16y ago; this cycle's ask has dropped $10k (7%) from the opening price — seller is motivated, your offer sets the floor, not the list.
Risks & watch-outs
- Watch-outs: property tax is 2.6% of price; built in 1898 — expect roof / HVAC / electrical / plumbing capex.
- Climate carrying-cost: major wind risk, 27% chance of damaging wind over 30y; extreme-heat days projected 7→23/yr by 2055 (HVAC capex compounding) — expect insurance premiums to compound above CPI over the hold.
Questions for the listing agent
- It's been on market 67 days. Have you received any prior offers? Is the seller open to a 6% concession, seller financing, or rate buy-down credit?
- Built in 1898 — when were the roof, HVAC, electrical panel, plumbing, and water heater last replaced?
- Property tax is high relative to price — has the assessment been appealed recently, and will the sale trigger a re-assessment?
- Why hasn't it sold? Are there any deal-killer items the seller is aware of (foundation, flood, title, zoning, code violations)?
- Is there a deadline driving the sale (1031 exchange, divorce, estate, relocation)? That informs how much negotiation room exists.
- Schools are D-rated, which usually means shorter tenancies and higher turnover. Who's the typical renter profile here, and what's been the actual vacancy rate?
- What's the average days-on-market for RENTAL listings here right now (not sales)? A rising rental-DOM trend means longer vacancies and softer asking-rent achievability than the comps imply.
- What's the recent tenant-quality profile in this submarket — average credit score on applications, eviction rate, late-payment / NSF rate, and stable-employment percentage? A property-management company in the area should have these aggregated.
- How much new for-sale + rental construction is in the pipeline within 1–3 miles? Heavy new supply typically softens prices + rents 12–24 months out; constrained supply supports both.
Investment metrics
- 1% rule
- 1.32% ✓
- Cap rate
- 9.39%
- Cash-on-cash
- 11.06%
- DSCR
- 1.49
- GRM
- 6.3
CMA / ARV
- ARV (on-the-fly)
- $188,666
- Comps found
- 12
Show comp detail 12 sales within ~0.75 mi
| Address | Dist | Beds/Ba | Sqft | Sold | Price | $/sf | Match |
|---|---|---|---|---|---|---|---|
| 607 NW Main St | 0.00mi | 3/1.0 | 1,054 (0%) | 1mo | $125,000 | $119 | 95 |
| 205 E Decatur St | 0.20mi | 4/2.0 (+1) | 1,032 (-2%) | 13mo | $205,000 | $199 | 71 |
| 502 E Tyler St | 0.37mi | 3/2.0 | 1,144 (+8%) | 2mo | $245,000 | $214 | 67 |
| 901 N Breckenridge St | 0.18mi | 3/1.5 | 1,160 (+10%) | 15mo | $69,000 | $59 | 60 |
| 804 N Sherman St | 0.20mi | 2/1.0 (-1) | 960 (-9%) | 9mo | $99,500 | $104 | 59 |
| 606 Travis St | 0.67mi | 3/1.0 | 1,071 (+2%) | 6mo | $135,000 | $126 | 57 |
| 1004 N Sherman St | 0.28mi | 3/2.0 | 1,160 (+10%) | 16mo | $240,000 | $207 | 56 |
| 801 E Brown St | 0.68mi | 3/2.0 | 1,120 (+6%) | 3mo | $260,000 | $232 | 56 |
| 710 N Sherman St | 0.18mi | 2/2.0 (-1) | 1,208 (+15%) | 8mo | $237,500 | $197 | 55 |
| 304 E Waco St | 0.64mi | 2/1.5 (-1) | 1,120 (+6%) | 2mo | $161,500 | $144 | 51 |
| 402 S Clay St | 0.68mi | 2/2.0 (-1) | 1,012 (-4%) | 11mo | $150,000 | $148 | 48 |
| 506 E Waco St | 0.70mi | 2/1.0 (-1) | 976 (-7%) | 1mo | $174,500 | $179 | 45 |
Match score weights: distance 35% · size 25% · config 20% · recency 20%. Top-matched comps best support the ARV.
Projected returns pro-forma
-3.0% appreciation · 2.95% rent growth · sell at horizon
- IRR
- 0.2%
- Equity multiple
- 1.01×
- Total profit
- $302
- Equity at exit
- $18,638
- IRR
- 9.9%
- Equity multiple
- 1.76×
- Total profit
- $26,771
- Equity at exit
- $10,808
Cash invested: $35,000 (down + closing). Projections, not guarantees.
Landlord ↔ Tenant lean methodology
- Overall (STATE)
- 87 Strongly Landlord-Friendly
- State Texas
- 87 Strongly Landlord-Friendly · R+5
- County
- — inherits STATE
- City
- — inherits STATE
ZIP-level market 75119
- Rents YoY
- 3.0%
- Active inventory
- 364
- Price-to-rent
- 6.3×
Monthly cashflow live
- Estimated rent
- $1,652 high interval (Pro) →
- Mortgage (P&I)
- −$656
- Tax from tax record
- −$275 /mo · $3,298/yr
- Insurance
- −$52
- HOA
- −$0
- Vacancy / Maint / Mgmt
- −$347
- Net cashflow
- $323
Break-even live
Sensitivity live
| Price | -10% $393 | -5% $358 | +0% $323 | +5% $287 | +10% $252 |
|---|---|---|---|---|---|
| Rent | -10% $192 | -5% $257 | +0% $323 | +5% $388 | +10% $453 |
| Rate | -1.0pp $385 | -0.5pp $354 | base $323 | +0.5pp $290 | +1.0pp $257 |
UW: 25.0% down · 7.5% · 30yr · 1.5% tax · 5.0% vac · 8.0% maint · 8.0% mgmt
Financing live
Cash to close
- Down payment
- $31,250
- Closing costs
- $3,750
- Reserves months
- —
- Total cash needed
- —
Loan-product check · same deal, 3 products live
Conventional
25% down · 7.5% · 30yr
- Down + closing
- —
- Monthly P&I
- —
- Monthly cashflow
- —
- DSCR
- —
- Eligible?
- —
Personal DTI + credit; lowest rate.
DSCR
20% down · 8.5% · 30yr
- Down + closing
- —
- Monthly P&I
- —
- Monthly cashflow
- —
- DSCR
- —
- Eligible?
- —
No personal income docs; deal must DSCR.
Hard money
10% down · 12.0% · 12mo
- Down + closing
- —
- Monthly P&I
- —
- Monthly cashflow
- —
- DSCR
- —
- Eligible?
- —
Short-term bridge; refi at stabilization.
Rent comps 19 comps
| Address | Beds | Baths | Sqft | Rent | $/sqft | DOM | Units | Dist |
|---|---|---|---|---|---|---|---|---|
| 206 E Belknap St Ennis, TX | 3.0 | 1.0 | 1442 | $1,700 | $1.18 | 45d | 1 | 0.20mi |
| 205 W Gilmer St Ennis, TX | 2.0 | 1.0 | 1052 | $1,495 | $1.42 | 14d | 1 | 0.24mi |
| 205 W Gilmer St Ennis, TX | 2.0 | 1.0 | 1052 | $1,400 | $1.33 | 8d | 1 | 0.24mi |
| 110 W Knox St Unit 202 Ennis, TX | 2.0 | 1.0 | 882 | $1,400 | $1.59 | 26d | 1 | 0.26mi |
| 508 W Baylor St Apt B Ennis, TX | 3.0 | 2.0 | 1260 | $1,495 | $1.19 | 23d | 1 | 0.36mi |
| 800 N Clay St Apt E14 Ennis, TX | 2.0 | 1.0 | 803 | $1,000 | $1.25 | 18d | 1 | 0.41mi |
| 715 W Tyler St Unit 715 Ennis, TX | 4.0 | 1.5 | 1000 | $1,700 | $1.70 | 45d | 1 | 0.47mi |
| 1203 N Clay St Unit 122 Ennis, TX | 2.0 | 2.0 | 1000 | $1,400 | $1.40 | 45d | 1 | 0.59mi |
| 910 W Knox St Unit B Ennis, TX | 2.0 | 2.0 | 1248 | $1,750 | $1.40 | 45d | 1 | 0.63mi |
| 605 SW Main St Ennis, TX | 2.0 | 1.0 | 784 | $1,500 | $1.91 | 26d | 1 | 0.69mi |
| 710 W Waco St Ennis, TX | 3.0 | 2.0 | 1092 | $1,750 | $1.60 | 14d | 1 | 0.76mi |
| 2001 Floyd St Ennis, TX | 4.0 | 2.0 | 1350 | $1,641 | $1.22 | 0d | 1 | 0.92mi |
| 2000 N Kaufman St Ennis, TX | 1.0–3.0 | 1.0 | 821 | $1,300 | $1.58 | 0d | 5 | 0.95mi |
| 914 S Chatfield St Ennis, TX | 2.0 | 2.0 | 948 | $1,595 | $1.68 | 7d | 1 | 1.01mi |
| 1050 E Burnett St Unit 1B Ennis, TX | 3.0 | 2.0 | 1164 | $1,595 | $1.37 | 45d | 1 | 1.01mi |
| 517 Cherry Ln Ennis, TX | 4.0 | 2.0 | 1440 | $1,975 | $1.37 | 14d | 1 | 1.10mi |
| 136 Highland Dr Ennis, TX | 3.0 | 1.0 | 1181 | $1,600 | $1.35 | 14d | 1 | 1.18mi |
| 136 Highland Dr Ennis, TX | 3.0 | 1.0 | 1181 | $1,600 | $1.35 | 45d | 1 | 1.18mi |
| 1803 W Ennis Ave Ennis, TX | 1.0–2.0 | 1.0–2.0 | 908 | $1,754 | $1.93 | 0d | 13 | 1.19mi |
Listing history 19 events
-
2026-05-07status Pending
-
2026-04-25historical Active Option Contract
-
2026-03-28price $125,000
-
2026-03-16status Active
-
2026-03-12historical Active Option Contract
-
2026-02-28$135,000 Active
-
2023-02-15status Pending
-
2023-02-06historical Active Option Contract
-
2023-02-06historical
-
2023-01-27$150,000 Active
-
2010-07-13soldstatus
-
2010-07-12soldstatus 381-char remark
Show marketing remark (381 chars)
INVESTMENT Property! Very large lot with newly pored concerte driveway. Large front porch, big storage shed remains, exterior compressor is fairly recent installed. Home is SOLD in AS IS condition with no repairs from buyer. Seller is open to any and all offers but due to property condition CASH or CONV offers would work best. Close to the center of town, I-45 and major streets.
-
2010-06-30historical 381-char remark
Show marketing remark (381 chars)
INVESTMENT Property! Very large lot with newly pored concerte driveway. Large front porch, big storage shed remains, exterior compressor is fairly recent installed. Home is SOLD in AS IS condition with no repairs from buyer. Seller is open to any and all offers but due to property condition CASH or CONV offers would work best. Close to the center of town, I-45 and major streets.
-
2010-06-10$50,000 381-char remark
Show marketing remark (381 chars)
INVESTMENT Property! Very large lot with newly pored concerte driveway. Large front porch, big storage shed remains, exterior compressor is fairly recent installed. Home is SOLD in AS IS condition with no repairs from buyer. Seller is open to any and all offers but due to property condition CASH or CONV offers would work best. Close to the center of town, I-45 and major streets.
-
2009-06-10soldstatus
-
2007-06-28soldstatus
-
2001-01-16soldstatus
-
1994-05-25soldstatus
-
1981-03-05soldstatus
ⓘ Source: listings_history table (triggers on properties + properties_extension) + one-shot
backfill from property_details.listing_events for pre-trigger history.
Tax reassessment forecast TX · Resets to sale price
- Current annual tax
- $3,298 · $275/mo
- Projected year-2 tax
- $3,298 · $275/mo
- Expected delta
- $0/yr ($0/mo · 0.0%)
ⓘ Screening estimate from a state-policy table — verify with the county assessor before closing.
Climate risk First Street
- Flood 1/10 Low FEMA zone X (unshaded) · 0% chance over 30 yrs
- Wildfire 4/10 Moderate
- Heat 7/10 Severe 7 d/yr ≥109°F today · 23 d/yr by 30 yrs out
- Wind 6/10 Major 27% chance of damaging wind over 30 yrs
- Air quality 2/10 Low 0 unhealthy d/yr today · 1 by 30 yrs out
Nearby sold comps map
Loading sold comps map…
Walkable amenities ~0.75 mi
Loading nearby amenities…
Taxation est. · year 1
- Rental income
- $19,823
- − Mortgage interest
- −$7,002
- − Property taxes
- −$3,298
- − Insurance
- −$625
- − Repairs & maintenance
- −$1,586
- − Management
- −$1,586
- − Depreciation
- −$3,636
- Taxable income
- $2,089
- Est. tax owed @ 24.0%
- −$501
- After-tax cash flow
- $3,369/yr
For passive investors: Depreciation is non-cash, so a rental often shows a tax loss while cash-flowing — sheltering income. Rental losses are passive: they offset passive income freely, and up to $25,000/yr can offset ordinary (W-2) income if you actively participate and your MAGI is under $100k (phasing out to $0 by $150k); unused losses carry forward. On sale, claimed depreciation is recaptured at up to 25%, and gains may owe capital-gains tax (a 1031 exchange can defer both). Figures are a year-1 estimate at your 24.0% rate — not tax advice; consult a CPA.
Schools (NCES district)
- District
- Ennis ISD
- NCES district ID
- 4818540
- Math proficiency
- 41% ▼ -6.00%
- Reading proficiency
- 39% ▼ -3.00%
- Median HH income
- $46,105
- Composite
- 34.14/100
- National rank
- #5283
- State rank
- #411 of 826 in TX
Livability — Ennis
- Score
- 71/100
- State rank
- #304
- US rank
- #6893
Category grades
Schools grade is shown separately in the Schools card above.
Census & demographics
- Census place
- Ennis, TX
- County
- Ellis County · 199,237 people
- City population
- 31,866
- Metro
- Dallas-Fort Worth-Arlington, TX
- Population (ZIP)
- 31,866
- Household income
- $77,053
- Rent vs Own
- Severe rent burden
- 784.0
Population outlook (Ellis County) Hauer SSP2
- Today (2025)
- 194,556 people
- By 2030
- 209,679 · +7.8%
- By 2040
- 238,837 · +22.8%
- By 2050
- 265,451 · +36.4%
- By 2075
- 326,571 · +67.9%
- By 2100
- 362,156 · +86.1%
Race, ethnicity, and origin ACS 2023
- Neighborhood character
- Diverse neighborhood (Simpson 0.60)
- Race & ethnicity
- White 47% Hispanic / Latino 41% Two or more races 13% Black 9%
- Hispanic origin (detail)
- Mexican 37%
- Common ancestry
- Slovak 1% Serbian 1% Italian 1%
- Foreign-born
- 15% · Canada
- Languages at home
- 69% English-only · Spanish 29% Other Indo-European 1%
Political lean MEDSL · Ellis
- 2024 margin
- Solid R (+31.1) · D 34.0% · R 65.1%
- 2008→2024 swing
- +11.2pp toward D · 2008: -42.2pp · 2024: -31.1pp
- All cycles
- 2024: R+31.1 2020: R+34.1 2016: R+45.4 2012: R+47.5 2008: R+42.2
Not yet ingested
- Civics
- —
Market trends
- HPI YoY
- ▼ -207.30%
- Current HPI
- 253.0134
- Rent YoY
- ▲ 2.95%
- Metro
- Dallas-Fort Worth-Arlington, TX
- State GDP YoY
- ▲ 3.95%
- F500 in state
- 110
Industry mix (Fortune 500 HQ in TX)
| Industry | F500 HQs | Revenue |
|---|---|---|
| Energy | 16 | $1,198B |
|
||
| Technology | 5 | $198B |
|
||
| Engineering / Construction | 4 | $72B |
|
||
| Energy Services | 3 | $60B |
|
||
| Utilities | 3 | $41B |
|
||
| Healthcare | 2 | $330B |
|
||
Price history
+150.0% since first listed19 events — show timeline
- 2026-05-07 Pending — NTREIS
- 2026-04-25 Contingent — NTREIS
- 2026-03-28 Price Changed $125,000 NTREIS
- 2026-03-16 Relisted — NTREIS
- 2026-03-12 Contingent — NTREIS
- 2026-02-28 Listed $135,000 NTREIS
- 2023-02-15 Pending — NTREIS
- 2023-02-06 Contingent — NTREIS
- 2023-02-06 Listing Removed — NTREIS
- 2023-01-27 Listed $150,000 NTREIS
- 2010-07-13 Sold (Public Records) — Public Records
- 2010-07-12 Sold (MLS) — NTREIS
- 2010-06-30 Listing Removed — NTREIS
- 2010-06-10 Listed $50,000 NTREIS
- 2009-06-10 Sold (Public Records) — Public Records
- 2007-06-28 Sold (Public Records) — Public Records
- 2001-01-16 Sold (Public Records) — Public Records
- 1994-05-25 Sold (Public Records) — Public Records
- 1981-03-05 Sold (Public Records) — Public Records
Property tax history
+6.3%/yrLatest (2025): $3,298 · +2.1% YoY. Source: county tax records.
Cash-flow waterfall
monthlySold comps — $/sqft
last 12 mo · ≤1 miLoading sold comps…