801 Sierra Vista Way #28 Way · Yreka, CA
Flood risk 1/10 · Minimal
- FEMA flood zone
- X (unshaded)
- Chance of flooding over 30 yrs
- 0.0%
- Est. flood insurance / yr
- $507 – $1,088
Fire risk 8/10 · Major
- Est. fire insurance / yr
- $659 – $1,223
Heat risk 5/10 · Moderate
- Hot days now (above 96°F)
- 6 days/yr
- Hot days in 30 yrs
- 13 days/yr
Wind risk 1/10 · Minimal
- Chance of severe wind over 30 yrs
- —
Air-quality risk 10/10 · Severe
- Unhealthy air days now
- 40 days/yr
- Unhealthy air days in 30 yrs
- 42 days/yr
Risk factors via First Street. Map © Google.
Why this score? — see what drove the F grade
The composite is a weighted blend of 9 inputs, each scored 0–100. Each bar is that input's sub-score; the figure is the points it added to the 100-point composite (weight × sub-score).
- ARV discount +7.5/15.0
- Cash flow +5.8/30.0
- Schools +3.9/10.0
- 1% rule +3.1/10.0
- Livability +3.0/5.0
- Rent growth +2.5/5.0
- Condition / age +2.5/5.0
- DSCR +0.2/10.0
- Appreciation +0.0/10.0
$139,000
🖨 Deal sheet (PDF) 📄 Offer letter ✓ Due diligence
Listing remarks MLS
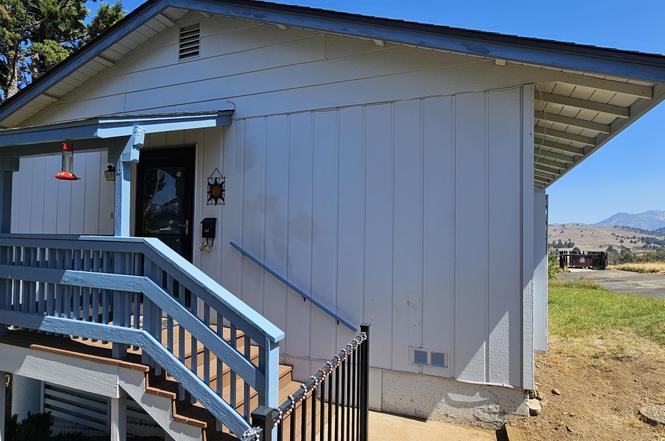
EXTREMELY WELL UPGRADED INCLUDING TILE FLOORING, BERBER CARPET, CUSTOM OAK CABINETRY WITH REMODELED KITCHEN INCLUDING APPLIANCES AND COUNTERTOPS. NEWER ROOF AND REBUILT HEAT PUMP ALONG WITH ENCLOSED AREA BELOW THE HOME PROVIDING TONS OF EXTRA STORAGE SPACE. THIS PLACE IS TRULY TURN-KEY FOR MANY YEARS TO COME!! IT HAS BEEN RENTED FOR $700 PER MONTH. OWNER KEEPING IT VACANT RIGHT NOW FOR EASE OF SHOWING. .. . THIS IS A STAND-ALONE UNIT WITH EASY ACCESS AND GREAT VIEWS.
Key facts
- Heat pump
- Community pool
- Newer roof
Tags
Property features AI
Finance
- Other: Zoning: R 3-12; Directions: Foothill to Sierra Vista; look for condo #28
Exterior
- Home design: Condo/Townhouse; Single-story
- Construction: Composition roof
- Exterior features: Deck; Sloped lot; Irregular lot shape
Interior
- Kitchen: Dishwasher; Microwave; Electric Range
- Flooring: Carpet; Laminate
- Heating & cooling: Central Air
- Interior features: Pantry
- Laundry & utility: Washer; Dryer
Neighborhood map
What this means for you Summary
Snapshot
- This is a 2-bed/1.0-bath condo listed at $139k.
Deal economics
- At list price, monthly cash flow is $-277 ($-3k/yr) — negative.
- The deal already cash-flows at list — no discount required.
- To meet the 1% rule (rent ≥ 1% of price), the offer needs to be $113k (19.0% below list).
- Recommended offer: $113k (19.0% below list) — sets the bar for 1% rule.
- Cap rate 3.9% vs local median 2.9% in Yreka — top-decile yield for the area; either an underpriced asset or a hidden risk that comps aren't pricing in. Stress-test before assuming the spread holds.
Location & tenants
- Location reads 60/100 on livability (#602 in CA) — a middle-class / working-renter tenant base. Strengths: health & safety A+, housing A; Watch: crime F, amenities F, commute F.
- Yreka Union High (town): math 25% / reading 65% proficiency, ranked #630 of 1,400 in CA (top 45%) — families likely to look elsewhere, expect single-tenant / working-renter base with shorter leases.
- Zoned schools: Evergreen Elementary (math 27% / reading 17%, grade F, #1,179 of 1,571 statewide, top 78%, 447 students, 71% FRL); Jackson Street Elementary (math 14% / reading 27%, grade F, #412 of 498 statewide, top 83%, 438 students, 70% FRL); Yreka High (math 37% / reading 82%, grade C+, #205 of 1,170 statewide, top 19%, 669 students, 52% FRL).
- Market conditions: 122 active listings in the ZIP; 2 comparable units currently listed for rent nearby; 50 units permitted in Siskiyou County in 2024 (0 in 5+ unit buildings).
Forward outlook
- Local home prices are declining (-3.0%/yr); year-one equity from $961 of loan paydown is wiped out by about $4k of value loss. Plan a longer hold.
- Siskiyou County population projected at -26% by 2050 — secular population decline; favor cash flow + early exit over multi-decade hold.
Negotiation context
- It's been on market 122 days — a 12% lower offer ($122k) is reasonable based on typical stale-listing flexibility.
- 2 sale attempts since 20y ago; this cycle's ask has dropped $10k (7%) from the opening price — seller is motivated, your offer sets the floor, not the list.
- Current owner paid $95k; 46% above their basis — modest negotiation headroom, anchor on the comps not their cost.
Risks & watch-outs
- Watch-outs: HOA is 26% of rent.
- Climate carrying-cost: severe wildfire risk; extreme-heat days projected 6→13/yr by 2055 (HVAC capex compounding) — expect insurance premiums to compound above CPI over the hold.
Questions for the listing agent
- What do current leases actually rent for vs. the listed asking? Can we see a recent rent roll and the last 12 months of T-12 income?
- It's been on market 122 days. Have you received any prior offers? Is the seller open to a 19% concession, seller financing, or rate buy-down credit?
- What does the HOA fee cover, when was the last increase, and are there any pending special assessments or reserve-fund shortfalls?
- Any open or pending special assessments — roof, HVAC, plumbing, elevator, façade? What's the per-unit balance and payoff schedule, and is the seller paying it off at close or rolling it to the buyer?
- Why hasn't it sold? Are there any deal-killer items the seller is aware of (foundation, flood, title, zoning, code violations)?
- Is there a deadline driving the sale (1031 exchange, divorce, estate, relocation)? That informs how much negotiation room exists.
- Schools are D-rated, which usually means shorter tenancies and higher turnover. Who's the typical renter profile here, and what's been the actual vacancy rate?
- Crime grade is F in this area — have there been break-ins, vandalism, or insurance claims at this property in the last 3 years? What carrier currently insures it and at what premium?
- The area grade is low — what's the realistic commute time and amenity access for the typical tenant pool here? Any planned neighborhood developments (good or bad) we should know about?
- What's the average days-on-market for RENTAL listings here right now (not sales)? A rising rental-DOM trend means longer vacancies and softer asking-rent achievability than the comps imply.
- What's the recent tenant-quality profile in this submarket — average credit score on applications, eviction rate, late-payment / NSF rate, and stable-employment percentage? A property-management company in the area should have these aggregated.
- How much new apartment / multifamily construction is in the pipeline within 1–3 miles? Heavy new supply (>2% of stock underway) typically softens rents 12–24 months out; light construction supports rent growth.
Investment metrics
- 1% rule
- 0.81% ✗
- Cap rate
- 3.90%
- Cash-on-cash
- -8.54%
- DSCR
- 0.62
- GRM
- 10.3
CMA / ARV
No comps found within radius.
Projected returns pro-forma
-3.0% appreciation · 3.0% rent growth · sell at horizon
- IRR
- -31.2%
- Equity multiple
- -0.03×
- Total profit
- $-40,029
- Equity at exit
- $20,725
- IRR
- -33.8%
- Equity multiple
- -0.46×
- Total profit
- $-56,998
- Equity at exit
- $12,018
Cash invested: $38,920 (down + closing). Projections, not guarantees.
Landlord ↔ Tenant lean methodology
- Overall (STATE)
- 18 Strongly Tenant-Friendly
- State California
- 18 Strongly Tenant-Friendly · D+13
- County
- — inherits STATE
- City
- — inherits STATE
ZIP-level market 96097
- Active inventory
- 122
- Price-to-rent
- 10.3×
Monthly cashflow live
- Estimated rent
- $1,126 medium interval (Pro) →
- Mortgage (P&I)
- −$729
- Tax from tax record
- −$90 /mo · $1,081/yr
- Insurance
- −$58
- HOA est. from 2 same-building comps
- −$290
- Vacancy / Maint / Mgmt
- −$237
- Net cashflow
- $-277
Break-even live
Sensitivity live
| Price | -10% $-198 | -5% $-238 | +0% $-277 | +5% $-316 | +10% $-356 |
|---|---|---|---|---|---|
| Rent | -10% $-366 | -5% $-322 | +0% $-277 | +5% $-233 | +10% $-188 |
| Rate | -1.0pp $-207 | -0.5pp $-242 | base $-277 | +0.5pp $-313 | +1.0pp $-350 |
UW: 25.0% down · 7.5% · 30yr · 1.5% tax · 5.0% vac · 8.0% maint · 8.0% mgmt
Financing live
Cash to close
- Down payment
- $34,750
- Closing costs
- $4,170
- Reserves months
- —
- Total cash needed
- —
Loan-product check · same deal, 3 products live
Conventional
25% down · 7.5% · 30yr
- Down + closing
- —
- Monthly P&I
- —
- Monthly cashflow
- —
- DSCR
- —
- Eligible?
- —
Personal DTI + credit; lowest rate.
DSCR
20% down · 8.5% · 30yr
- Down + closing
- —
- Monthly P&I
- —
- Monthly cashflow
- —
- DSCR
- —
- Eligible?
- —
No personal income docs; deal must DSCR.
Hard money
10% down · 12.0% · 12mo
- Down + closing
- —
- Monthly P&I
- —
- Monthly cashflow
- —
- DSCR
- —
- Eligible?
- —
Short-term bridge; refi at stabilization.
Rent comps 2 comps
| Address | Beds | Baths | Sqft | Rent | $/sqft | DOM | Units | Dist |
|---|---|---|---|---|---|---|---|---|
| 450 N Foothill Dr Yreka, CA | 2.0 | 1.0 | 750 | $1,152 | $1.54 | 45d | 1 | 0.14mi |
| 400 N Foothill Dr Yreka, CA | 3.0 | 2.0 | 1002 | $1,099 | $1.10 | 45d | 1 | 0.18mi |
HOA detail condo
- Monthly dues
- $0 · $0/yr
- Assessments
- None detected in remarks — confirm with the listing agent.
Listing history 25 events
-
2026-06-21days on market $139,000 Active 122 DOM
-
2026-06-19days on market $139,000 Active 120 DOM
-
2026-06-18days on market $139,000 Active 119 DOM
-
2026-06-17days on market $139,000 Active 118 DOM
-
2026-06-16days on market $139,000 Active 117 DOM
-
2026-06-15days on market $139,000 Active 116 DOM
-
2026-06-14days on market $139,000 Active 114 DOM
-
2026-06-12days on market $139,000 Active 113 DOM
-
2026-06-09days on market $139,000 Active 110 DOM
-
2026-06-08days on market $139,000 Active 109 DOM
-
2026-06-07days on market $139,000 Active 108 DOM
-
2026-06-04days on market $139,000 Active 104 DOM
-
2026-06-02days on market $139,000 Active 103 DOM
-
2026-06-01days on market $139,000 Active 102 DOM
-
2026-05-31days on market $139,000 Active 101 DOM
-
2026-05-31days on market $139,000 Active 100 DOM
-
2026-04-28price $139,000
-
2026-02-19$149,000 Active
-
2019-09-13soldstatus $95,000
-
2006-09-08soldstatus $138,500 471-char remark
Show marketing remark (471 chars)
EXTREMELY WELL UPGRADED INCLUDING TILE FLOORING, BERBER CARPET, CUSTOM OAK CABINETRY WITH REMODELED KITCHEN INCLUDING APPLIANCES AND COUNTERTOPS. NEWER ROOF AND REBUILT HEAT PUMP ALONG WITH ENCLOSED AREA BELOW THE HOME PROVIDING TONS OF EXTRA STORAGE SPACE. THIS PLACE IS TRULY TURN-KEY FOR MANY YEARS TO COME!! IT HAS BEEN RENTED FOR $700 PER MONTH. OWNER KEEPING IT VACANT RIGHT NOW FOR EASE OF SHOWING. .. . THIS IS A STAND-ALONE UNIT WITH EASY ACCESS AND GREAT VIEWS.
-
2006-09-08soldstatus $138,500
Show marketing remark (471 chars)
EXTREMELY WELL UPGRADED INCLUDING TILE FLOORING, BERBER CARPET, CUSTOM OAK CABINETRY WITH REMODELED KITCHEN INCLUDING APPLIANCES AND COUNTERTOPS. NEWER ROOF AND REBUILT HEAT PUMP ALONG WITH ENCLOSED AREA BELOW THE HOME PROVIDING TONS OF EXTRA STORAGE SPACE. THIS PLACE IS TRULY TURN-KEY FOR MANY YEARS TO COME!! IT HAS BEEN RENTED FOR $700 PER MONTH. OWNER KEEPING IT VACANT RIGHT NOW FOR EASE OF SHOWING. .. . THIS IS A STAND-ALONE UNIT WITH EASY ACCESS AND GREAT VIEWS.
-
2006-06-21$142,500 471-char remark
Show marketing remark (471 chars)
EXTREMELY WELL UPGRADED INCLUDING TILE FLOORING, BERBER CARPET, CUSTOM OAK CABINETRY WITH REMODELED KITCHEN INCLUDING APPLIANCES AND COUNTERTOPS. NEWER ROOF AND REBUILT HEAT PUMP ALONG WITH ENCLOSED AREA BELOW THE HOME PROVIDING TONS OF EXTRA STORAGE SPACE. THIS PLACE IS TRULY TURN-KEY FOR MANY YEARS TO COME!! IT HAS BEEN RENTED FOR $700 PER MONTH. OWNER KEEPING IT VACANT RIGHT NOW FOR EASE OF SHOWING. .. . THIS IS A STAND-ALONE UNIT WITH EASY ACCESS AND GREAT VIEWS.
-
2002-06-28soldstatus $63,000
-
1997-07-28soldstatus $62,500
-
1993-12-16soldstatus $46,000
ⓘ Source: listings_history table (triggers on properties + properties_extension) + one-shot
backfill from property_details.listing_events for pre-trigger history.
Tax reassessment forecast CA · Resets to sale price
- Current annual tax
- $1,081 · $90/mo
- Projected year-2 tax
- $1,081 · $90/mo
- Expected delta
- $0/yr ($0/mo · 0.0%)
ⓘ Screening estimate from a state-policy table — verify with the county assessor before closing.
Climate risk First Street
- Flood 1/10 Low FEMA zone X (unshaded) · 0% chance over 30 yrs
- Wildfire 8/10 Severe
- Heat 5/10 Major 6 d/yr ≥96°F today · 13 d/yr by 30 yrs out
- Wind 1/10 Low
- Air quality 10/10 Extreme 40 unhealthy d/yr today · 42 by 30 yrs out
Nearby sold comps map
Loading sold comps map…
Walkable amenities ~0.75 mi
Loading nearby amenities…
Taxation est. · year 1
- Rental income
- $13,516
- − Mortgage interest
- −$7,786
- − Property taxes
- −$1,081
- − Insurance
- −$695
- − Repairs & maintenance
- −$1,081
- − Management
- −$1,081
- − HOA
- −$3,480
- − Depreciation
- −$4,044
- Taxable loss
- −$5,732
- Est. tax savings @ 24.0%
- +$1,376
- After-tax cash flow
- $-1,950/yr
For passive investors: Depreciation is non-cash, so a rental often shows a tax loss while cash-flowing — sheltering income. Rental losses are passive: they offset passive income freely, and up to $25,000/yr can offset ordinary (W-2) income if you actively participate and your MAGI is under $100k (phasing out to $0 by $150k); unused losses carry forward. On sale, claimed depreciation is recaptured at up to 25%, and gains may owe capital-gains tax (a 1031 exchange can defer both). Figures are a year-1 estimate at your 24.0% rate — not tax advice; consult a CPA.
Schools (NCES district)
- District
- Yreka Union High
- NCES district ID
- 0643410
- Math proficiency
- 25% ▼ -15.00%
- Reading proficiency
- 65% ▬ 0.00%
- Median HH income
- $34,206
- Composite
- 39.28/100
- National rank
- #8184
- State rank
- #630 of 1400 in CA
Livability — Yreka
- Score
- 60/100
- State rank
- #602
- US rank
- #19325
Category grades
Schools grade is shown separately in the Schools card above.
Census & demographics
- Census place
- Yreka, CA
- Population (ZIP)
- 10,220
Population outlook (Siskiyou County) Hauer SSP2
- Today (2025)
- 39,337 people
- By 2030
- 36,930 · -6.1%
- By 2040
- 32,367 · -17.7%
- By 2050
- 29,030 · -26.2%
- By 2075
- 23,534 · -40.2%
- By 2100
- 19,312 · -50.9%
Race, ethnicity, and origin ACS 2023
- Neighborhood character
- Predominantly White (78%)
- Race & ethnicity
- White 78% Hispanic / Latino 12% Two or more races 10% Native American 4% Black 1%
- Hispanic origin (detail)
- Mexican 10%
- Common ancestry
- Russian 5% Italian 3% Slovak 2%
- Foreign-born
- 2% · Canada
- Languages at home
- 94% English-only · Spanish 5%
Political lean MEDSL · Siskiyou
- 2024 margin
- R (+19.2) · D 38.8% · R 58.0% · Other 3.2%
- 2008→2024 swing
- -8.8pp toward R · 2008: -10.4pp · 2024: -19.2pp
- All cycles
- 2024: R+19.2 2020: R+15.8 2016: R+20.7 2012: R+15.6 2008: R+10.4
Not yet ingested
- Civics
- —
Market trends
- HPI YoY
- ▼ -157.34%
- Current HPI
- 116.3252
- Rent YoY
- —
- Metro
- —
- State GDP YoY
- ▲ 3.21%
- F500 in state
- 116
Industry mix (Fortune 500 HQ in CA)
| Industry | F500 HQs | Revenue |
|---|---|---|
| Technology | 27 | $1,492B |
|
||
| Financial Services | 3 | $174B |
|
||
| Retail | 3 | $44B |
|
||
| Insurance | 3 | $26B |
|
||
| Media / Entertainment | 2 | $115B |
|
||
| Pharmaceuticals / Biotech | 2 | $62B |
|
||
Price history
+202.2% since first listed9 events — show timeline
- 2026-04-28 Price Changed $139,000 SMLS
- 2026-02-19 Listed $149,000 SMLS
- 2019-09-13 Sold (Public Records) $95,000 Public Records
- 2006-09-08 Sold (Public Records) $138,500 Public Records
- 2006-09-08 Sold (MLS) $138,500 SMLS
- 2006-06-21 Listed $142,500 SMLS
- 2002-06-28 Sold (Public Records) $63,000 Public Records
- 1997-07-28 Sold (Public Records) $62,500 Public Records
- 1993-12-16 Sold (Public Records) $46,000 Public Records
Property tax history
+4.0%/yrLatest (2025): $1,081 · +1.5% YoY. Source: county tax records.
Cash-flow waterfall
monthlySold comps — $/sqft
last 12 mo · ≤1 miLoading sold comps…