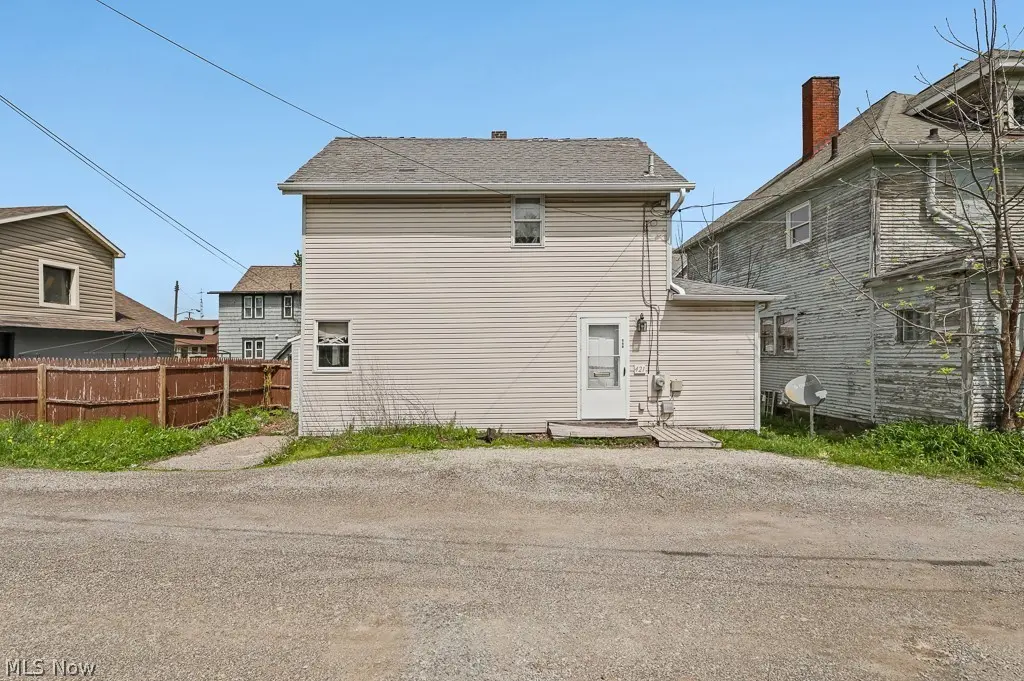
421 S Park Ave · Alliance, OH
Flood risk 1/10 · Minimal
- FEMA flood zone
- X (unshaded)
- Chance of flooding over 30 yrs
- 0.0%
- Est. flood insurance / yr
- $473 – $860
Fire risk 1/10 · Minimal
- Est. fire insurance / yr
- $713 – $1,323
Heat risk 3/10 · Minor
- Hot days now (above 97°F)
- 7 days/yr
- Hot days in 30 yrs
- 17 days/yr
Wind risk 1/10 · Minimal
- Chance of severe wind over 30 yrs
- —
Air-quality risk 2/10 · Minimal
- Unhealthy air days now
- 1 days/yr
- Unhealthy air days in 30 yrs
- 2 days/yr
Risk factors via First Street. Map © Google.
Why this score? — see what drove the B+ grade
The composite is a weighted blend of 9 inputs, each scored 0–100. Each bar is that input's sub-score; the figure is the points it added to the 100-point composite (weight × sub-score).
- Cash flow +30.0/30.0
- ARV discount +15.0/15.0
- 1% rule +10.0/10.0
- DSCR +10.0/10.0
- Livability +3.9/5.0
- Schools +3.5/10.0
- Rent growth +2.5/5.0
- Condition / age +2.5/5.0
- Appreciation +0.0/10.0
$74,900
🖨 Deal sheet 📄 Offer letter ✓ Due diligence
Listing remarks MLS
Great starter or rental property! All redone and ready to move in! Newer kitchen, electrical, paint, siding and much more! 1st floor laundry. 2 bedrooms up & 1 bedroom down. Don't pass this by! Call today
Key facts
- 1,981 sq ft lot
- Garage
- Built 1940
Property features AI
Finance
- Financial info: Annual tax amount listed (2025)
Exterior
- Parking: Attached garage (1 car)
- Utilities: Public water; Public sewer
- Home design: 2-story home; Above-grade finished living area about 1,062 (per assessor)
- Construction: Vinyl siding; Asphalt/fiberglass roof
- Exterior features: Small lot (approx. 0.0455 acres)
Interior
- Bathrooms: 1 full bathroom; 1 half bathroom; One main-level bathroom
- Heating & cooling: Gas heating
- Interior features: Full basement
Neighborhood map
What this means for you Summary
Snapshot
- This is a 3-bed/1.0-bath single-family listed at $75k.
Deal economics
- At list price, monthly cash flow is $437 ($5k/yr) — positive.
- The deal already cash-flows at list — no discount required.
- Meets the 1% rule at list price ($1k rent vs $75k).
- Recommended offer: $73k (3.0% below list) — sets the bar for market timing.
- Cap rate 13.3% vs local median 4.8% in Alliance — top-decile yield for the area; either an underpriced asset or a hidden risk that comps aren't pricing in. Stress-test before assuming the spread holds.
Location & tenants
- Location reads 78/100 on livability (#175 in OH, #2,737 nationally) — a middle-class / working-renter tenant base. Strengths: commute A+, cost of living A+, housing A+; Watch: amenities F, employment F.
- Alliance City (town): math 39% / reading 45% proficiency, ranked #536 of 656 in OH (top 82%) — families likely to look elsewhere, expect single-tenant / working-renter base with shorter leases; 71% free/reduced lunch — lower-income household profile, screen leases tightly.
- Market conditions: 166 active listings in the ZIP; 5 comparable units currently listed for rent nearby; rentals leasing fast (median 14d on market — plan ~1-2 weeks tenant-placement turnaround); 528 units permitted in Stark County in 2024 (84 in 5+ unit buildings).
Forward outlook
- Local home prices are declining (-3.0%/yr); year-one equity from $518 of loan paydown is wiped out by about $2k of value loss. Plan a longer hold.
- Stark County population projected to shrink 8% by 2050 — rents likely to lag national; underwrite the cash flow, not the appreciation.
- At projected returns (-3.0% appreciation + 3.0% rent growth), your $21k cash investment doubles in ~5 years — after that, you're playing with house money.
Negotiation context
- It's been on market 48 days — a 3% lower offer ($73k) is reasonable based on typical stale-listing flexibility.
- 2 sale attempts since 10y ago; this cycle's ask has dropped $5k (6%) from the opening price — seller is motivated, your offer sets the floor, not the list.
- Current owner paid $20k; list at $75k implies a 274% gain — meaningful room to come down on a strong offer.
Risks & watch-outs
- Watch-outs: built in 1940 — expect roof / HVAC / electrical / plumbing capex.
Questions for the listing agent
- It's been on market 48 days. Have you received any prior offers? Is the seller open to a 3% concession, seller financing, or rate buy-down credit?
- Built in 1940 — when were the roof, HVAC, electrical panel, plumbing, and water heater last replaced?
- Is there a deadline driving the sale (1031 exchange, divorce, estate, relocation)? That informs how much negotiation room exists.
- Schools are B-rated — typically a magnet for longer-tenancy family renters. What's the average tenant stay here, and is there a school-zone premium baked into asking?
- What's the average days-on-market for RENTAL listings here right now (not sales)? A rising rental-DOM trend means longer vacancies and softer asking-rent achievability than the comps imply.
- What's the recent tenant-quality profile in this submarket — average credit score on applications, eviction rate, late-payment / NSF rate, and stable-employment percentage? A property-management company in the area should have these aggregated.
- How much new for-sale + rental construction is in the pipeline within 1–3 miles? Heavy new supply typically softens prices + rents 12–24 months out; constrained supply supports both.
Investment metrics
- 1% rule
- 1.54% ✓
- Cap rate
- 13.29%
- Cash-on-cash
- 25.00%
- DSCR
- 2.11
- GRM
- 5.4
CMA / ARV
- ARV (median comp)
- $103,481
- List price
- $74,900
- Delta
- -27.62%
- Verdict
- UNDERPRICED
- Comps
- 20 within 1.0 mi
Show comp detail 12 sales within ~0.75 mi
| Address | Dist | Beds/Ba | Sqft | Sold | Price | $/sf | Match |
|---|---|---|---|---|---|---|---|
| 140 E High St | 0.07mi | 2/1.0 (-1) | 1,054 (-1%) | 12mo | $130,000 | $123 | 80 |
| 46 Rosenberry St | 0.35mi | 3/1.5 | 1,056 (-1%) | 2mo | $115,000 | $109 | 79 |
| 163 W Market St | 0.32mi | 3/1.0 | 1,187 (+12%) | 2mo | $110,000 | $93 | 64 |
| 134 E Summit St | 0.19mi | 3/1.0 | 1,192 (+12%) | 9mo | $66,930 | $56 | 63 |
| 252 W Summit St | 0.33mi | 3/1.5 | 1,138 (+7%) | 11mo | $110,000 | $97 | 62 |
| 326 N Park Ave | 0.46mi | 2/1.0 (-1) | 1,040 (-2%) | 10mo | $107,000 | $103 | 61 |
| 565 W Broadway St | 0.64mi | 3/1.0 | 1,040 (-2%) | 7mo | $146,700 | $141 | 61 |
| 38 W Washington St | 0.56mi | 3/1.0 | 1,120 (+6%) | 10mo | $125,000 | $112 | 56 |
| 732 E High St | 0.48mi | 3/1.5 | 1,144 (+8%) | 9mo | $116,000 | $101 | 55 |
| 215 Parkway Blvd | 0.69mi | 3/1.0 | 1,008 (-5%) | 12mo | $163,500 | $162 | 49 |
| 274 Selby St | 0.75mi | 3/1.0 | 988 (-7%) | 12mo | $105,000 | $106 | 44 |
| 1044 S Liberty Ave | 0.65mi | 4/1.0 (+1) | 1,212 (+14%) | 7mo | $90,000 | $74 | 36 |
Match score weights: distance 35% · size 25% · config 20% · recency 20%. Top-matched comps best support the ARV.
Projected returns pro-forma
-3.0% appreciation · 3.0% rent growth · sell at horizon
- IRR
- 18.4%
- Equity multiple
- 1.75×
- Total profit
- $15,678
- Equity at exit
- $11,168
- IRR
- 26.8%
- Equity multiple
- 3.36×
- Total profit
- $49,445
- Equity at exit
- $6,476
Cash invested: $20,972 (down + closing). Projections, not guarantees.
Landlord ↔ Tenant lean methodology
- Overall (STATE)
- 73 Landlord-Friendly
- State Ohio
- 73 Landlord-Friendly · R+6
- County
- — inherits STATE
- City
- — inherits STATE
ZIP-level market 44601
- Active inventory
- 166
- Price-to-rent
- 5.4×
Monthly cashflow live
- Estimated rent
- $1,155 high interval (Pro) →
- Mortgage (P&I)
- −$393
- Tax from tax record
- −$52 /mo · $620/yr
- Insurance
- −$31
- HOA
- −$0
- Vacancy / Maint / Mgmt
- −$243
- Net cashflow
- $437
Break-even live
UW: 25.0% down · 7.5% · 30yr · 1.5% tax · 5.0% vac · 8.0% maint · 8.0% mgmt
Financing live
Cash to close
- Down payment
- $18,725
- Closing costs
- $2,247
- Reserves months
- —
- Total cash needed
- —
Loan-product check · same deal, 3 products live
Conventional
25% down · 7.5% · 30yr
- Down + closing
- —
- Monthly P&I
- —
- Monthly cashflow
- —
- DSCR
- —
- Eligible?
- —
Personal DTI + credit; lowest rate.
DSCR
20% down · 8.5% · 30yr
- Down + closing
- —
- Monthly P&I
- —
- Monthly cashflow
- —
- DSCR
- —
- Eligible?
- —
No personal income docs; deal must DSCR.
Hard money
10% down · 12.0% · 12mo
- Down + closing
- —
- Monthly P&I
- —
- Monthly cashflow
- —
- DSCR
- —
- Eligible?
- —
Short-term bridge; refi at stabilization.
Rent comps 5 comps
| Address | Beds | Baths | Sqft | Rent | $/sqft | DOM | Units | Dist |
|---|---|---|---|---|---|---|---|---|
| 109 W Ely St Alliance, OH | 3.0 | 1.0 | 1344 | $1,300 | $0.97 | 13d | 1 | 0.47mi |
| 1329 Auld St Alliance, OH | 2.0 | 2.0 | 900 | $895 | $0.99 | 13d | 1 | 1.03mi |
| 1329 Auld St Unit 1329 Alliance, OH | 2.0 | 2.0 | 900 | $925 | $1.03 | 13d | 1 | 1.03mi |
| 734 Mill Cir Alliance, OH | 1.0–2.0 | 1.0 | 724 | $940 | $1.30 | 13d | 1 | 1.37mi |
| 2406 S Union Ave Alliance, OH | 4.0 | 2.0 | 1394 | $1,600 | $1.15 | 43d | 1 | 1.39mi |
Listing history 16 events
-
2026-06-15status $74,900 Pending 48 DOM
-
2026-06-15days on market $74,900 Active 48 DOM
-
2026-06-14days on market $74,900 Active 46 DOM
-
2026-06-13days on market $74,900 Active 45 DOM
-
2026-06-10days on market $74,900 Active 43 DOM
-
2026-06-09days on market $74,900 Active 42 DOM
-
2026-06-08days on market $74,900 Active 41 DOM
-
2026-06-07days on market $74,900 Active 40 DOM
-
2026-06-02days on market $74,900 Active 35 DOM
-
2026-06-01days on market $74,900 Active 34 DOM
-
2026-05-31days on market $74,900 Active 33 DOM
-
2026-05-30days on market $74,900 Active 32 DOM
-
2026-04-28$79,900 Active 379-char remark
-
2016-09-15soldstatus $20,000 Sold 211-char remark
Show marketing remark (211 chars)
Great starter or rental property! All redone and ready to move in! Newer kitchen, electrical, paint, siding and much more! 1st floor laundry. 2 bedrooms up & 1 bedroom down. Don't pass this by! Call today
-
2016-09-07status Pending 211-char remark
Show marketing remark (211 chars)
Great starter or rental property! All redone and ready to move in! Newer kitchen, electrical, paint, siding and much more! 1st floor laundry. 2 bedrooms up & 1 bedroom down. Don't pass this by! Call today
-
2016-08-29$19,900 Active 211-char remark
Show marketing remark (211 chars)
Great starter or rental property! All redone and ready to move in! Newer kitchen, electrical, paint, siding and much more! 1st floor laundry. 2 bedrooms up & 1 bedroom down. Don't pass this by! Call today
ⓘ Source: listings_history table (triggers on properties + properties_extension) + one-shot
backfill from property_details.listing_events for pre-trigger history.
Tax reassessment forecast OH · Partial reset (capped growth)
- Current annual tax
- $620 · $52/mo
- Projected year-2 tax
- $894 · $75/mo
- Expected delta
- +$274/yr (+$23/mo · 44.2%)
ⓘ Screening estimate from a state-policy table — verify with the county assessor before closing.
Climate risk First Street
- Flood 1/10 Low FEMA zone X (unshaded) · 0% chance over 30 yrs
- Wildfire 1/10 Low
- Heat 3/10 Moderate 7 d/yr ≥97°F today · 17 d/yr by 30 yrs out
- Wind 1/10 Low
- Air quality 2/10 Low 1 unhealthy d/yr today · 2 by 30 yrs out
Nearby sold comps map
Loading sold comps map…
Walkable amenities ~0.75 mi
Loading nearby amenities…
Taxation est. · year 1
- Rental income
- $13,861
- − Mortgage interest
- −$4,196
- − Property taxes
- −$620
- − Insurance
- −$374
- − Repairs & maintenance
- −$1,109
- − Management
- −$1,109
- − Depreciation
- −$2,179
- Taxable income
- $4,274
- Est. tax owed @ 24.0%
- −$1,026
- After-tax cash flow
- $4,216/yr
For passive investors: Depreciation is non-cash, so a rental often shows a tax loss while cash-flowing — sheltering income. Rental losses are passive: they offset passive income freely, and up to $25,000/yr can offset ordinary (W-2) income if you actively participate and your MAGI is under $100k (phasing out to $0 by $150k); unused losses carry forward. On sale, claimed depreciation is recaptured at up to 25%, and gains may owe capital-gains tax (a 1031 exchange can defer both). Figures are a year-1 estimate at your 24.0% rate — not tax advice; consult a CPA.
Schools (NCES district)
- District
- Alliance City
- NCES district ID
- 3904349
- Math proficiency
- 39% ▼ -9.00%
- Reading proficiency
- 45% ▼ -5.00%
- Median HH income
- $33,326
- Composite
- 34.54/100
- National rank
- #5176
- State rank
- #536 of 656 in OH
Livability — Alliance
- Score
- 78/100
- State rank
- #175
- US rank
- #2737
Category grades
Schools grade is shown separately in the Schools card above.
Census & demographics
- Census place
- Alliance, OH
- County
- Stark County · 272,865 people
- City population
- 32,696
- Metro
- Canton-Massillon, OH
- Population (ZIP)
- 32,696
- Household income
- $61,965
- Rent vs Own
- Severe rent burden
- 780.0
Population outlook (Stark County) Hauer SSP2
- Today (2025)
- 373,708 people
- By 2030
- 371,245 · -0.7%
- By 2040
- 361,331 · -3.3%
- By 2050
- 345,290 · -7.6%
- By 2075
- 302,669 · -19.0%
- By 2100
- 238,870 · -36.1%
Race, ethnicity, and origin ACS 2023
- Neighborhood character
- Predominantly White (87%)
- Race & ethnicity
- White 87% Black 6% Two or more races 5% Hispanic / Latino 1%
- Common ancestry
- Italian 3% Lithuanian 2% Slovak 2%
- Foreign-born
- 1%
- Languages at home
- 98% English-only · Spanish 1%
Political lean MEDSL · Stark
- 2024 margin
- Strong R (+21.9) · D 38.6% · R 60.5%
- 2008→2024 swing
- -27.4pp toward R · 2008: 5.5pp · 2024: -21.9pp
- All cycles
- 2024: R+21.9 2020: R+18.5 2016: R+17.4 2012: R+0.4 2008: D+5.5
Not yet ingested
- Civics
- —
Market trends
- HPI YoY
- ▼ -174.62%
- Current HPI
- 224.9507
- Rent YoY
- —
- Metro
- Canton-Massillon, OH
- State GDP YoY
- ▲ 1.98%
- F500 in state
- 48
Industry mix (Fortune 500 HQ in OH)
| Industry | F500 HQs | Revenue |
|---|---|---|
| Insurance | 3 | $145B |
|
||
| Industrial Machinery | 3 | $49B |
|
||
| Financial Services | 3 | $24B |
|
||
| Consumer Goods | 2 | $93B |
|
||
| Aerospace / Defense | 2 | $47B |
|
||
| Utilities | 2 | $33B |
|
||
Price history
+276.4% since first listed6 events — show timeline
- 2026-06-15 Pending — MLSNOW
- 2026-05-22 Price Changed $74,900 MLSNOW
- 2026-04-28 Listed $79,900 MLSNOW
- 2016-09-15 Sold (MLS) $20,000 MLSNOW
- 2016-09-07 Pending — MLSNOW
- 2016-08-29 Listed $19,900 MLSNOW
Property tax history
+34.5%/yrLatest (2024): $620 · +6.6% YoY. Source: county tax records.
Cash-flow waterfall
monthlySold comps — $/sqft
last 12 mo · ≤1 miLoading sold comps…