 🏷️ Likely Rental
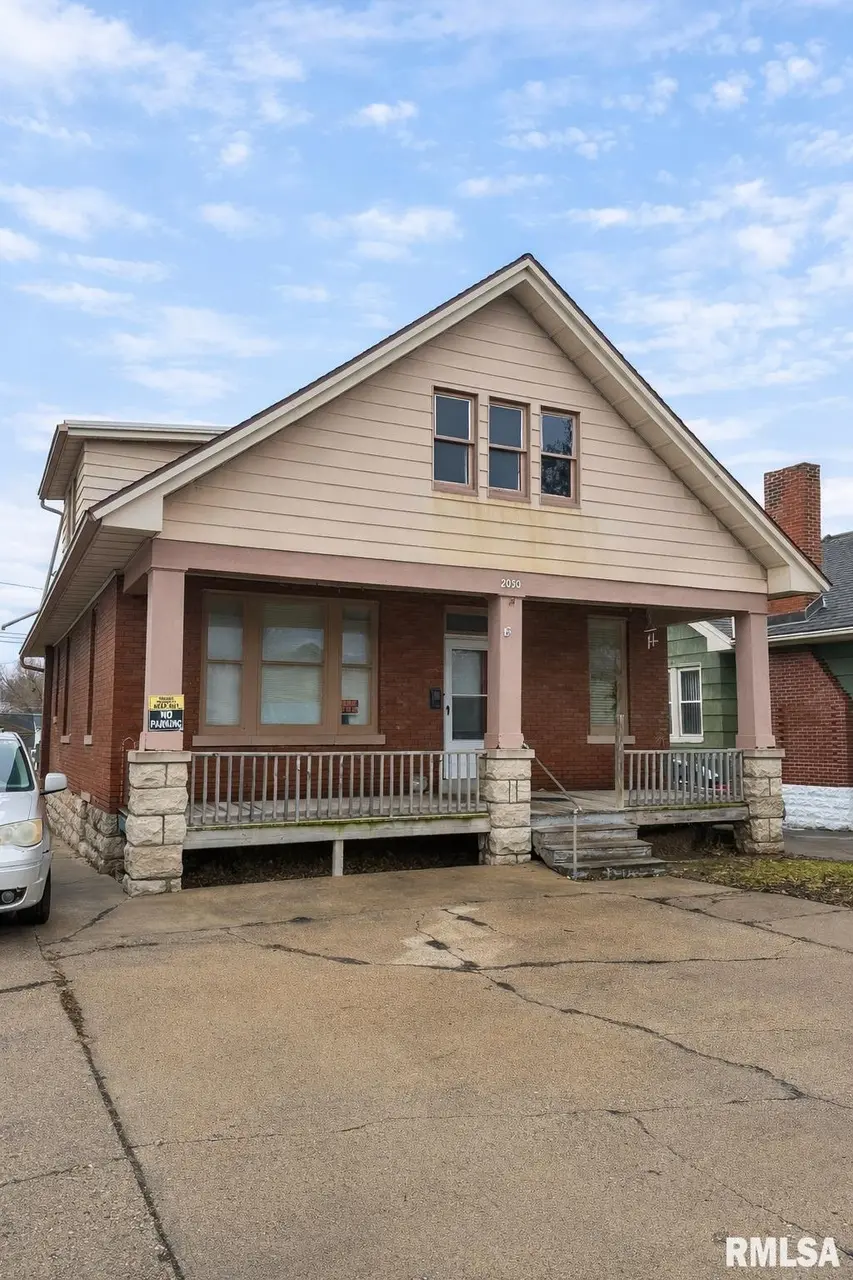
2050 Broadway St · Quincy, IL
Flood risk 1/10 · Minimal
- FEMA flood zone
- X (unshaded)
- Chance of flooding over 30 yrs
- 0.0%
- Est. flood insurance / yr
- $473 – $860
Fire risk 1/10 · Minimal
- Est. fire insurance / yr
- $804 – $1,492
Heat risk 4/10 · Minor
- Hot days now (above 106°F)
- 7 days/yr
- Hot days in 30 yrs
- 17 days/yr
Wind risk 2/10 · Minimal
- Chance of severe wind over 30 yrs
- —
Air-quality risk 2/10 · Minimal
- Unhealthy air days now
- 1 days/yr
- Unhealthy air days in 30 yrs
- 1 days/yr
Risk factors via First Street. Map © Google.
Why this score? — see what drove the C+ grade
The composite is a weighted blend of 9 inputs, each scored 0–100. Each bar is that input's sub-score; the figure is the points it added to the 100-point composite (weight × sub-score).
- Cash flow +19.1/30.0
- ARV discount +15.0/15.0
- 1% rule +6.1/10.0
- DSCR +6.0/10.0
- Appreciation +5.0/10.0
- Livability +3.4/5.0
- Rent growth +2.5/5.0
- Condition / age +2.5/5.0
- Schools +2.2/10.0
$99,500
🖨 Deal sheet (PDF) 📄 Offer letter ✓ Due diligence
Listing remarks MLS
Charming classic bungalow with fantastic curb appeal and a welcoming covered front porch, with alley access! This home offers spacious rooms throughout, creating a comfortable and functional layout. The kitchen features a nice pantry with built-in cabinetry for added storage and character. Just off the primary bedroom, you’ll find a cozy 7x8 sitting area, perfect for a reading nook, office space along with an updated bathroom. Original Hardwood floors below vinyl floors. A large, expandable floored attic provides excellent potential to easily finish for additional square footage. Outside, enjoy the convenience of a small garage/storage shed. Centrally located with Broadway frontage, this property offers great visibility and accessibility. Major updates completed in 2019 include a new furnace and updated electrical with 200 amp service. Property is being sold AS-IS. Tenant occupied – 24-hour notice required for all showings.
Key facts
- Covered front porch
- Cozy sitting area
- Nice pantry
Tags
Neighborhood map
What this means for you Summary
Snapshot
- This is a 2-bed/1.0-bath single-family listed at $100k.
Deal economics
- At list price, monthly cash flow is $106 ($1k/yr) — positive.
- The deal already cash-flows at list — no discount required.
- Meets the 1% rule at list price ($1k rent vs $100k).
- Recommended offer: $91k (9.0% below list) — sets the bar for market timing.
- Cap rate 7.6% vs local median 4.3% in Quincy — top-decile yield for the area; either an underpriced asset or a hidden risk that comps aren't pricing in. Stress-test before assuming the spread holds.
Location & tenants
- Location reads 67/100 on livability (#506 in IL) — a middle-class / working-renter tenant base. Strengths: cost of living A+, housing A+; Watch: schools D+, crime D, employment D.
- Quincy SD 172 (town): math 24% / reading 27% proficiency, ranked #328 of 620 in IL (top 53%) — low school quality limits family demand, transient renter base, plan for 1-2y turnover.
- Market conditions: 1 active listings in the ZIP; 3 comparable units currently listed for rent nearby; rentals lingering (median 45d on market — plan ~5-8 weeks vacancy on turnover, expect pricing pressure); 100% of comp listings sitting > 30 days — soft ceiling on asking rent; 68 units permitted in Adams County in 2024 (0 in 5+ unit buildings).
Forward outlook
- In year one you build about $4k of equity ($688 loan paydown + $3k appreciation (3.0% local appreciation)).
- Adams County population projected at -14% by 2050 — secular population decline; favor cash flow + early exit over multi-decade hold.
- At projected returns (3.0% appreciation + 3.0% rent growth), your $28k cash investment doubles in ~5 years — after that, you're playing with house money.
- By year 9, paydown + projected appreciation supports a ~$31k cash-out refi (75% LTV) — recoverable capital for the next deal without selling this one.
Negotiation context
- It's been on market 108 days — a 9% lower offer ($91k) is reasonable based on typical stale-listing flexibility.
- 4 sale attempts since 4y ago; this cycle's ask has dropped $6k (5%) from the opening price — seller is motivated, your offer sets the floor, not the list.
Questions for the listing agent
- It's been on market 108 days. Have you received any prior offers? Is the seller open to a 9% concession, seller financing, or rate buy-down credit?
- Why hasn't it sold? Are there any deal-killer items the seller is aware of (foundation, flood, title, zoning, code violations)?
- Is there a deadline driving the sale (1031 exchange, divorce, estate, relocation)? That informs how much negotiation room exists.
- Schools are D-rated, which usually means shorter tenancies and higher turnover. Who's the typical renter profile here, and what's been the actual vacancy rate?
- Crime grade is D in this area — have there been break-ins, vandalism, or insurance claims at this property in the last 3 years? What carrier currently insures it and at what premium?
- What's the average days-on-market for RENTAL listings here right now (not sales)? A rising rental-DOM trend means longer vacancies and softer asking-rent achievability than the comps imply.
- What's the recent tenant-quality profile in this submarket — average credit score on applications, eviction rate, late-payment / NSF rate, and stable-employment percentage? A property-management company in the area should have these aggregated.
- How much new for-sale + rental construction is in the pipeline within 1–3 miles? Heavy new supply typically softens prices + rents 12–24 months out; constrained supply supports both.
Investment metrics
- 1% rule
- 1.11% ✓
- Cap rate
- 7.58%
- Cash-on-cash
- 4.58%
- DSCR
- 1.20
- GRM
- 7.5
CMA / ARV
- ARV (median comp)
- $163,415
- List price
- $99,500
- Delta
- -39.11%
- Verdict
- UNDERPRICED
- Comps
- 20 within 1.0 mi
Show comp detail 12 sales within ~0.75 mi
| Address | Dist | Beds/Ba | Sqft | Sold | Price | $/sf | Match |
|---|---|---|---|---|---|---|---|
| 223 N 22nd | 0.10mi | 3/2.0 (+1) | 1,208 (-7%) | 3mo | $180,000 | $149 | 73 |
| 2219 Lind St | 0.47mi | 3/1.0 (+1) | 1,339 (+3%) | 0mo | $165,000 | $123 | 67 |
| 2727 College Ave | 0.62mi | 2/1.0 | 1,245 (-4%) | 3mo | $150,000 | $120 | 62 |
| 2526 Chestnut St | 0.62mi | 3/1.0 (+1) | 1,296 (0%) | 8mo | $165,000 | $127 | 60 |
| 2045 Chestnut | 0.55mi | 2/1.0 | 1,218 (-6%) | 6mo | $102,500 | $84 | 59 |
| 2061 Lind St | 0.46mi | 2/2.0 | 1,385 (+7%) | 6mo | $169,900 | $123 | 58 |
| 2807 College Ave | 0.68mi | 2/1.0 | 1,250 (-4%) | 6mo | $157,000 | $126 | 57 |
| 2611 Chestnut St | 0.70mi | 2/1.0 | 1,214 (-6%) | 0mo | $145,000 | $119 | 57 |
| 2042 Elm St | 0.35mi | 3/2.0 (+1) | 1,401 (+8%) | 6mo | $149,000 | $106 | 56 |
| 1406 Hampshire St | 0.62mi | 2/1.0 | 1,413 (+9%) | 1mo | $135,000 | $96 | 55 |
| 1512 Chestnut St | 0.73mi | 3/1.0 (+1) | 1,280 (-1%) | 6mo | $143,000 | $112 | 54 |
| 1633 Chestnut St | 0.67mi | 3/1.0 (+1) | 1,180 (-9%) | 2mo | $145,000 | $123 | 47 |
Match score weights: distance 35% · size 25% · config 20% · recency 20%. Top-matched comps best support the ARV.
Projected returns pro-forma
3.0% appreciation · 3.0% rent growth · sell at horizon
- IRR
- 11.8%
- Equity multiple
- 1.68×
- Total profit
- $18,822
- Equity at exit
- $44,740
- IRR
- 13.9%
- Equity multiple
- 3.07×
- Total profit
- $57,617
- Equity at exit
- $68,949
Cash invested: $27,860 (down + closing). Projections, not guarantees.
Landlord ↔ Tenant lean methodology
- Overall (STATE)
- 43 Moderately Tenant-Leaning
- State Illinois
- 43 Moderately Tenant-Leaning · D+7
- County
- — inherits STATE
- City
- — inherits STATE
ZIP-level market 62301-3224
- Active inventory
- 1
- Price-to-rent
- 7.5×
Monthly cashflow live
- Estimated rent
- $1,102 medium interval (Pro) →
- Mortgage (P&I)
- −$522
- Tax from tax record
- −$201 /mo · $2,410/yr
- Insurance
- −$41
- HOA
- −$0
- Vacancy / Maint / Mgmt
- −$231
- Net cashflow
- $106
Break-even live
Sensitivity live
| Price | -10% $163 | -5% $134 | +0% $106 | +5% $78 | +10% $50 |
|---|---|---|---|---|---|
| Rent | -10% $19 | -5% $63 | +0% $106 | +5% $150 | +10% $193 |
| Rate | -1.0pp $156 | -0.5pp $132 | base $106 | +0.5pp $81 | +1.0pp $54 |
UW: 25.0% down · 7.5% · 30yr · 1.5% tax · 5.0% vac · 8.0% maint · 8.0% mgmt
Financing live
Cash to close
- Down payment
- $24,875
- Closing costs
- $2,985
- Reserves months
- —
- Total cash needed
- —
Loan-product check · same deal, 3 products live
Conventional
25% down · 7.5% · 30yr
- Down + closing
- —
- Monthly P&I
- —
- Monthly cashflow
- —
- DSCR
- —
- Eligible?
- —
Personal DTI + credit; lowest rate.
DSCR
20% down · 8.5% · 30yr
- Down + closing
- —
- Monthly P&I
- —
- Monthly cashflow
- —
- DSCR
- —
- Eligible?
- —
No personal income docs; deal must DSCR.
Hard money
10% down · 12.0% · 12mo
- Down + closing
- —
- Monthly P&I
- —
- Monthly cashflow
- —
- DSCR
- —
- Eligible?
- —
Short-term bridge; refi at stabilization.
Rent comps 3 comps
| Address | Beds | Baths | Sqft | Rent | $/sqft | DOM | Units | Dist |
|---|---|---|---|---|---|---|---|---|
| 3100 State St Quincy, IL | 2.0 | 1.0 | 1000 | $785 | $0.79 | 44d | 1 | 1.08mi |
| 201 S 8th St Quincy, IL | 2.0 | 2.5 | 1785 | $1,800 | $1.01 | 44d | 1 | 1.17mi |
| 500 Maine St Quincy, IL | 1.0 | 1.0 | 937 | $700 | $0.75 | 44d | 1 | 1.40mi |
Listing history 26 events
-
2026-06-19days on market $99,500 Active 108 DOM
-
2026-06-18days on market $99,500 Active 107 DOM
-
2026-06-18price $99,500 Active 106 DOM
-
2026-06-17days on market $105,000 Active 106 DOM
-
2026-06-16days on market $105,000 Active 105 DOM
-
2026-06-15days on market $105,000 Active 104 DOM
-
2026-06-14days on market $105,000 Active 102 DOM
-
2026-06-12days on market $105,000 Active 101 DOM
-
2026-06-09days on market $105,000 Active 98 DOM
-
2026-06-08days on market $105,000 Active 97 DOM
-
2026-06-07days on market $105,000 Active 96 DOM
-
2026-06-03days on market $105,000 Active 92 DOM
-
2026-06-02days on market $105,000 Active 91 DOM
-
2026-06-01days on market $105,000 Active 90 DOM
-
2026-05-31days on market $105,000 Active 89 DOM
-
2026-05-30days on market $105,000 Active 88 DOM
-
2026-03-02$105,000 Active 953-char remark
Show marketing remark (953 chars)
Charming classic bungalow with fantastic curb appeal and a welcoming covered front porch, with alley access! This home offers spacious rooms throughout, creating a comfortable and functional layout. The kitchen features a nice pantry with built-in cabinetry for added storage and character. Just off the primary bedroom, you’ll find a cozy 7x8 sitting area, perfect for a reading nook, office space along with an updated bathroom. Original Hardwood floors below vinyl floors. A large, expandable floored attic provides excellent potential to easily finish for additional square footage. Outside, enjoy the convenience of a small garage/storage shed. Centrally located with Broadway frontage, this property offers great visibility and accessibility. Major updates completed in 2019 include a new furnace and updated electrical with 200 amp service. Property is being sold AS-IS. Tenant occupied – 24-hour notice required for all showings.
-
2025-06-29historical
-
2025-06-29historical
-
2025-06-28historical
-
2024-06-26price $110,000
-
2024-06-26price
-
2022-09-27historical
-
2022-04-28Active
-
2022-04-28$120,000 Active
-
2022-04-28Active
ⓘ Source: listings_history table (triggers on properties + properties_extension) + one-shot
backfill from property_details.listing_events for pre-trigger history.
Tax reassessment forecast IL · Partial reset (capped growth)
- Current annual tax
- $2,410 · $201/mo
- Projected year-2 tax
- $2,410 · $201/mo
- Expected delta
- $0/yr ($0/mo · 0.0%)
ⓘ Screening estimate from a state-policy table — verify with the county assessor before closing.
Climate risk First Street
- Flood 1/10 Low FEMA zone X (unshaded) · 0% chance over 30 yrs
- Wildfire 1/10 Low
- Heat 4/10 Moderate 7 d/yr ≥106°F today · 17 d/yr by 30 yrs out
- Wind 2/10 Low
- Air quality 2/10 Low 1 unhealthy d/yr today · 1 by 30 yrs out
Nearby sold comps map
Loading sold comps map…
Walkable amenities ~0.75 mi
Loading nearby amenities…
Taxation est. · year 1
- Rental income
- $13,222
- − Mortgage interest
- −$5,574
- − Property taxes
- −$2,410
- − Insurance
- −$498
- − Repairs & maintenance
- −$1,058
- − Management
- −$1,058
- − Depreciation
- −$2,895
- Taxable loss
- −$270
- Est. tax savings @ 24.0%
- +$65
- After-tax cash flow
- $1,341/yr
For passive investors: Depreciation is non-cash, so a rental often shows a tax loss while cash-flowing — sheltering income. Rental losses are passive: they offset passive income freely, and up to $25,000/yr can offset ordinary (W-2) income if you actively participate and your MAGI is under $100k (phasing out to $0 by $150k); unused losses carry forward. On sale, claimed depreciation is recaptured at up to 25%, and gains may owe capital-gains tax (a 1031 exchange can defer both). Figures are a year-1 estimate at your 24.0% rate — not tax advice; consult a CPA.
Schools (NCES district)
- District
- Quincy SD 172
- NCES district ID
- 1733000
- Math proficiency
- 24% ▬ 0.00%
- Reading proficiency
- 27% ▬ 0.00%
- Median HH income
- $44,132
- Composite
- 21.91/100
- National rank
- #8229
- State rank
- #328 of 620 in IL
Livability — Quincy
- Score
- 67/100
- State rank
- #506
- US rank
- #10458
Category grades
Schools grade is shown separately in the Schools card above.
Census & demographics
- Census place
- Quincy, IL
Population outlook (Adams County) Hauer SSP2
- Today (2025)
- 65,795 people
- By 2030
- 64,436 · -2.1%
- By 2040
- 61,007 · -7.3%
- By 2050
- 56,851 · -13.6%
- By 2075
- 46,424 · -29.4%
- By 2100
- 34,305 · -47.9%
Not yet ingested
- Political lean
- —
- Race & ethnicity
- —
- Common origin
- —
- Civics
- —
Market trends
- HPI YoY
- —
- Current HPI
- —
- Rent YoY
- —
- Metro
- —
- State GDP YoY
- ▲ 1.59%
- F500 in state
- 60
Industry mix (Fortune 500 HQ in IL)
| Industry | F500 HQs | Revenue |
|---|---|---|
| Insurance | 4 | $201B |
|
||
| Consumer Goods | 4 | $87B |
|
||
| Industrial Machinery | 3 | $64B |
|
||
| Healthcare | 2 | $55B |
|
||
| Retail / Pharmacy | 1 | $148B |
|
||
| Agriculture / Food | 1 | $86B |
|
||
Price history
-12.5% since first listed10 events — show timeline
- 2026-03-02 Listed $105,000 RMLSA as Distributed by MLS Grid
- 2025-06-29 Listing Removed — RMLSA as Distributed by MLS Grid
- 2025-06-29 Listing Removed — MRED as Distributed by MLS Grid
- 2025-06-28 Listing Removed — MRED as Distributed by MLS Grid
- 2024-06-26 Price Changed $110,000 Quincy AOR
- 2024-06-26 Price Changed — RMLSA as Distributed by MLS Grid
- 2022-09-27 Listing Removed — RMLSA as Distributed by MLS Grid
- 2022-04-28 Listed — MRED as Distributed by MLS Grid
- 2022-04-28 Listed $120,000 Quincy AOR
- 2022-04-28 Listed — RMLSA as Distributed by MLS Grid
Property tax history
+2.5%/yrLatest (2023): $2,410 · +5.8% YoY. Source: county tax records.
Cash-flow waterfall
monthlySold comps — $/sqft
last 12 mo · ≤1 miLoading sold comps…